A weekly Macro, Cross Asset review of prices trading at extremes which may generate future investment ideas and opportunities.
The following assets (on a weekly timeframe) either registered an Overbought or Oversold reading and/or have traded more than 2.5 standard deviations above or below its rolling mean.
Extremes “above” the Mean (at least 2.5 standard deviations)
Australian 10 year yield minus U.S. 10 year yield
Lean Hogs
AUD/JPY
USD/CNH
BOVESPA
S&P 500 Index
Overbought (RSI > 70)
Australian 2 year government bond yields
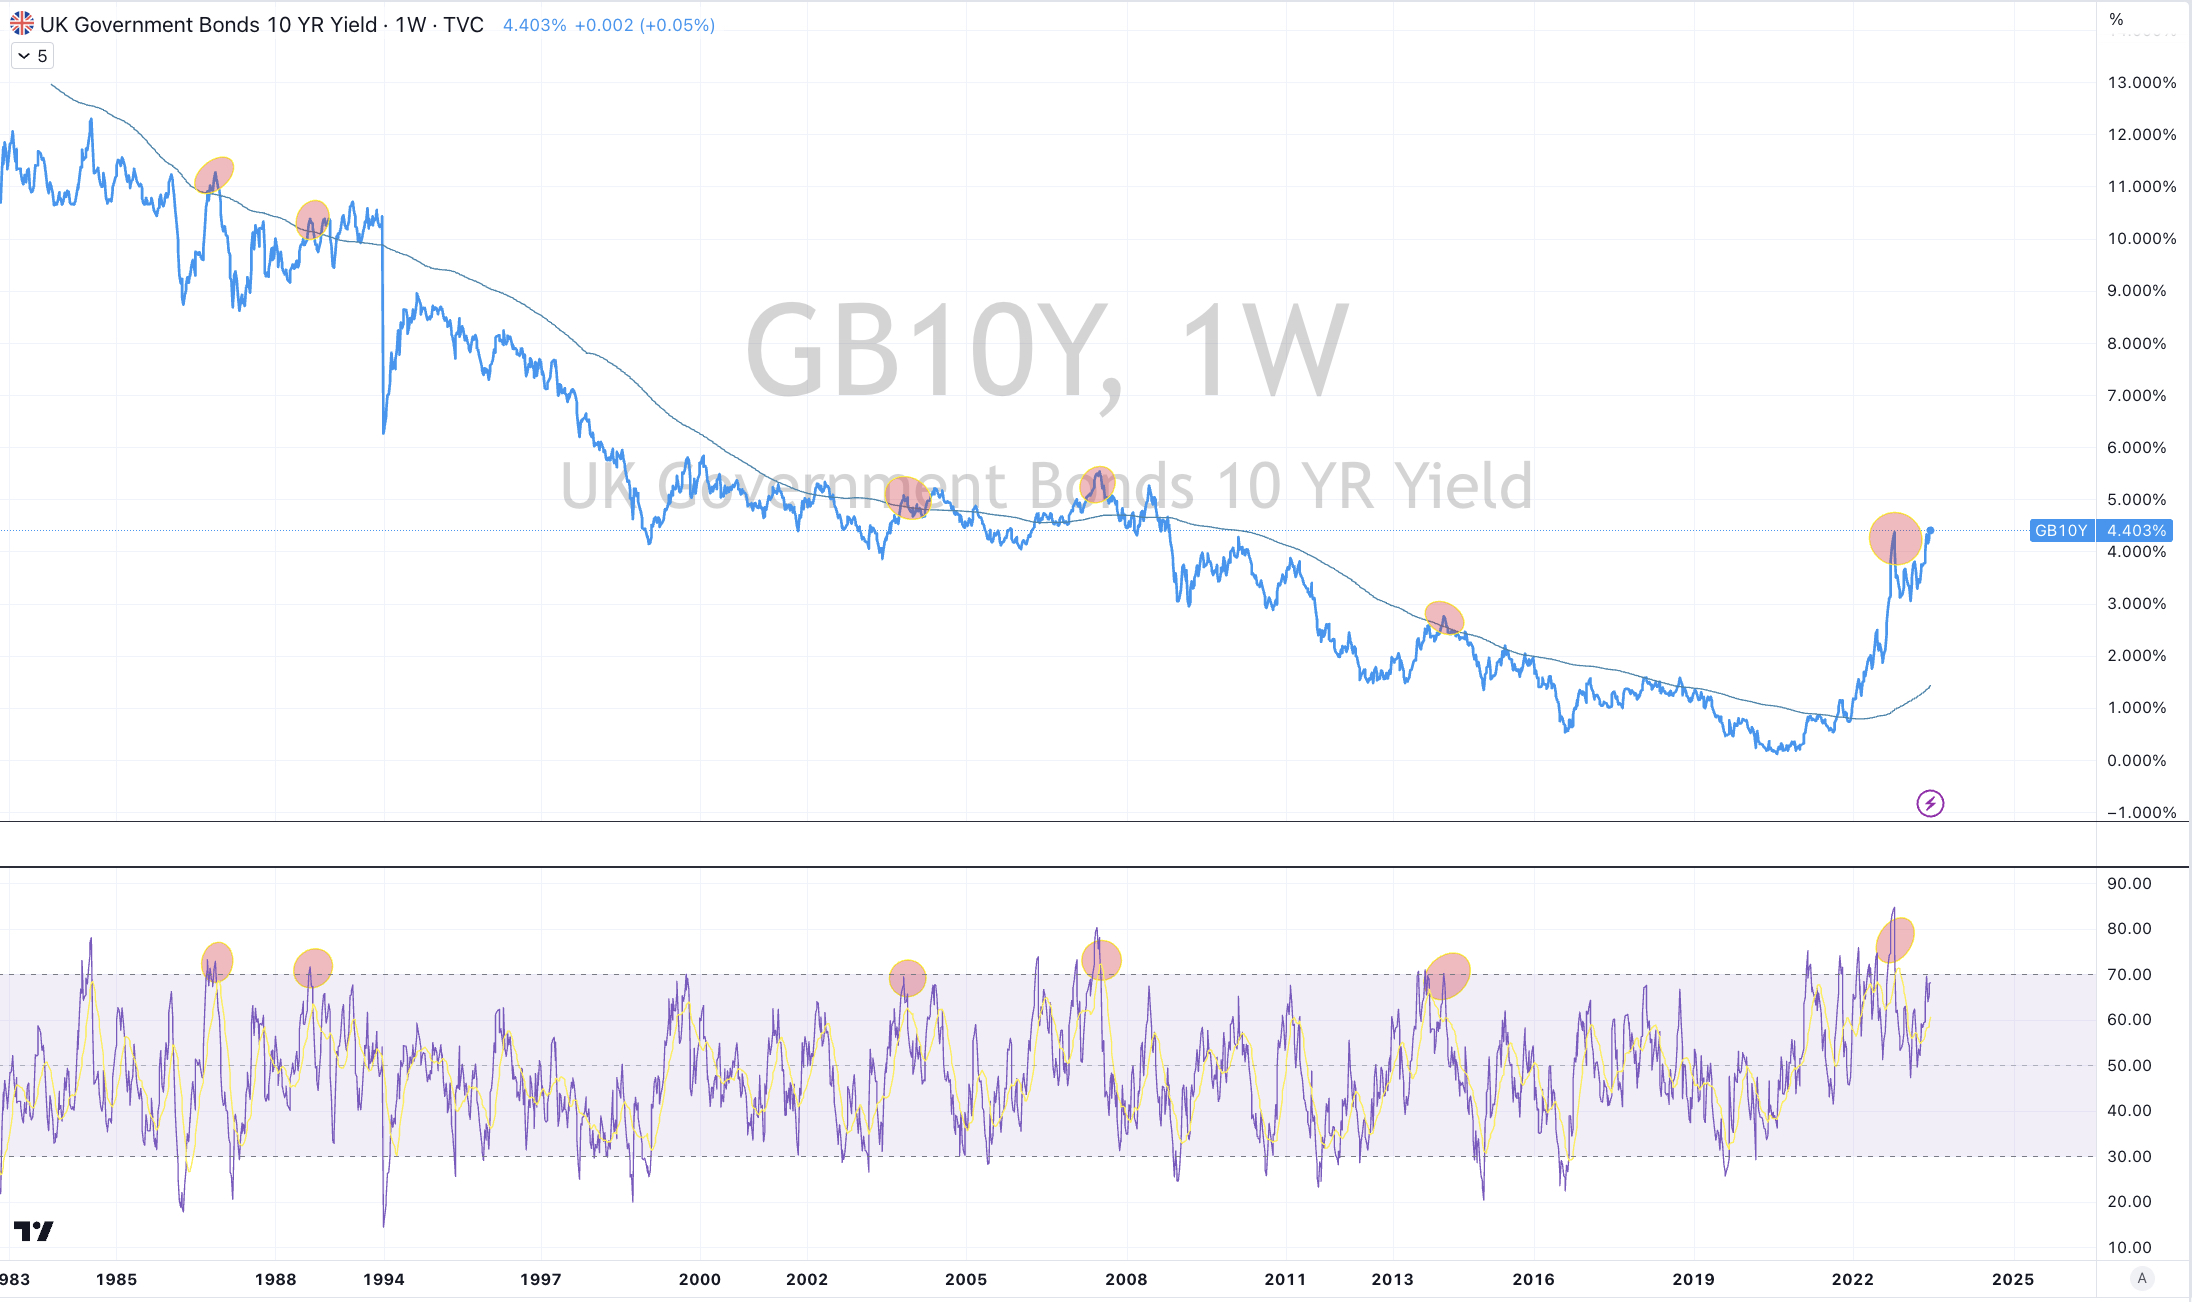
British 5 year government bond yields
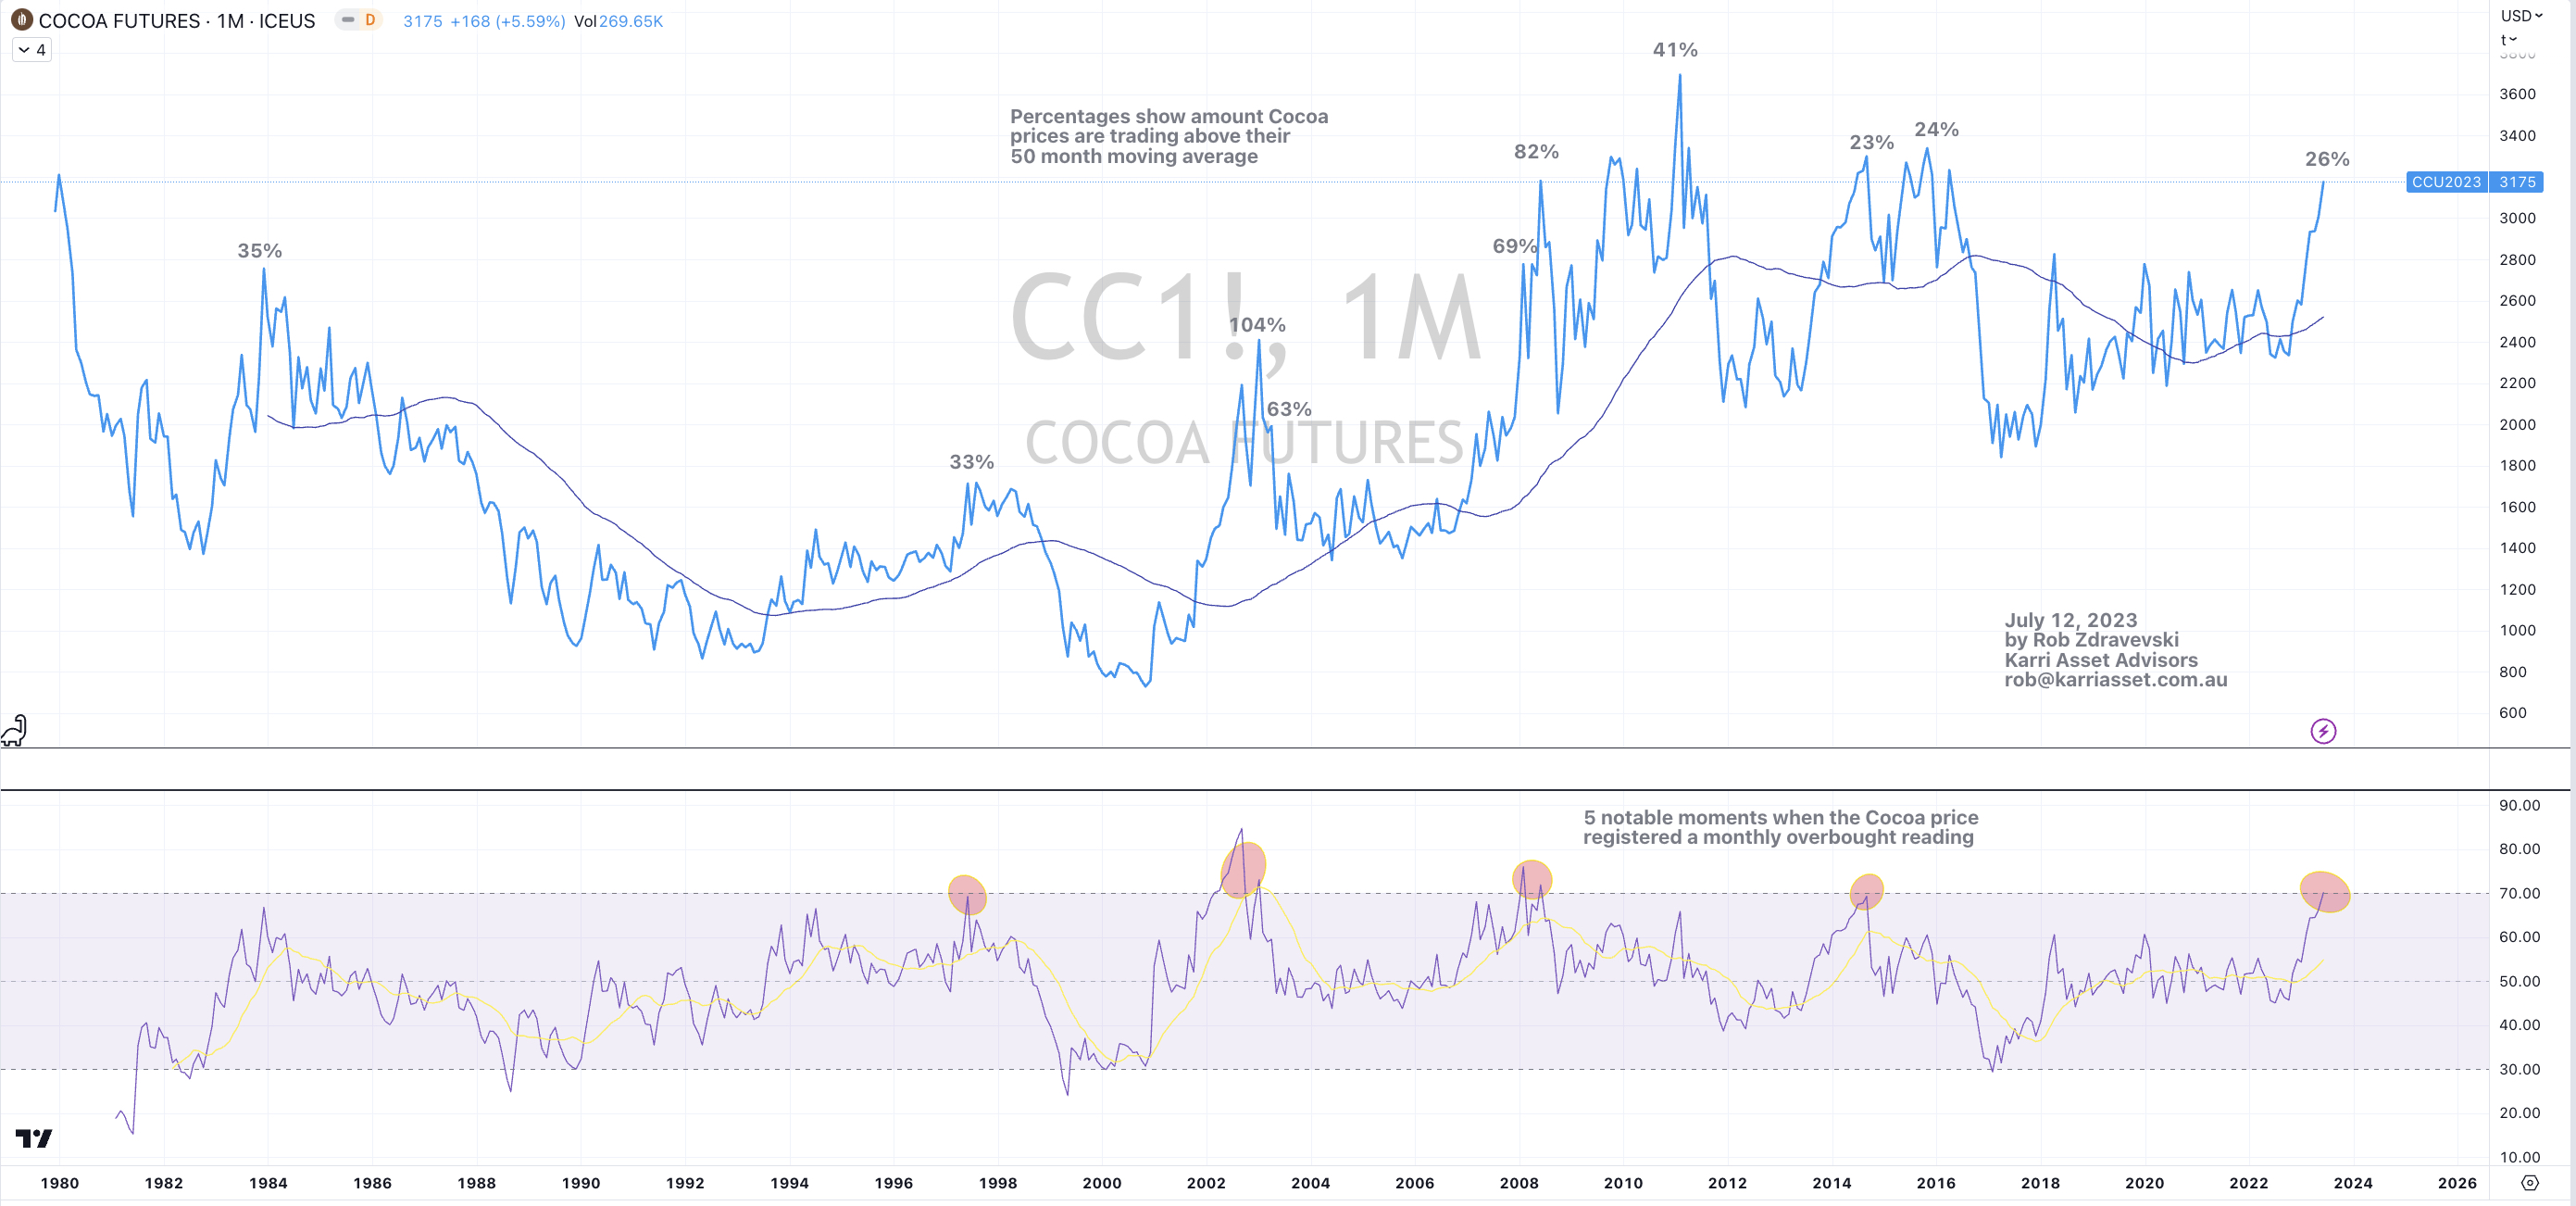
Cocoa
Cattle
Sugar
The Overbought Quinella – Both Overbought and Traded at > 2.5 standard deviations above the weekly mean)
British 2 & 3 year government bond yields
Taiwan’s TAEIX Index
Philadelphia Semiconductor Index (SOX)
Nikkei 225 Index
Nasdaq 100 Index
Nasdaq Composite Index
Uranium
Extremes “below” the Mean (at least 2.5 standard deviations)
U.S. 10 year bond yield minus Australian 10 year bond yield
U.S. 10 year bond yield divided by Australian 10 year bond yield
Oversold (RSI < 30)
Lithium Hydroxide
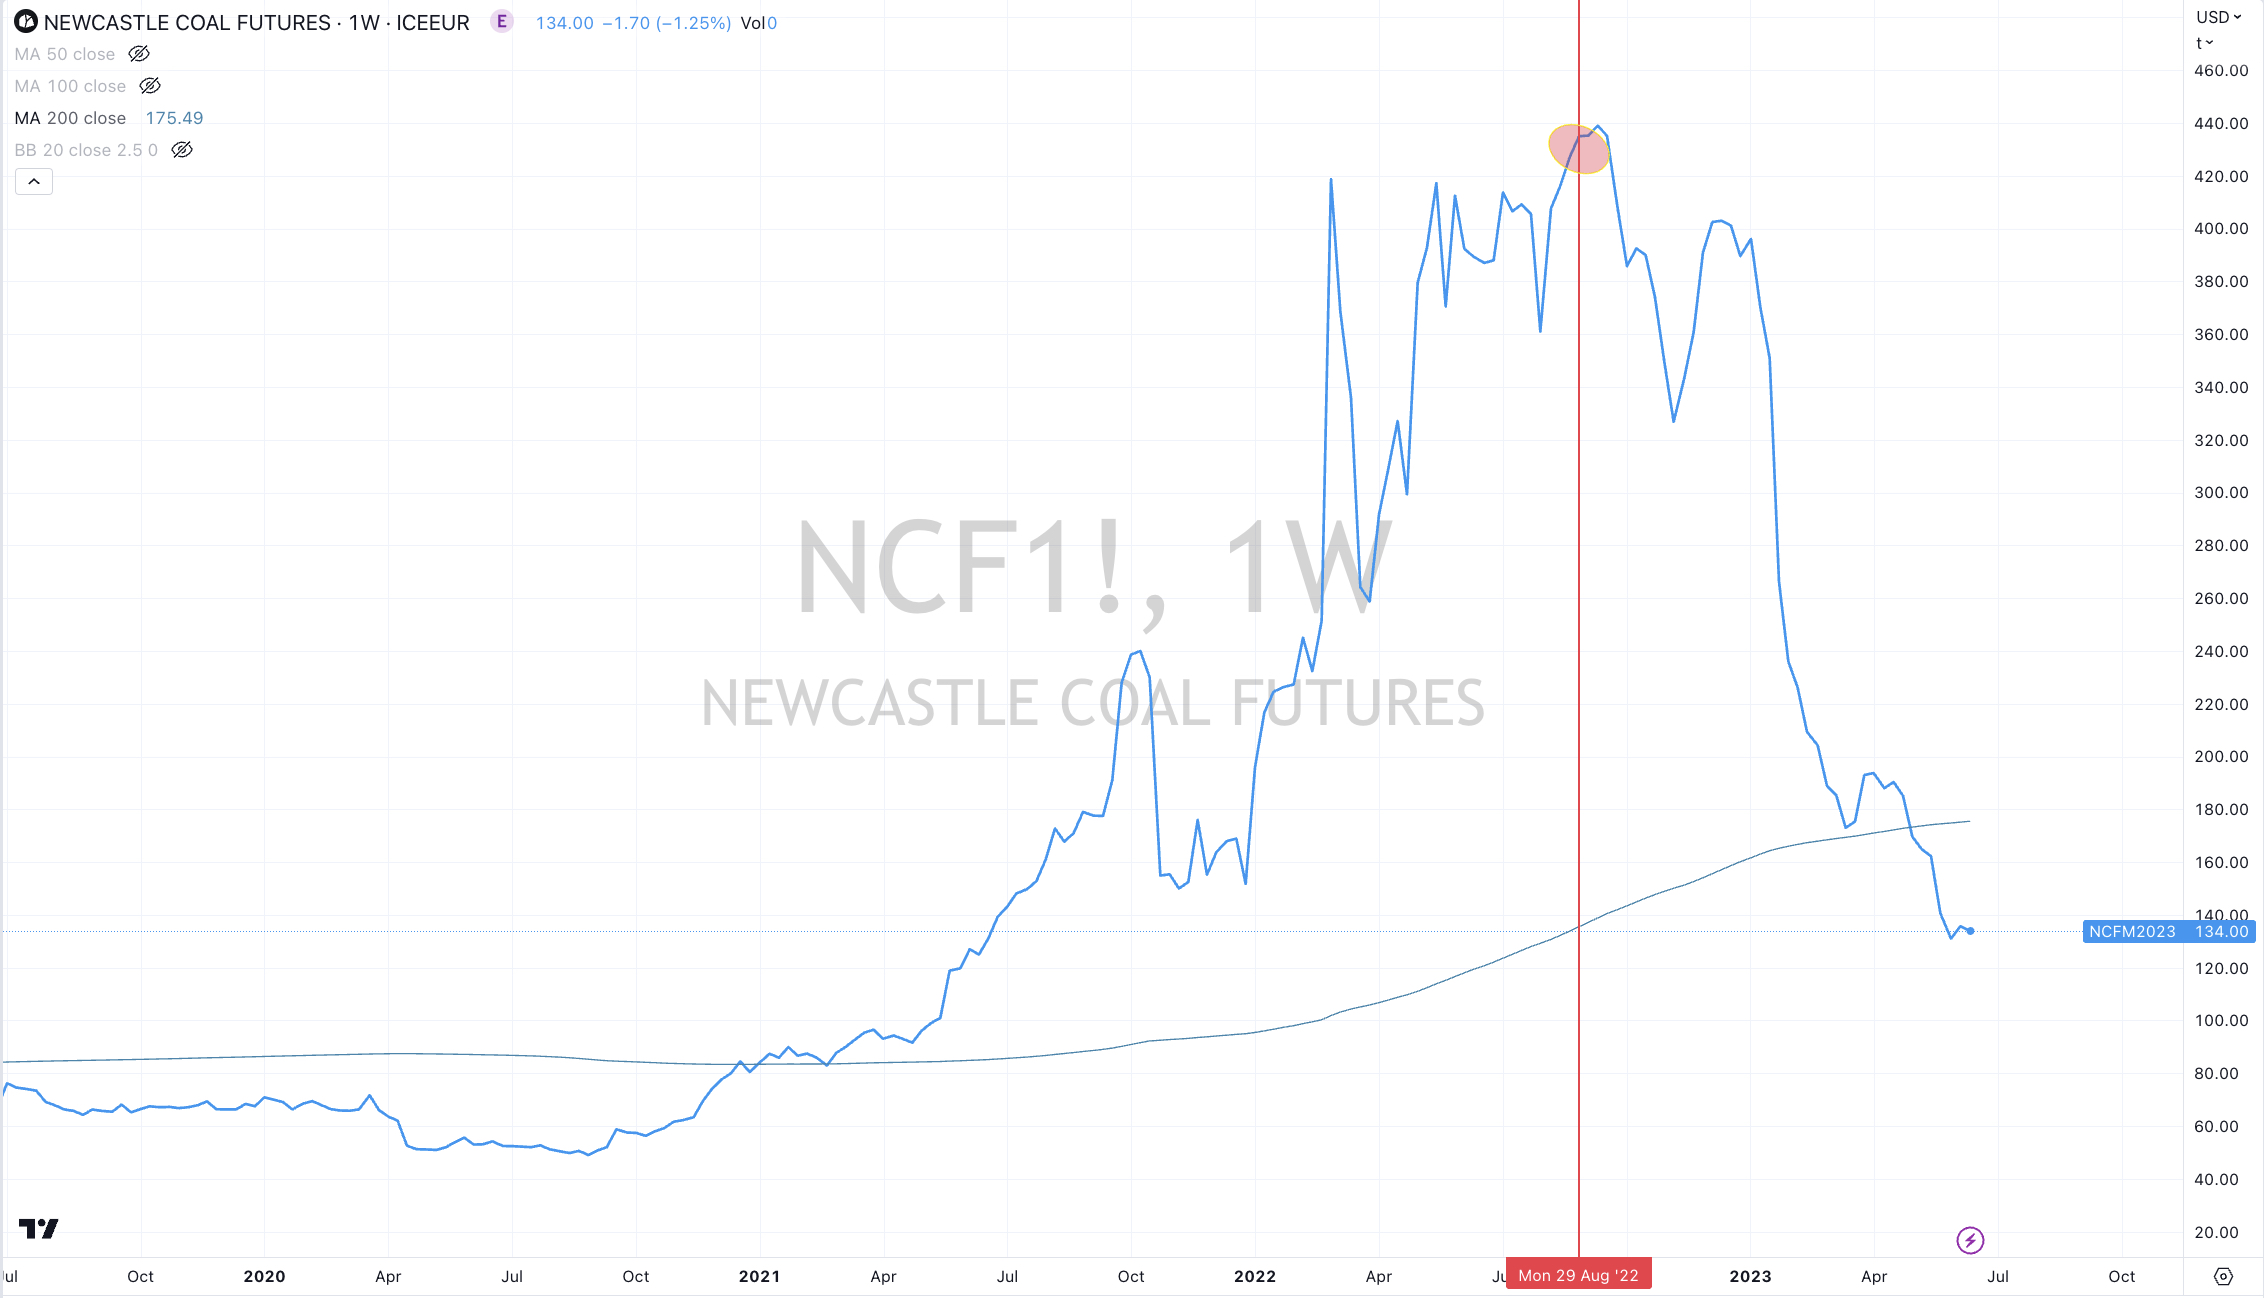
Newcastle Coal
Urea (Middle East)
The Oversold Quinella – Both Oversold and Traded at < 2.5 standard deviations below the weekly mean)
Australian 10 year minus 2 year bond yield spread
Notes & Ideas:
Equities were strong.
Nearly every equity market rose.
Chinese equity indices aren’t oversold this week.
Meanwhile, the S&P 500 has returned to overbought extreme territory for the first time since early November 2021.
The rotation) out of small and mid caps continued for a second week along with those rebounding U.S. banks which resulted in the larger cap and broader indices having a stellar week.
This move coincides with my recent writings (including client newsletters) that I was expecting this market to ‘rip’ higher. Some of the simple reasonings I provided were based on that was the direction where the market could do the most damage.
The Nasdaq Composite is now in a 8 week winning streak and registered an overbought quinella last seen in November 2021 Avid readers would recite that streaks lasting beyond 7 weeks are rare. In other words, ‘going long’ on the last couple days of this past week doesn’t provide the best odds and probability.
To test this theory, Japan’s Nikkei 225 Index just completed a 10 week rising streaks, cranking out a 22.5% advance.
While for some reference, the Dow Jones Industrials returned 1.2%, the S&P 400 Midcap advanced 1.2%, the Russell 200 rose 0.5%, Toronto’s TSX improved 0.4%, Australia’s Small Caps climbed 1.6% and the S&P Small Cap 600 firmed 0.3%.
Government bond yields broadly rose again, although the U.S. 3 month bill yield is no longer overbought.
We are still seeing some obscure bond yield spreads feature in this weeks list.
The Australian 2 and 3 yer bond yield are now in their 7th consecutive rising week with the latter closing at its highest yield since August 1st, 2011.
While I find it interesting that the 10 year yields in Spain, France, Germany, Australia, the U.S. and the U.K. are not making new highs.
Brazil’s bond yield has been moving in the opposite direction to many (see my note written earlier this week) and it nearing an oversold reading. I may write about interest rate differential soon.
The Australian 10 year minus 2 year bond yield spread close at its lowest point since July 2008 as it continued being oversold while it also traded 2.5 standard deviations below its weekly mean. The last time we saw this spread register both oversold extremes was in August 2019.
Commodities were strong across the board. Some prices soared and very few appear in the losing column this week.
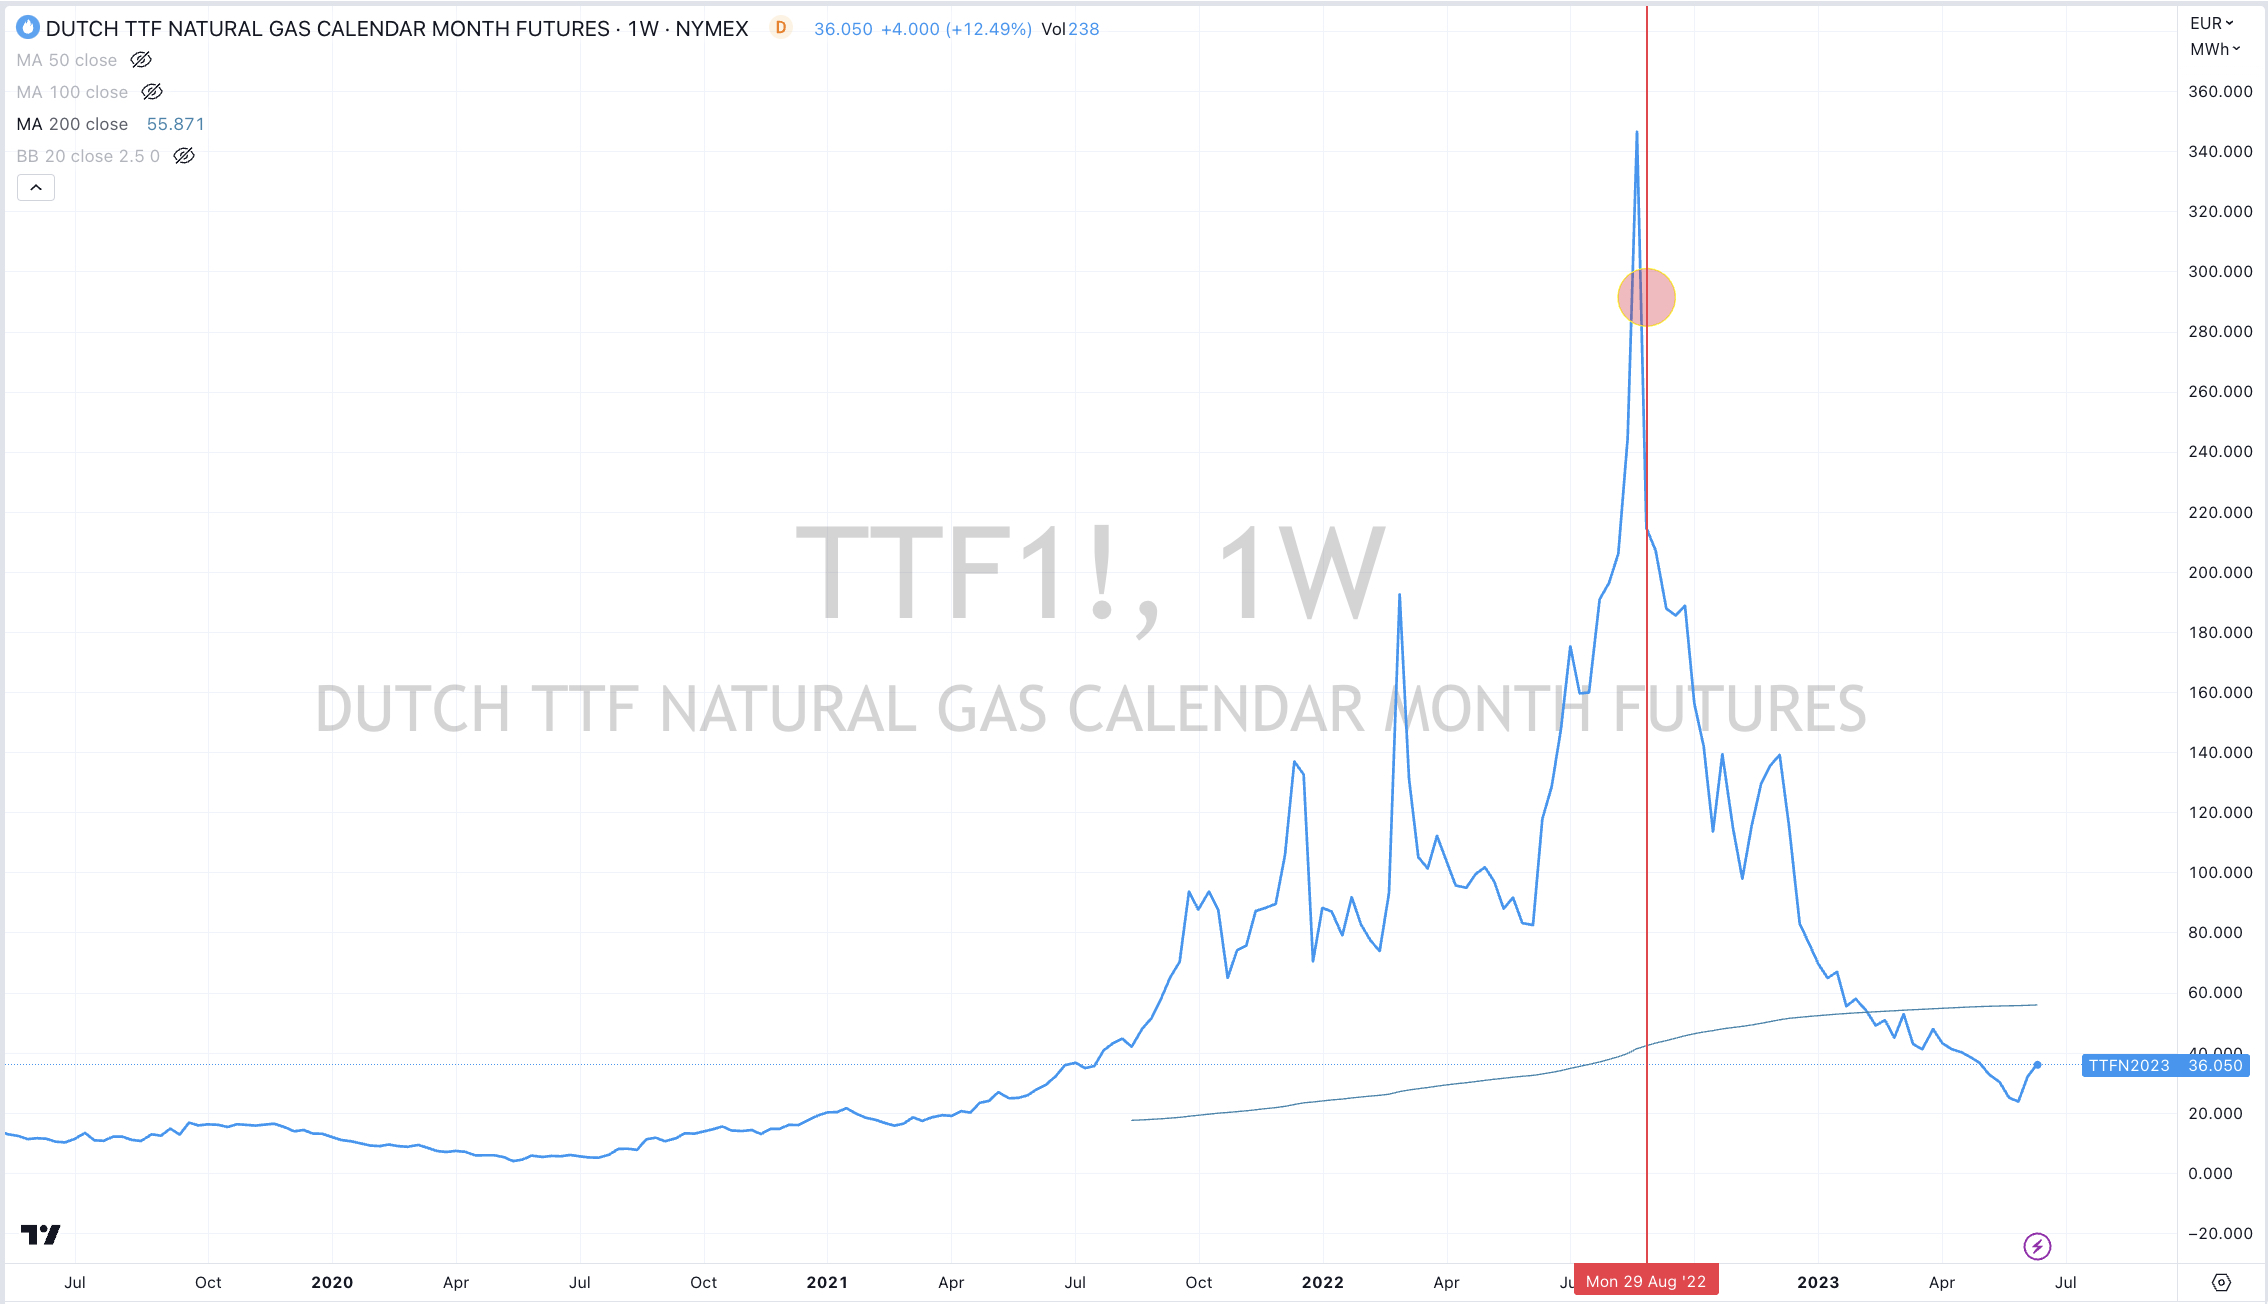
And so, the Dutch TTF and JKM LNG Gas markets aren’t oversold anymore nor is the U.S. Gulf Urea price.
Although, broadly speaking many of the moves may be categorised as a ‘bounce’ or an extension of mature bullish trends, rather than the beginning of new trends.
Agricultural’s were amongst the notable commodities which bounced well, although some contract expiration and ‘rolls’ affecting some prices.
Oats have risen 18% in the past 2 weeks, sugar is up 6% over the same time
In Currencies, “risk on’ for the week was evident, particularly seen in the AUD as it rose across its various crosses
The correlation in risk-taking explains the positive week seen in commodities and equities.
The AUD was strong again, adding 2% again most crosses, adding to last weeks 1.5% advance.
The Aussie notably rose 2.6% against the Indian Rupee for the week.
While the USD was weak compared all except the Yen.
The larger advancers over the past week comprised of;
Bloomberg Commodity Index 4.1%, Baltic Dry Index 2%, Cocoa 1.9%, WTI Crude Oil 2.5%, Gasoil 5.5%, Hogs 5.7%, Copper 2.6%, Copper/Gold Ratio 3%, Heating Oil 8.1%, JKM LNG 21% (even after a 18% drop on Friday), Lumber 2.9%, Tin 6.9%, Natural Gas 16.8%, Nickel 5.9%, Orange Juice 3%, Palladium 8.5%, Gasoline 3.4%, Sugar 4.1%, S&P GSCI 3.2%, CRB Index 4%, Dutch TTF Gas 9.2%, Brent Crude Oil 1.8%, Corn 13.3%, Oats 11.7%, Soybeans 11.9%, Wheat 11.3%, CSI 300 3.3%, AEX 1.8%, CAC 2.4%, DAX 2.6%, DJ Transports 3.9%, MIB 2.6%, HSCEI 3.7%, Hang Seng 3.4%, IBEX 2%, BOVESPA 1.5%, MOEX 3.4%, Nasdaq Composite 3.4%, Nasdaq Biotech Index 2%, Nasdaq 100 3.8%, Nikkei 225 4.5%, SOX 4.2%, S&P 500 2.6%, STI Index 2.3%, TAIEX 2.4%, Nasdaq Transports 3.5% and Australia’s ASX 200 rose 1.8%.
The group of decliners included;
Aluminium (3.1%), WTI Crude Oil (2.1%), Iron Ore (3.2%), Orange Juice (7.8%), Palladium (7.4%), Cotton (2.3%), Brent Crude Oil (1.7%), Corn (2.1%) and Switzerland’s SMI Index declined 1.7%.
June 18, 2023
by Rob Zdravevski
rob@karriasset.com.au