Selling British Pounds / Buying Japanese Yen

Sterling versus Yen is stretched and high

This study is a weekly chart which shows the percentage that the GBP/JPY is trading above its 200 week moving average.

It’s trading at 182.90 at the time of writing.

While overbought readings can stay overbought for longer than many expect and currencies do trend wonderfully, be my guest initiating a new long at these prices…..

…..for doing so isn’t the best risk/reward skew that you’ll find in capital markets.

June 30, 2023

by Rob Zdravevski

Karri Asset Advisors

rob@karriasset.com.au

Selling Euro / Buying Yen

I think that the ‘fat part’ of the Euro advance against the Yen has been seen.

Today’s price is 157.26

Not to be relied on in isolation but this study below shows the percentages which EUR/JPY is trading above its 200 week moving average……and when combined some other studies, it increases the probability of my belief.

Beyond your standard FX trade (currency conversion) this also means European customers and buyers of Japanese parts, components and product should order and pay for their Japanese products ‘tout suite’.

They should be at their cheapest prices seen in the past 3 years, even when considering Japan’s inflation rate of a ‘mere’ 3.2%.

June 30, 2023

by Rob Zdravevski

Karri Asset Advisors

rob@karriaseet.com.au

In global portfolios, FX and Equity are 2 separate trades

Since January 4, 2023, the Nikkei 225 (in JPY terms) has climbed 29%.

But from that date, the Yen has weakened 12%……(or the USD has strengthened by 12%)

and so in USD terms, the Nikkei 225 has only risen 17%.

But that’s history.

The lesson for those who are unhedged is multi-faceted.

Today, sellers of Japanese assets would do well holding onto their Yen, if you’re not forced to convert back to your ‘home’ or ‘base’ currency.

i.e. The Yen is too weak (and near extremes) to convert back to your original USD, EUR, GBP, CAD or AUD.

Those not holding any JPY, may ponder buying some Yen considering it’s current (near extremes) low.

If you are not naturally owning various currencies (in to settle your foreign acquisitions) nor running a FX hedging strategy, then treating the FX and Equity as 2 seperate trades and having specific views about each of them is important.

Otherwise you could’ve stayed in the USD the whole time, for the Nasdaq 100 soared 37% since January 4, 2023.

And for ‘non-natural’ USD holders, you would’ve made a few more percent as your ‘home’ currency most likely weakened against the Greenback.

June 30, 2023

by Rob Zdravevski

Karri Asset Advisors

rob@karriasset.com.au

Inflation follows the Natural Gas price

Here is the Australian inflation rate (the orange line) laid over the U.S. Henry Hub Natural Gas price (in blue).

This is another study to support my view of abating inflation.

I introduced this correlation in a post dated September 2, 2022, which was also when we saw a peak in the Natural Gas price.

A year earlier, I was citing that the ‘halving’ of commodity prices (driven by the theory of mean reversion) will be a large factor is providing relief from rising inflation.

But keep any near-term decline in inflation within context that proposed government (infrastructure) spending, lack of industrial and energy capital expenditure, declining commodity inventories (supply), energy transition investments and increased money supply (M2 and M3) all correlate towards being inflationary.

June 29, 2023

by Rob Zdravevski

Karri Asset Advisors

rob@karriasset.com.au

Revising Australian inflation target lower

As an addendum to yesterday’s note about where I see the Australian inflation rate moving to along with interest rates;

The chart below shows the symbiotic dance between the AUD/JPY currency cross and the Australian CPI reading.

AUD/JPY has just traded at some extreme overbought. I think the gravitational pull of its 200 week moving average will see Australian CPI record a reading of somewhere around 3.5% – 3.8% in the coming months.

This revises lower the 4.8%-5% view I had written in yesterday’s note.

June 29, 2023

by Rob Zdravevski

Karri Asset Advisors

rob@karriasset.com.au

What if Oil trades down to $51?

I’m keeping a sharp eye on the price of Crude Oil.

WTI Crude (chart below) is currently trading at $67.10.

Last week’s low of $63.64 needs to hold, then broadly the $61.50 mark.

WTI Crude Oil is in a downtrend and it has strength.

Forget about when OPEC+ made a surprise cut on April 2, 2023 and then OPEC announced more intended production cuts on June 4, 2023.

Not so good for any who paid the days tops of $82 and $75 on those respective days.

This week, WTI Crude is back, perching on its 200 week moving average and it’s not oversold.

If the strength of this downtrend accelerates and it barrels through mid $63’s and $61………..$51 may be a figure I start ogling.

June 28, 2023

by Rob Zdravevski

Karri Asset Advisors

rob@karriasset.com.au

Seeing Aussie inflation and interest rates

An Aussie inflation is abating…

Australian inflation rates have eased from 8.4% to 5.6%.

My notes are calling for 4.8% – 5% before (like the Canadian story in the immediately preceding post) inflation makes another move higher.

So, I’ll look for the Australian 2 year bond yields (currently 4.05%) to fall to the 3.60% – 3.35% range before rates embark on their next wave higher.

This move in interest rates should also extend the rally in growth stocks.

Also, watch for the AUD/USD to also decline a little more.

Until then, recent buyers of bonds will make money, perhaps equity like returns?

While that is playing out, I’m then looking for a 3rd wave of inflation in the form of ‘excuse inflation’ as prices of raw materials and finished products remain stubborn with sellers reluctant to discount and adjust.

It should be a short lived 3rd wave of inflation before meaningful demand destruction takes the upper hand and forces the sellers hand.

A later date, we’ll look for much more lower interest rates for the Aussie 2’s, maybe between 1.70% and 2.30%, 15 months from now?

That’s when bond owners will do very well.

June 28, 2023

by Rob Zdravevski

Karri Asset Advisors

rob@karriasset.com.au

Canadian inflation and interest rates

In my continuing story of expecting abating inflation….

Canadian inflation rates have completed their mean reversion to its 50 month moving average, as illustrated by the blue line in the chart below.

There may be one more lower print over the next month or so……

I expect Canadian interest rates to decline but not back to any type of mean.

I’ll look for the Canadian 2 year bond yields (currently 4.60%) to fall to the 4.20% – 4.05% range before rates embark on their next wave higher.

Until then, recent buyers of bonds will make money, perhaps equity like returns?

While that is playing out, I’m then looking for a 3rd wave of inflation in the form of ‘excuse inflation’ as prices of raw materials and finished products remain stubborn with sellers reluctant to discount and adjust.

It should be a short lived 3rd wave of inflation before meaningful demand destruction takes the upper hand and forces the sellers hand.

A later date, we’ll look for much more lower interest rates for the Canadian 2’s, maybe around 2.40% in a year’s time?

June 28, 2023

by Rob Zdravevski

rob@karriasset.com.au

Macro Extremes (week ending June 23, 2023)

A weekly Macro, Cross Asset review of prices trading at extremes which may generate future investment ideas and opportunities.

The following assets (on a weekly timeframe) either registered an Overbought or Oversold reading and/or have traded more than 2.5 standard deviations above or below its rolling mean.

Extremes “above” the Mean (at least 2.5 standard deviations)

Lean Hogs

AUD/JPY

USD/CNH

Overbought (RSI > 70)

British 5 year government bond yields

U.S. 3 month bill yields

Cocoa 

Oats

Nasdaq 100

Nikkei 225

And Russia’s MOEX & Taiwan’s TAIEX equity index

The Overbought Quinella – Both Overbought and Traded at > 2.5 standard deviations above the weekly mean)

British 2 & 3 year government bond yields

Extremes “below” the Mean (at least 2.5 standard deviations)

Coffee

Oversold (RSI < 30)

Brazil 10 year government bond yields 

Lithium Hydroxide 

Newcastle Coal 

Urea (Middle East)

CNH/USD

MYR/USD

The Oversold Quinella – Both Oversold and Traded at < 2.5 standard deviations below the weekly mean)

Australian 10 year minus 2 year bond yield spread

Notes & Ideas:

Equities were lower across the globe.

Most of the index losses over the past erased the previous 2 weeks of gains.  

The Nasdaq Composite isn’t overbought this week while the more concentrated Nasdaq 100 remains so. The former snapped its 8 week winning streak.

Japan’s Nikkei 225 also saw an end to its gravity defying 10 consecutive week of gains. 

The S&P 500 and the SOX has eased away from overbought territory.

The KRE Regional Bank Index fell 8% this past week to see it close at the same price seen a month ago. Since its May 12th close, it has risen 8% in total.

We saw many indices registers declines of 2% or more over the week, although the Nasdaq 100 and S&P 500 ‘only’ declined 1.4%.

Worthy to watch is the bearish outside reversal week that Australia’s (XSO) Small Cap index registered.

Most Government bond yields fell.

Swedish, British and shorter duration American yields were the exception.

The U.S. 2’s saw their highest closing yield in 4 months but are not making a ‘higher high’.

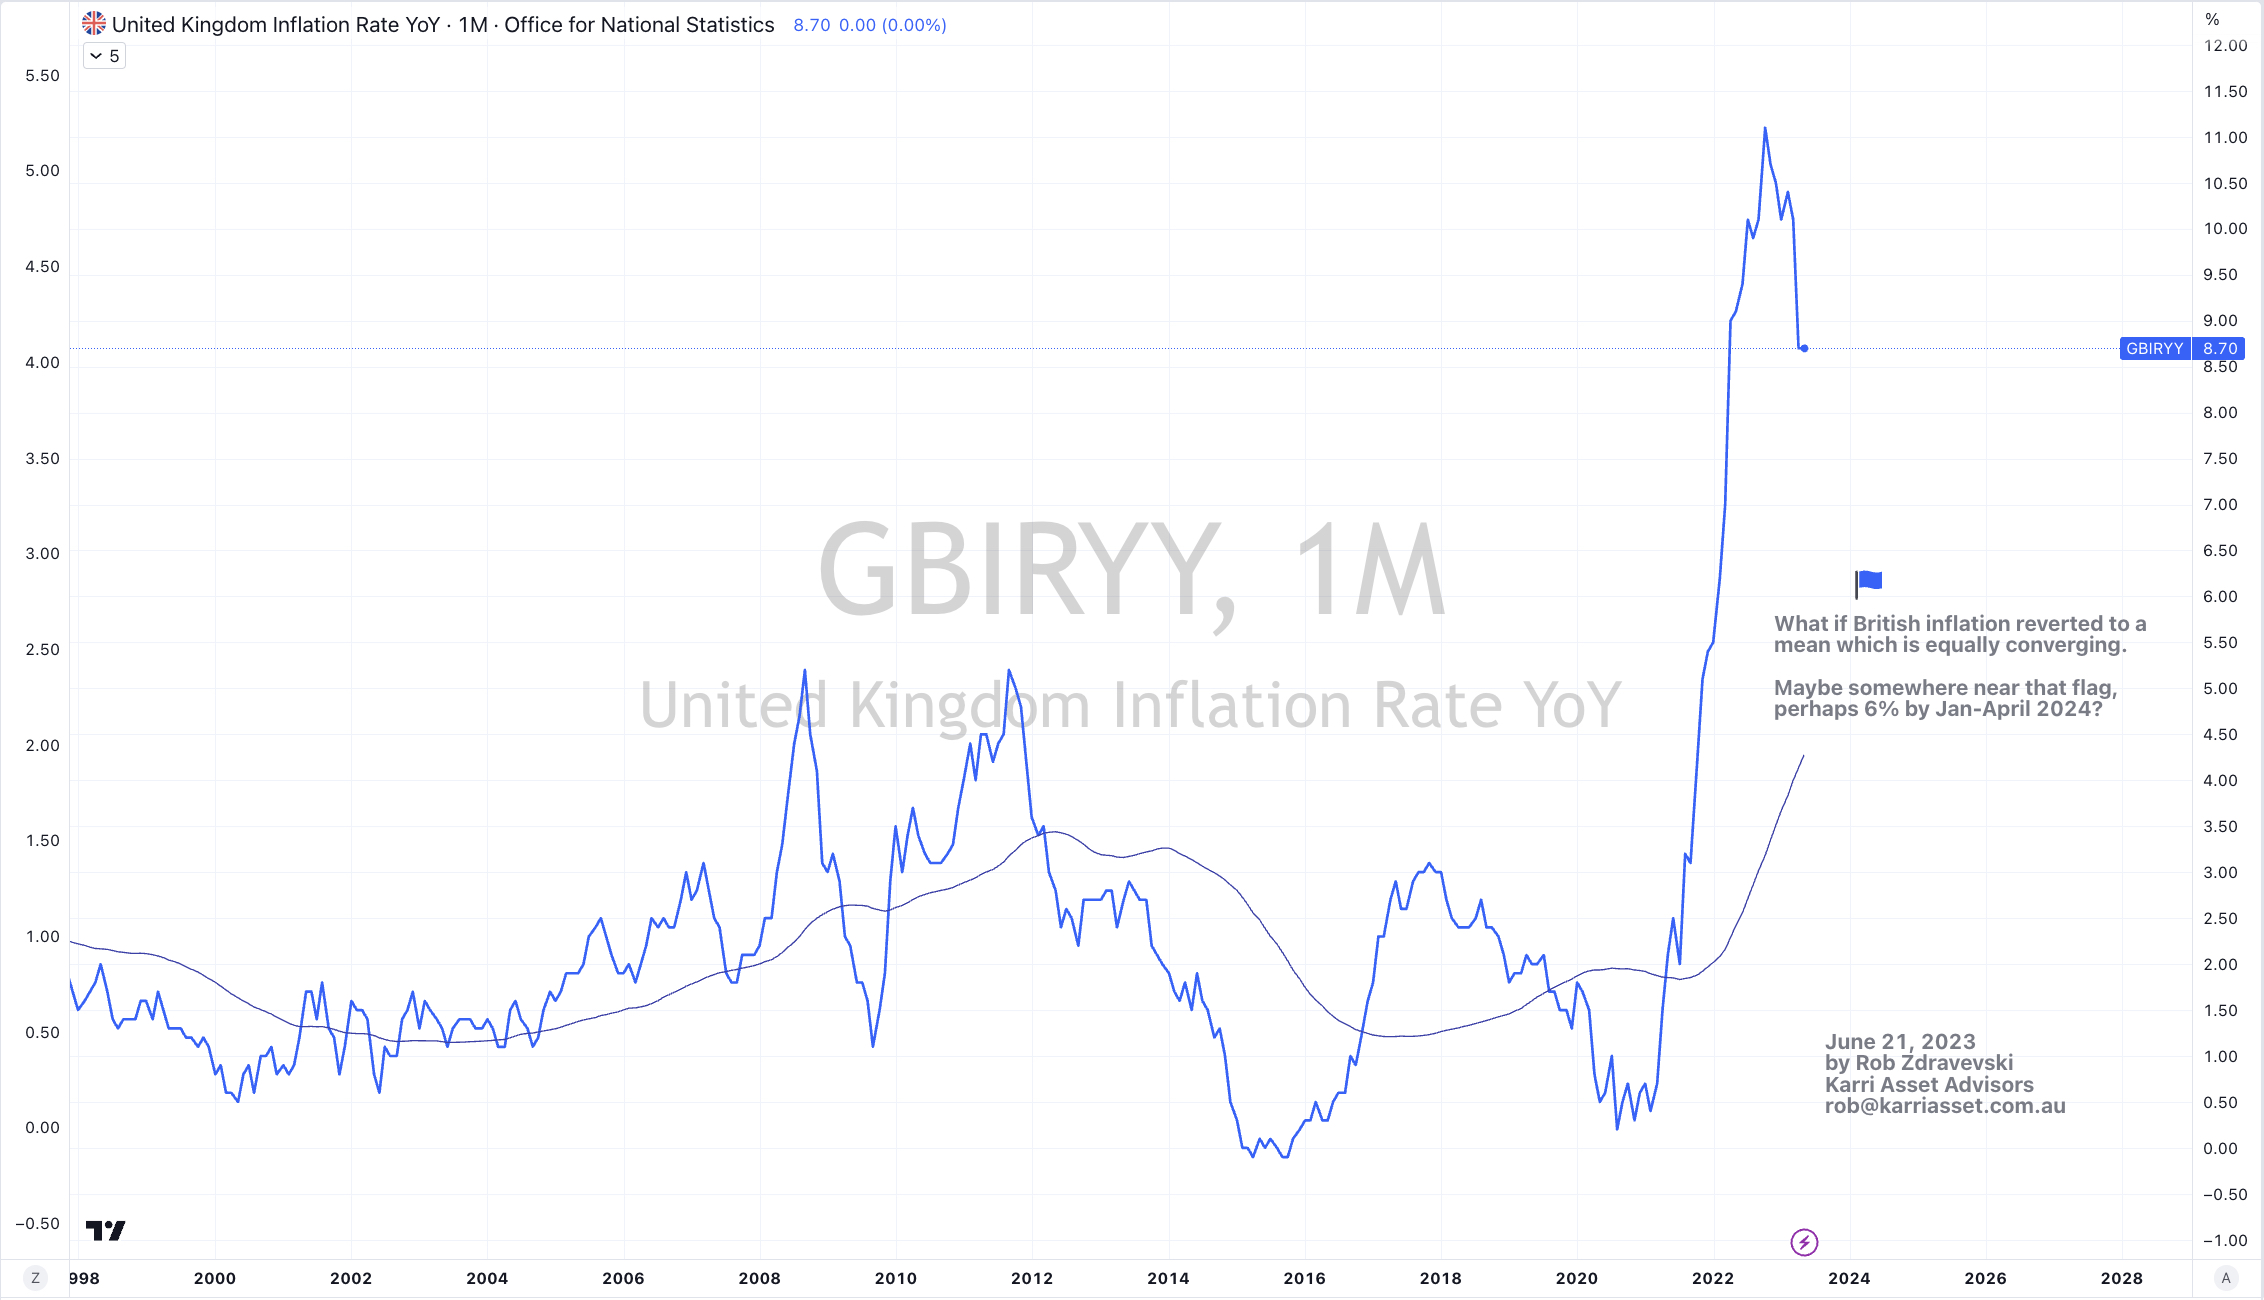
While the U.K. 2’s and 3’s did make ‘recent’ higher highs and have achieved their highest yields since July 21, 2008.

Australian 10 year yield minus U.S. 10 year yield and Australian 2 year government bond yields are no longer overbought

The U.S. 3 month bill yield made a return to overbought territory. 

The U.S. 10 year minus U.S. 5 year yield spread registered its 7th consecutive ‘losing’ week.

The more ‘watched’ US10Y-US02Y is nearing oversold levels.

My obscure yield spread such as the U.S. 10 year bond yield minus Australian 10 year bond yield and the U.S. 10 year bond yield divided by Australian 10 year bond yield aren’t at any standard deviation lows.

The Australian 2 and 3 yer bond yields broke their streaks of 7th consecutive rising weeks with the latter recently seeing its highest yield since August 1st, 2011.

The Japanese 10 year bond yields closed at their lowest in 3 months.

Commodities were mostly weak.

Wheat, Rice, Lumber, Urea and Gas bucked that trend. The latter continue their advance from their recent oversold depths.

Energy contracts broadly erased the past 2 weeks of gains.

Agricultural’s either rose or held up well.

Copper erased last week’s gains. 

Precious Metals continue to perform poorly.

Over the past 2 weeks, WTI Crude Oil has now lost 6%, Orange Juice has eased 11% and Palladium has sunk 17%, while Lumber has risen 10%, Wheat climbed 18% and Natural Gas has soared 21% over the same time.

Palladium and Aluminium are nearing oversold levels and Platinum has fallen 19% over the past 2 months.

Uranium, Cattle and Sugar aren’t overbought anymore. The latter produced a bearish outside reversal week.

And Silver has mean reverted to its 200 week moving average.

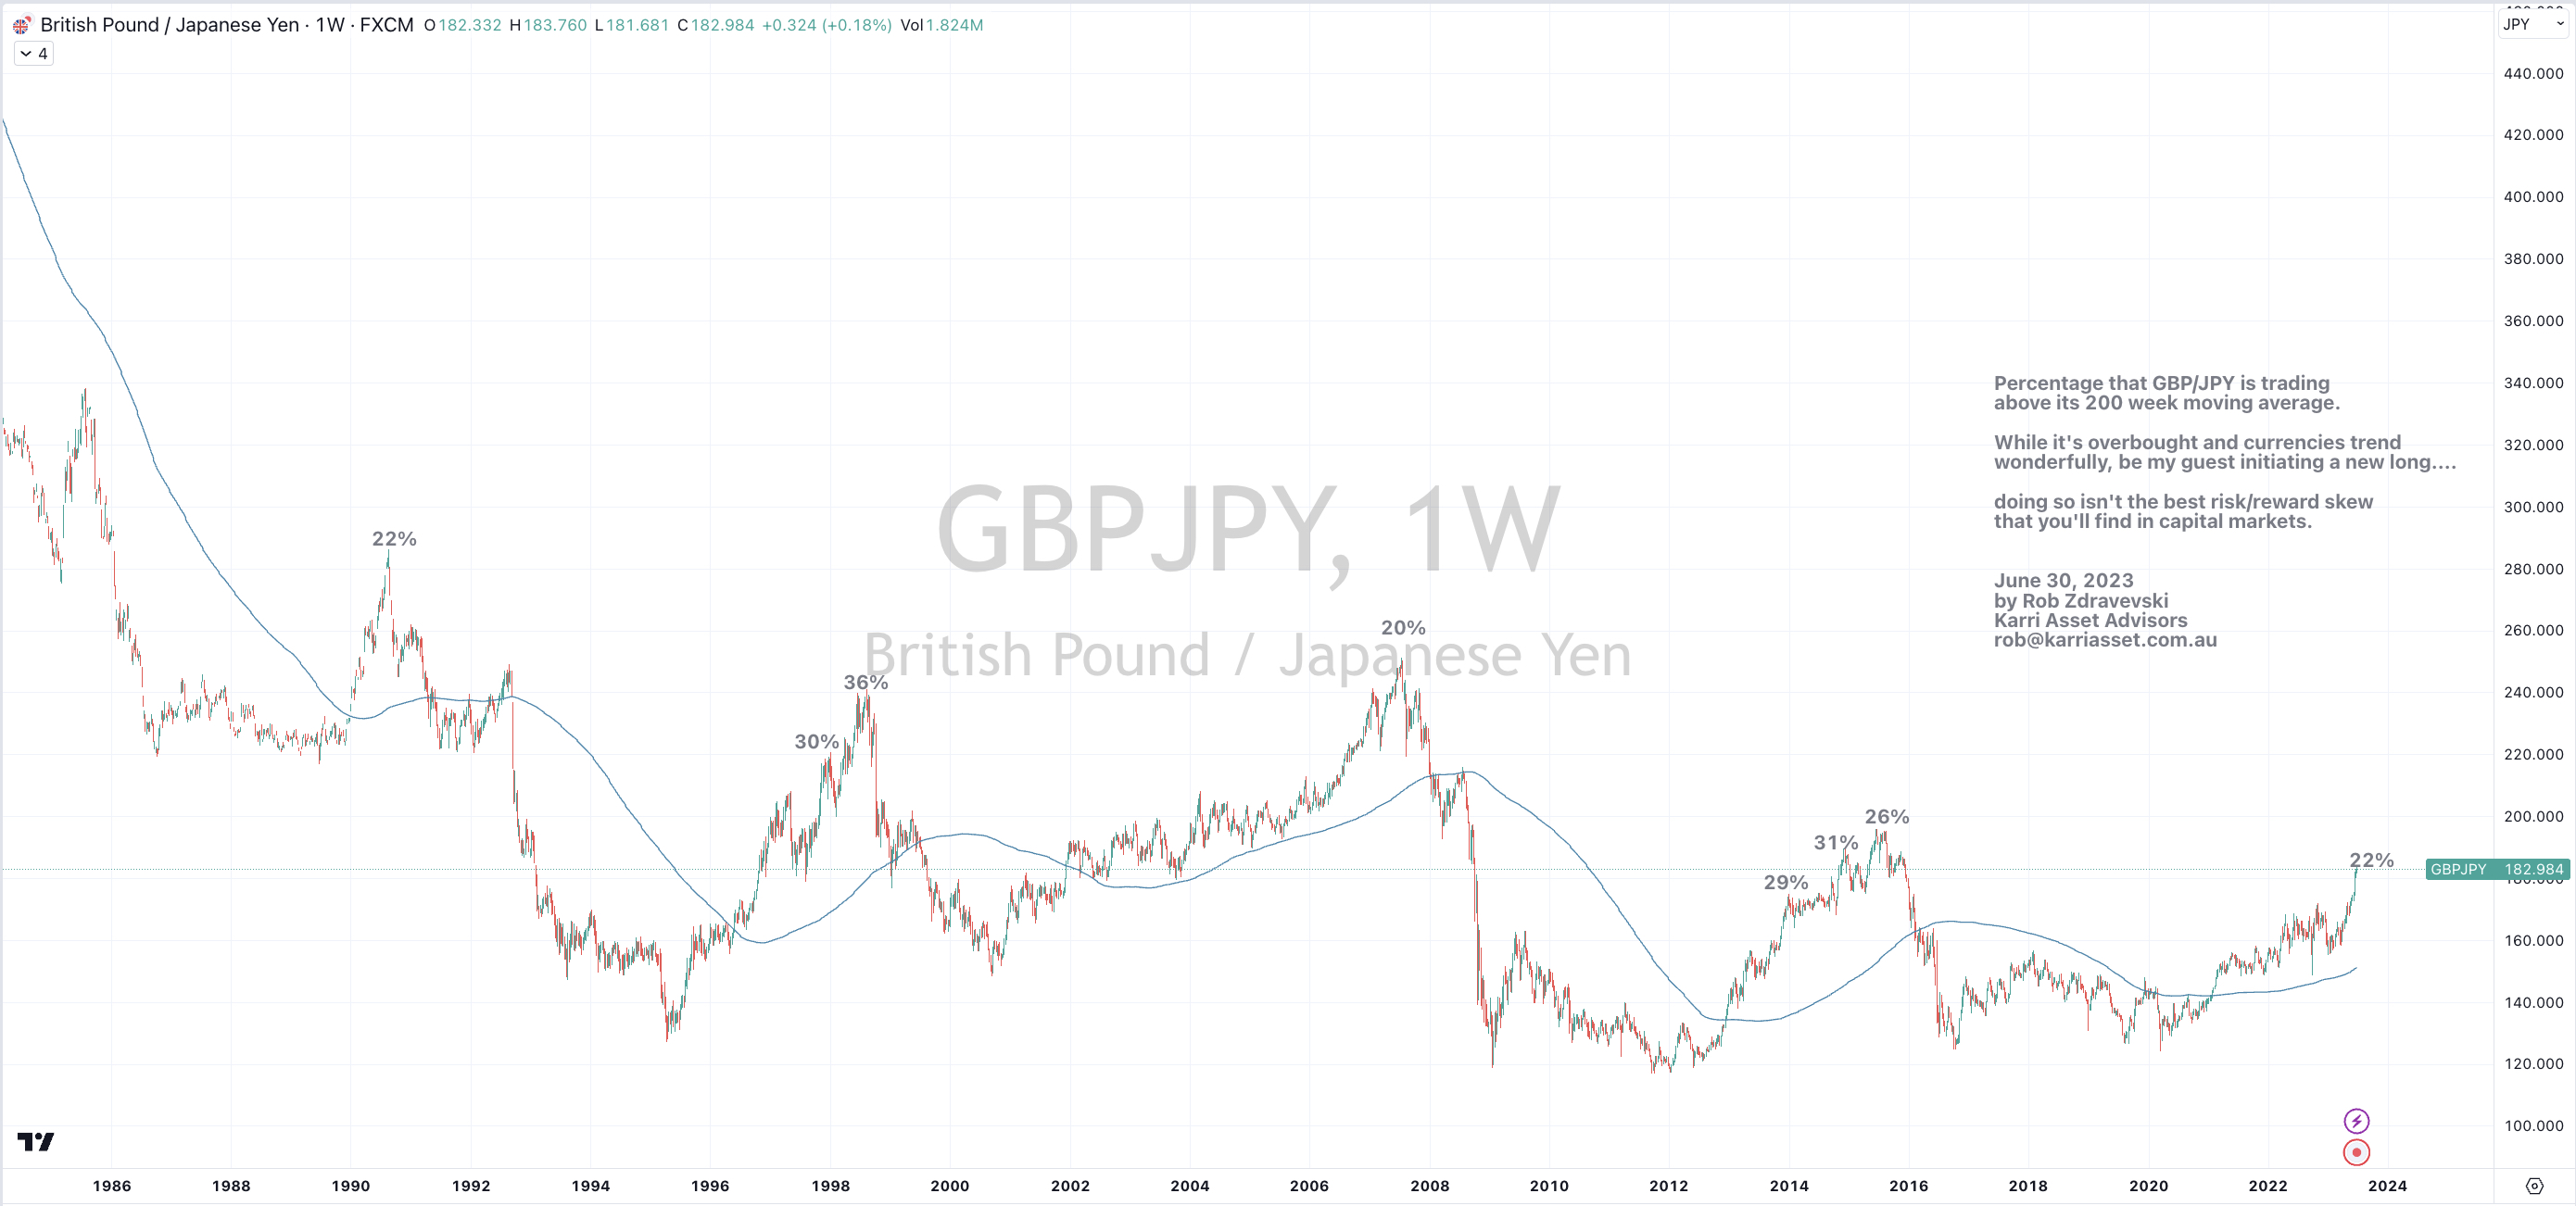
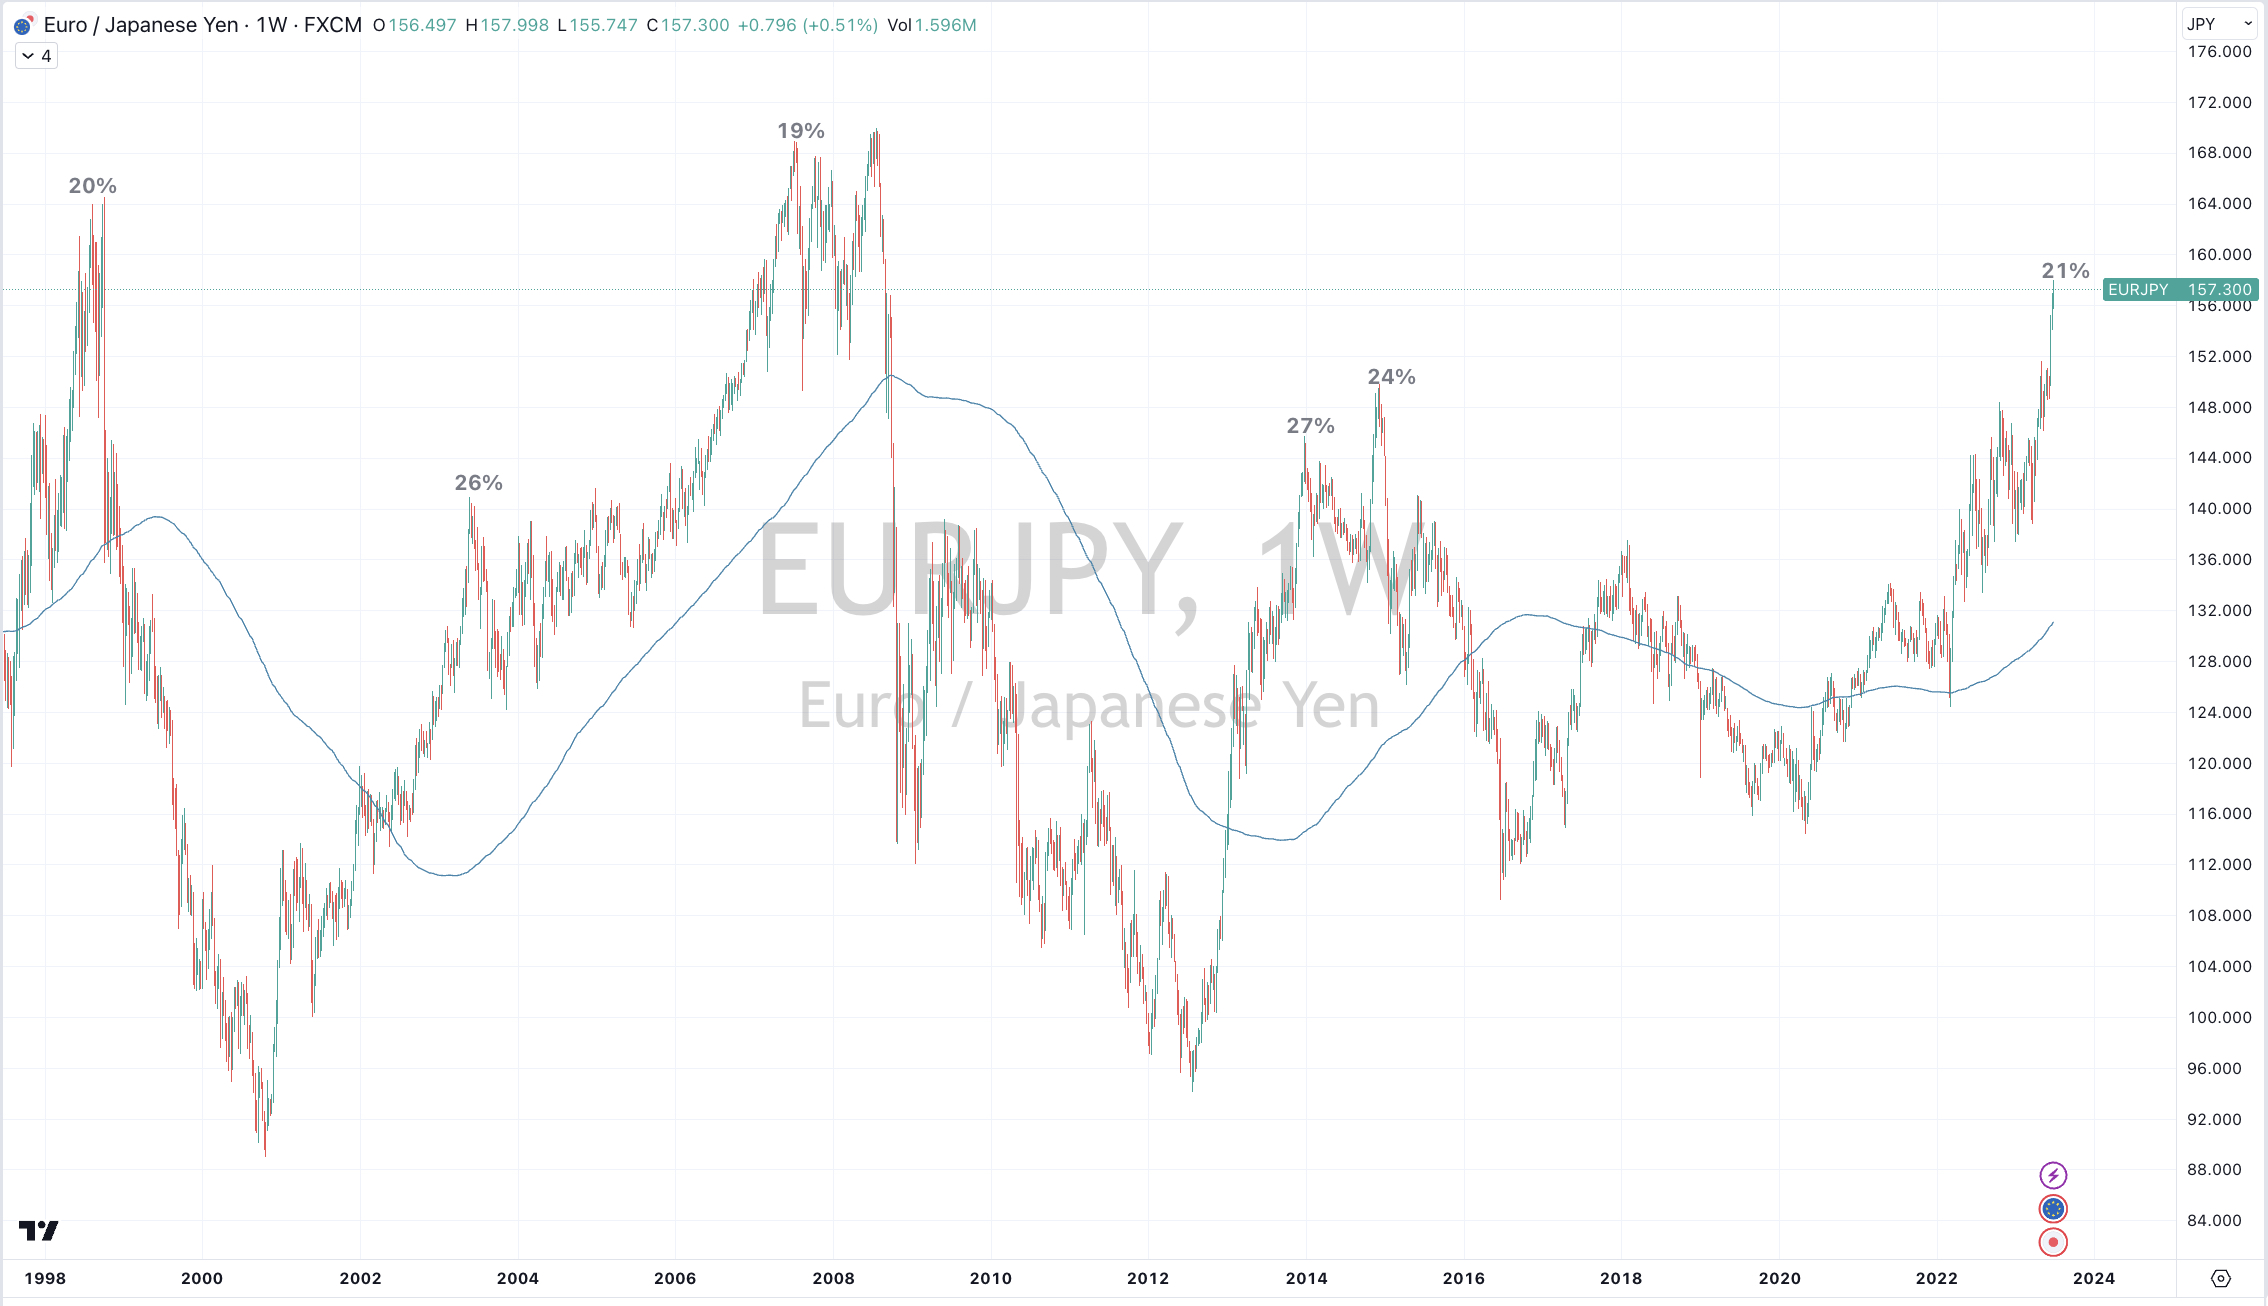
In Currencies, we saw a reverse of last week’s ‘risk on’ form.

The AUD/JPY trading at an extended 2.5 standard deviations portends a peak in ‘risk taking’. Keep watching this currency cross if it make makes a quinella with an overbought RSI reading to possibly gives a more notable peak in ‘risk’.

The AUD gave up all of last week’s 2% gain and more, depending on the currency cross you are looking at. 

The Aussie lost 3% agains the CAD and USD.

The Kiwi/Aussie (NZD/AUD) registered a bullish outside reversal week.

The USD saw its highest close agains the JPY since October 31, 2022. The USD has now risen 10% against the Yen over the past 3 months.

And the USD rose 3% versus the South African Rand (ZAR).

The larger advancers over the past week comprised of;

Baltic Dry Index 15.2%, JKM LNG 5.7%, Lumber 6.6%, Lithium 2.5%, Natural Gas 3.7%, Urea U.S. Gulf 3.3%, Rice 1.6% and Wheat rose 6.4%.

The group of decliners included;

Aluminium (3.7%), Bloomberg Commodity Index (2.7%), Brent Crude (2.5%), China Coking Coal (2.1%), WTI Crude Oil (3.9%), Gasoil (4.7%), Copper (2.2%), Heating Oil (5.7%), Coffee (8.8%), Nickel (5.6%), Orange Juice (2.9%), Palladium (9.7%), Gasoline (6.1%), Sugar (8.5%), Silver (7.3%), S&P GSCI (2.8%), CRB Index (2.9%), Cotton (2%), Dutch TTF Gas (7.1%), Silver in AUD (4.5%), Gold in CAD (2%), Gold in USD (1.9%), Corn (1.5%), Soybeans (2.4%), Shanghai (2.3%), CSI 300 (2.5%), AEX (2.1%), KBW Bank Index (5%), CAC (3.1%), DAX (3.2%), DJ Industrials (1.7%), MIB (2.3%), HSCEI (6.4%), Hang Seng (5.7%), IBEX (2.4%), Nasdaq Composite (1.4%), KOSPI (2.1%), S&P MidCap 400 (2.5%), Nasdaq Biotech (2.1%), Nikkei (2.7%), S&P SmallCap 600 (3.1%), Oslo (4.2%), Copenhagen (3%), Helsinki (6.2%), Stockholm (3.8%), Russell 2000 (3%), SOX (4.5%), STI (2.1%), TSX (2.8%), FTSE 100 (2.4%), ASX 200 (2.1%), ASX SmallCaps (3.5%), Mexico (2.7%), KRE Bank Index (8.1%) and Thailand SET Index (3.5%).

June 25, 2023

by Rob Zdravevski

rob@karriasset.com.au 

British inflation should mean revert

What if British inflation reverted to a mean which is equally converging.

Maybe somewhere near that flag, perhaps 6% by Jan-April 2024?

June 21, 2023
by Rob Zdravevski
rob@karriasset.com.au