Macro Extremes (week ending February 9, 2024)
February 11, 2024 Leave a comment
A weekly Macro, Cross Asset review of prices trading at extremes which may generate future investment ideas and opportunities.
The following assets (on a weekly timeframe) either registered an Overbought or Oversold reading and/or have traded more than 2.5 standard deviations above or below its rolling mean.
Extremes “above” the Mean (at least 2.5 standard deviations
Cotton
Gasoil
NZD/AUD
Overbought (RSI > 70)
Uranium
Rice
Robusta Coffee
AEX
Italy’s MIB
Nikkei 225
Dow Jones Industrial Average
Nasdaq 100
Nasdaq Composite
Nasdaq Transportation Index
Egypt 30 Index
Philadelphia Semiconductor Index (SOX)
And the S&P 500 Index
The Overbought Quinella – Both Overbought and Traded at > 2.5 standard deviations above the weekly mean)
Cocoa
Russia’s MOEX Index
Turkiye’s BIST 100 Index
Extremes “below” the Mean (at least 2.5 standard deviations)
Shanghai Composite
Oslo’s OBX Index
Oversold (RSI < 30)
Chile 2 year government bond yield
JKM LNG
Lithium Hydroxide
Nickel on India’s MCX Exchange
Corn
Soybean
The Oversold Quinella – Both Oversold and Traded at < 2.5 standard deviations below the weekly mean)
China 10 year government bond yield
Notes & Ideas:
Government bond yields were higher for week.
Many of them are on the move higher back towards the middle of their recent ranges.
German 10’s closed at their highest weekly close since November 30, 2023.
Equities were stronger, however there were some losers too.
The Dow Jones Industrial Average has put together a 5 week winning streak and has spent the past 9 weeks in overbought territory.
The S&P 500 is also in a 5 week winning streak and has risen for 14 of its past 15 weeks.
Amsterdam’s AEX made a new all-time high.
The Nasdaq Composite are yet to reach a new all-time high but it did close at its highest weekly close while stretching a 5 week winning streak.
The Nasdaq Transportation Index made an all-time high and weekly close. It has risen 10% in the past 4 weeks.
The Russell 2000 and the S&P MidCap 400 both performed a bullish outside reversal week.
And Turkiye’s BIST has risen for 5 consecutive weeks making for a 19% (in TRY terms) return.
Commodities were generally stronger with the notable advancers and decliners listed below.
The big news was that Lithium Hydroxide prices were unchanged for the week.
Does being ‘unchanged” qualify to end its 13 week consecutive losing streak?
Lean Hogs aren’t overbought but Cotton and Gasoil (Diesel) is.
Cattle is in a 6 week winning streak and has closed higher in 8 of the past 9 weeks. Furthermore, Cattle is trading at extended percentages (41%) above its 200 week moving average.
Heating Oil continues its roller coaster. This week it rose 10%, last week it fell 6% and the week before that saw it rise 7%. Mamma Mia !
Sugar is in a 6 week winning streak.
Soybeans and Corn are registering oversold extremes.
Soybeans are in a 8 week losing streak and have fallen 12 of the past 13 weeks.
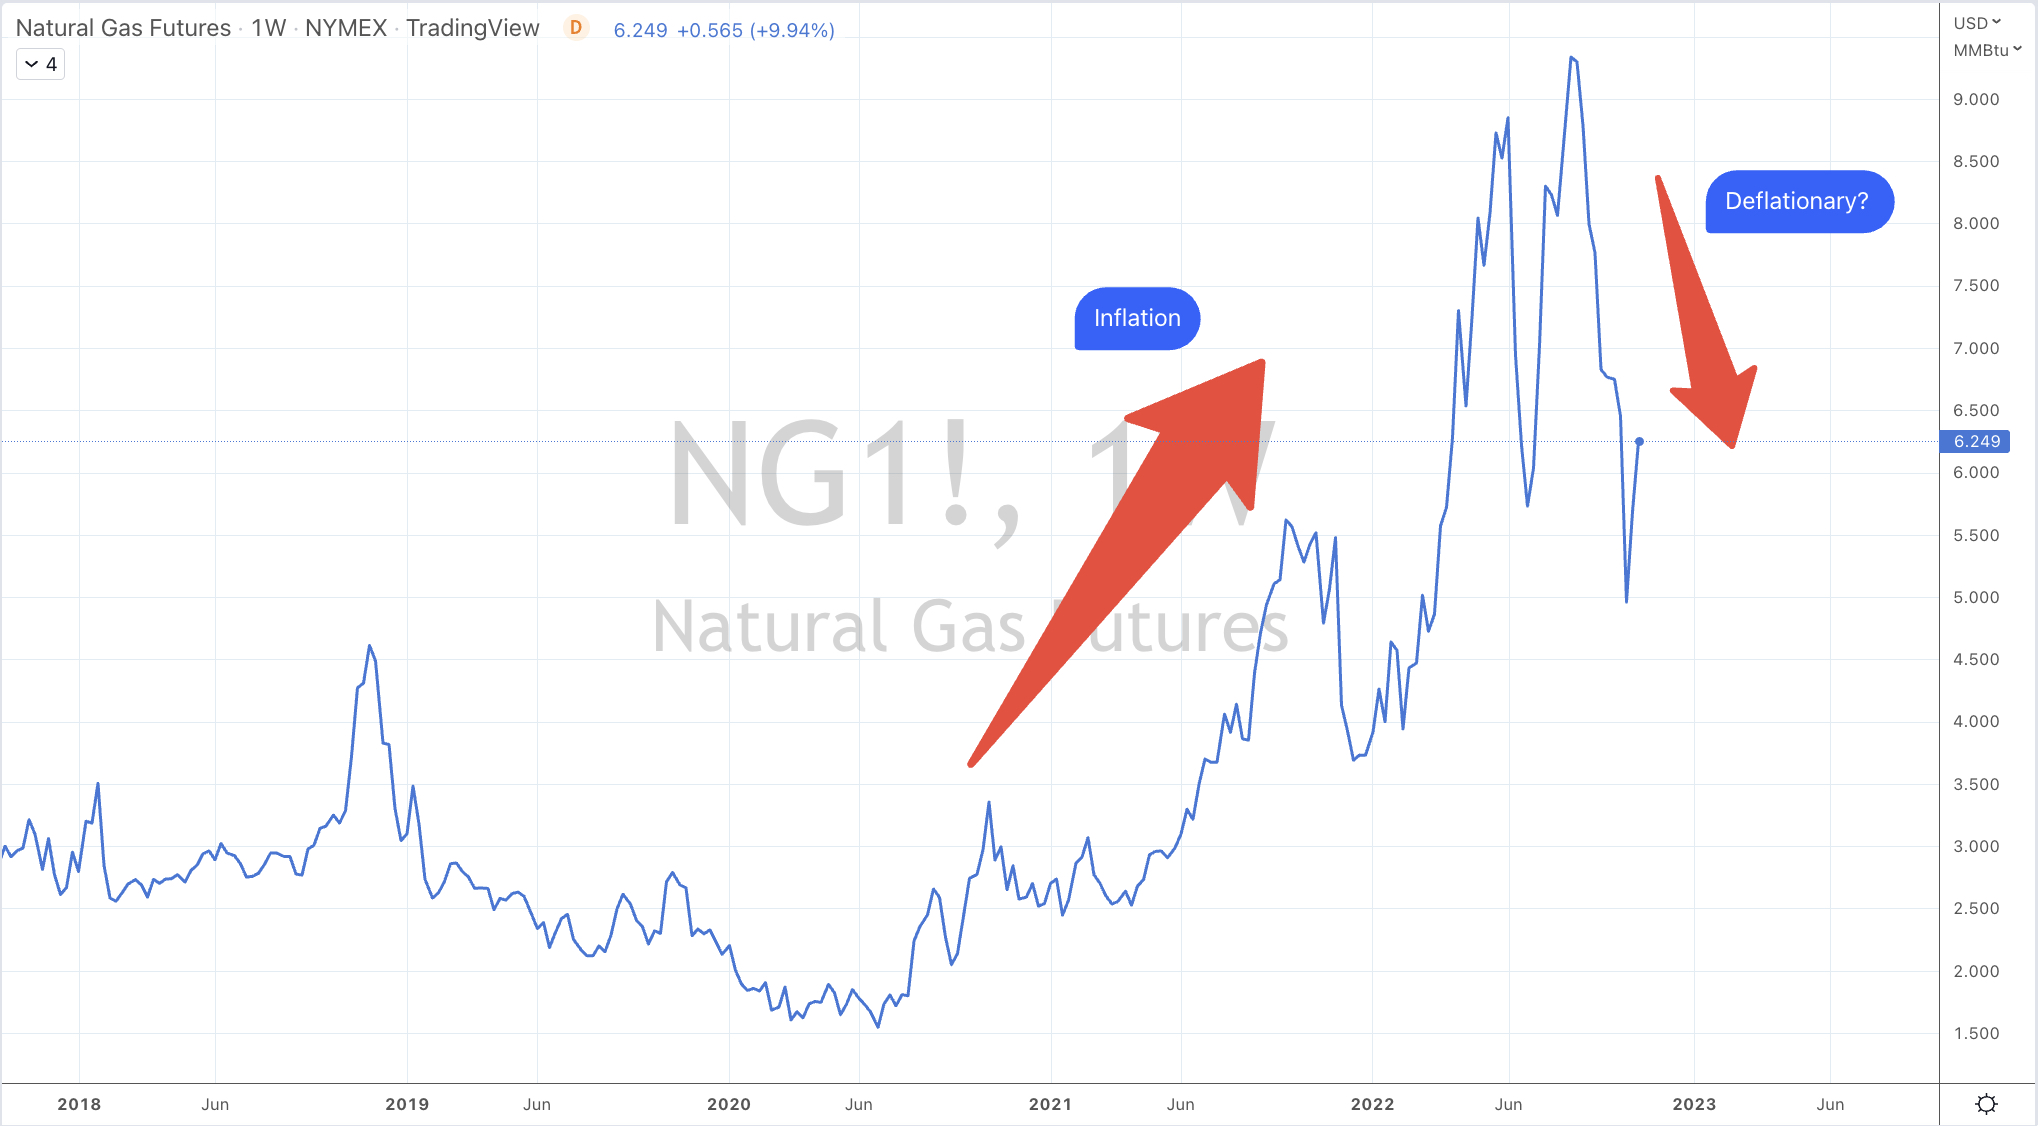
It’s worth to note that Henry Hub Natural Gas prices are a whisker away from making new all-time lows while JKM LNG are trading at their lowest close since December 20, 2020.
And Lithium Hydroxide has now spent 32 consecutive weeks in weekly oversold territory.
Amongst currencies, the collective U.S. Dollar (DXY) Index is in a 4 week winning streak.
While against specific pairs, the U.S. Dollar has risen for the past 5 or 6 weeks.
The AUD has slight gains, thus putting an end to its consecutive losing streaks against many pairs such as the 6 week losing streak for the AUD/SGD.
The Yen was weaker.
And the GBP/USD is in a 4 week losing streak.
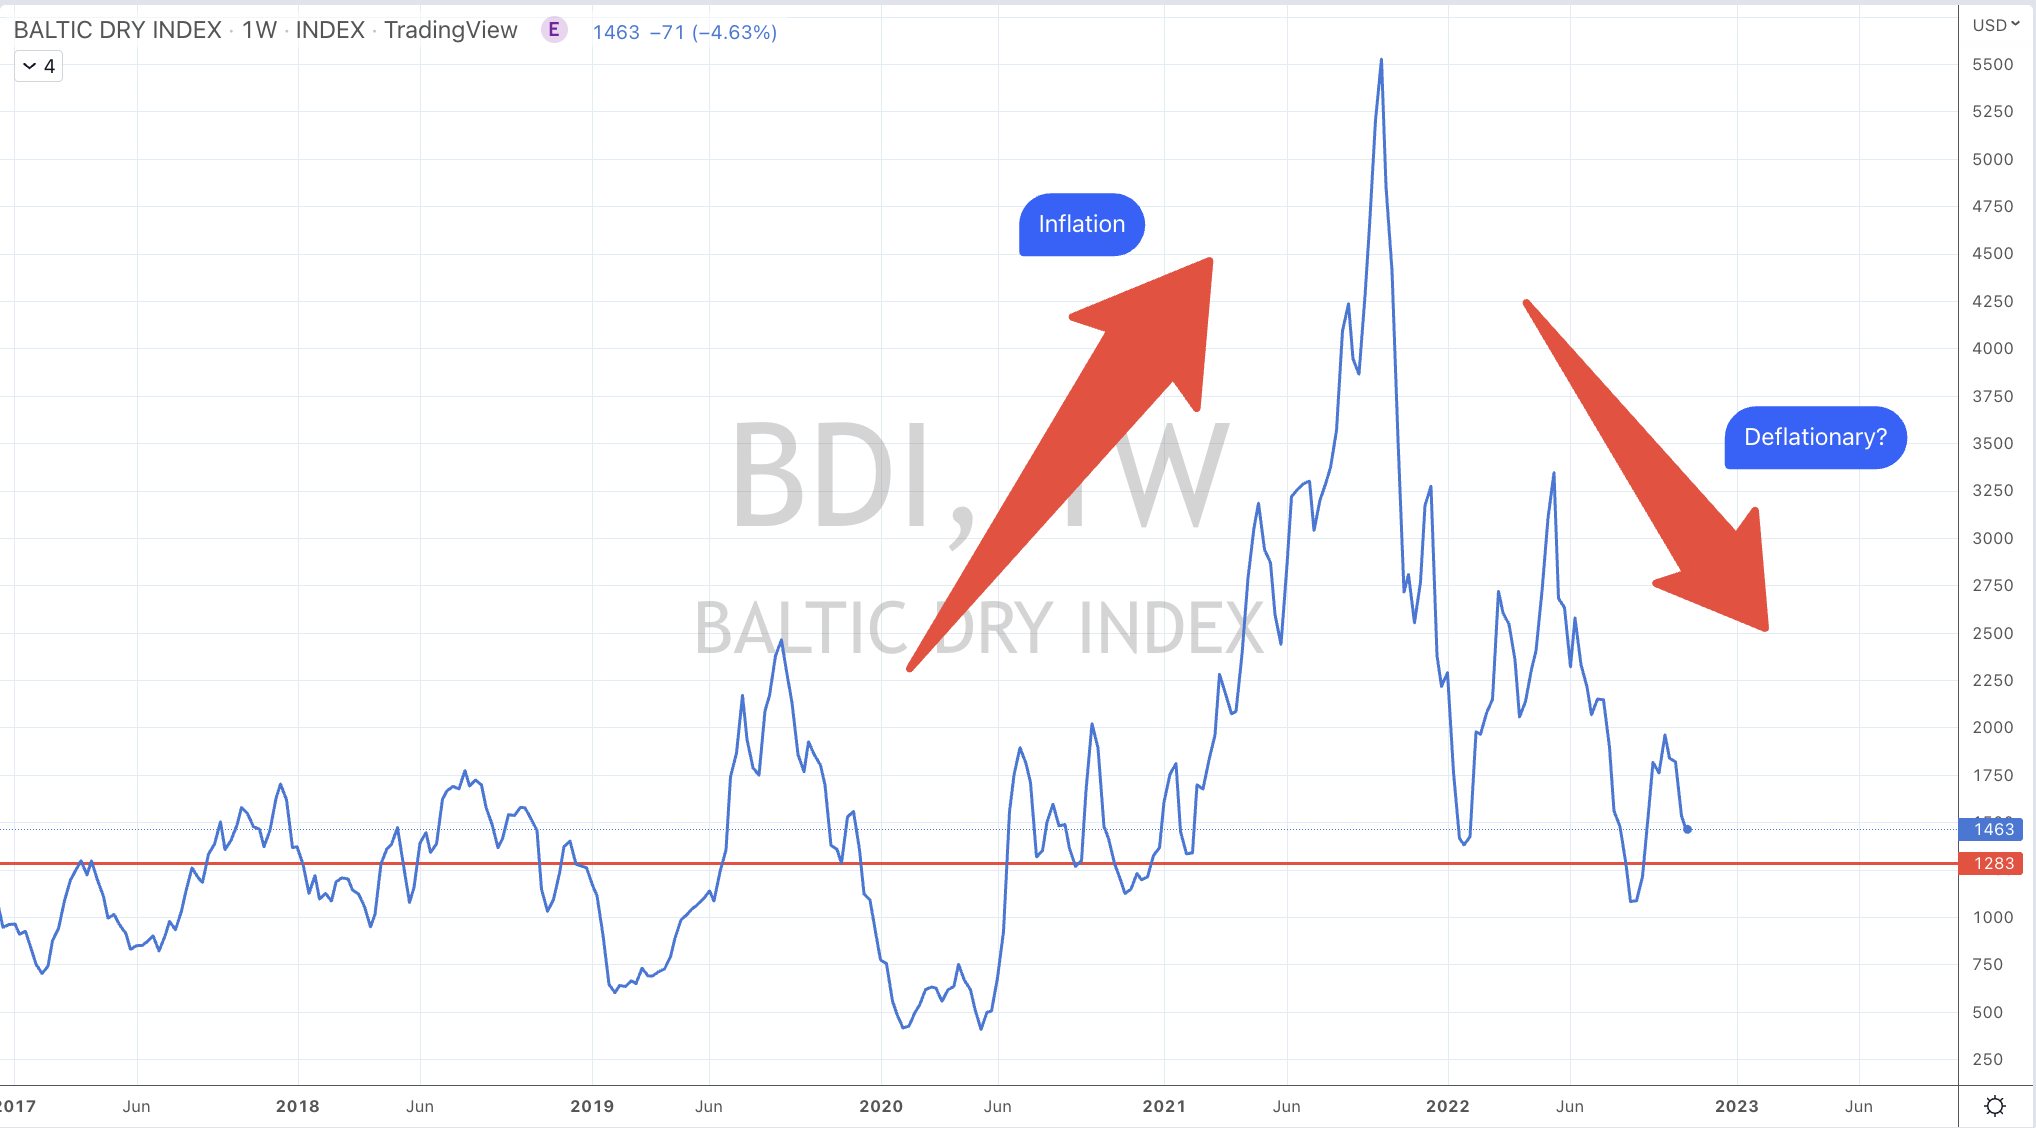
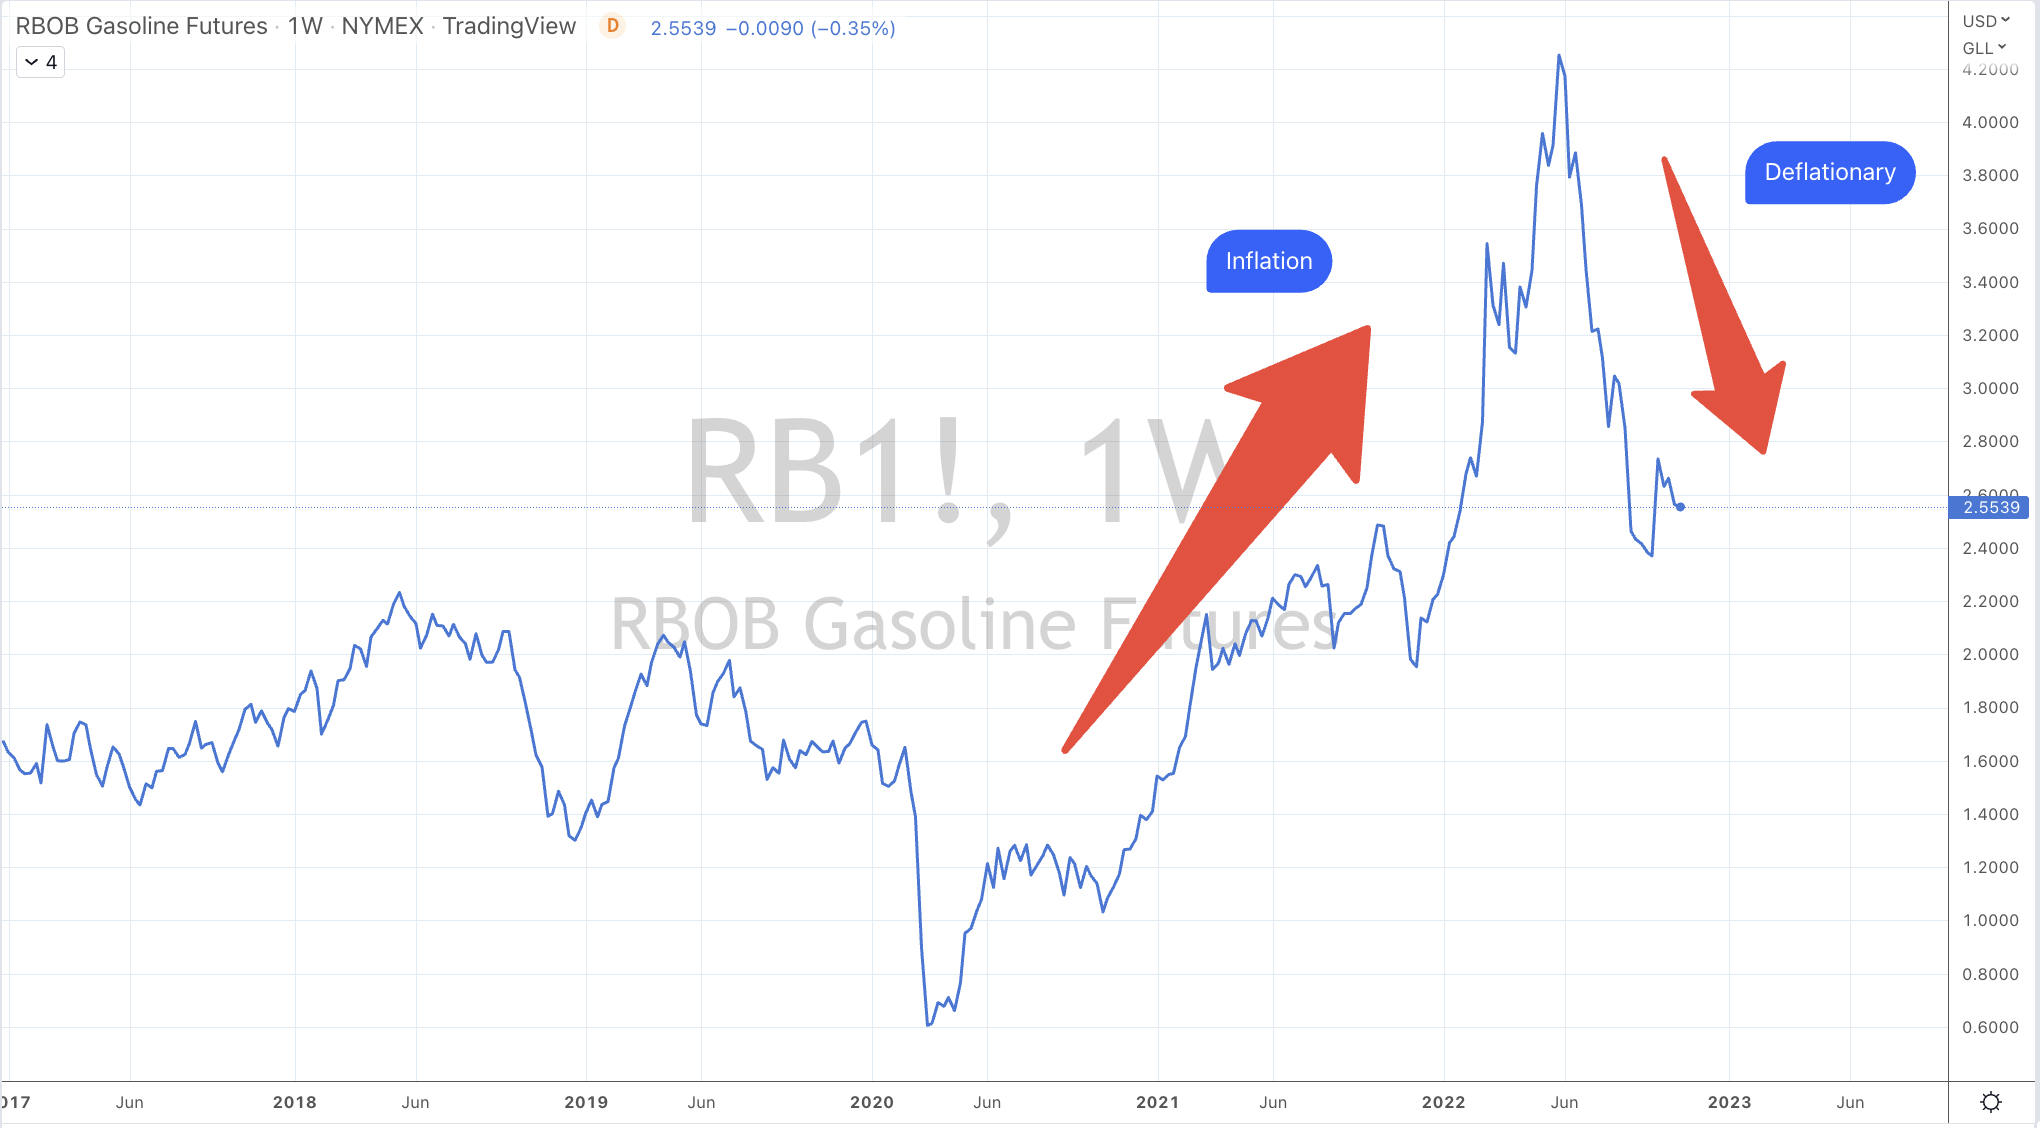
The larger advancers over the past week comprised of;
Baltic Dry Index 9.8%, Cocoa 11.8%, WTI Crude Oil 5.8%, Cotton 5.4%, Heating Oil 10.3%, Cattle 2.3%, Newcastle Coal 4.8%, Gasoline 8.9%, S&P GSCI 3.5%, CRB Index 2.5%, Brent Crude Oil 5.8%, Gasoil 12.9%, Rice 2.6%, Robusta Coffee 3.2%, Shanghai Composite 5%, CSI 300 5.8%, AEX 3.6%, China A50 5.3%, DJ Transports 2.6%, HSCEI 1.7%, Russell 2000 2.5%, Nasdaq Composite 2.3%, S&P MidCap 400 1.6%, Nasdaq 100 1.8%, Nikkei 225 2%, Copenhagen 1.6%, SOX 5.3%, Nasdaq Transports 2.8%, BIST 4.4% and the S&P 500 rose 1.4%
The group of largest decliners from the week included;
Rotterdam Coal (2.8%), Lean Hogs (2.2%), Copper (3.5%), Hot Rolled Coil Steel (2.9%), Natural Gas (11.2%), Nickel (2.1%), Orange Juice (2.1%), Palladium (8.4%), Platinum (2.6%), Dutch TTF Gas (7.5%), Uranium (4.1%), Corn (3.1%), Austria (2.4%), IBEX (1.7%), Oslo (2.5%), Helsinki (2%), SMI (1.3%), ASX Materials (3%) and the ASX 200 Index fell 0.7%.
February 11, 2024
by Rob Zdravevski
rob@karriasset.com.au