My subjective observation of recent pessimism along with my empirical analysis lead to my weekend publication, “Macro Extremes” listing these indices in the ‘extreme oversold’ category in the few weeks prior to this ‘reported’ news.
While this rebound is encouraging, it should be treated as a ‘trade’ for now. This means I expect a small pullback. Some ‘sideways’ travel and consolidation would also be constructive for China’s equity indices.
A couple weeks ago, I highlighted 7 moments (in a private note) when the CSI 300 provided an entry point which pointed to reasonably probability of a trading bounce.
Today’s situation is also labelled as one of those.
The currency markets are currently telling me that the mood is “risk-off” which opposes (and somewhat belligerent) the mood of ‘glamour’ equity indices barrelling higher.
The Aussie Dollar is aimless with a bias towards lower prices.
Specifically against the USD, I see it visiting the 0.6350 region and ultimately holding 0.6150 (+/- 30 pips).
There is similar pattern recognition in the #AUD/JPY and the AUD/CHF.
When the circles represent an overbought condition for CHF/AUD on a Monthly basis, the rectangles on the main chart indicate an opportune moments for accumulating equities.
In this scenario, the S&P 500 is represented by the orange line.
This study may be useful in conjunction with your other analyses.
Whenever bond prices exhibit medium to longer term overbought tendencies, it points to a reasonable moment when to increase your allocation to equities.
Now, is not that moment.
Other times, in between these moments, might be considered as ‘trading through the cycle’.
This month, the ASX 200 has touched a “rare” Monthly (not weekly, but monthly) Overbought reading.
For the lack of a better word, I’m calling it rare as the chart below covers 35 years and this level has only been (generally) visited 5 times prior.
Such a moment is worth noting but it’s not an absolute ‘sell’ signal.
My work suggests a greater probability for higher prices or a ‘melt-up’ before we see a peak.
For now the upward trend remains intact and I’ll look for the index to touch 2.5 standard deviations (the upper end of the bands illustrated) above its mean before searching for exhaustion of the current bull market.
Keep in mind that prices can stay ‘overbought’ longer than expected and the constituents (and their weightings) have changed over the course of this charts history.
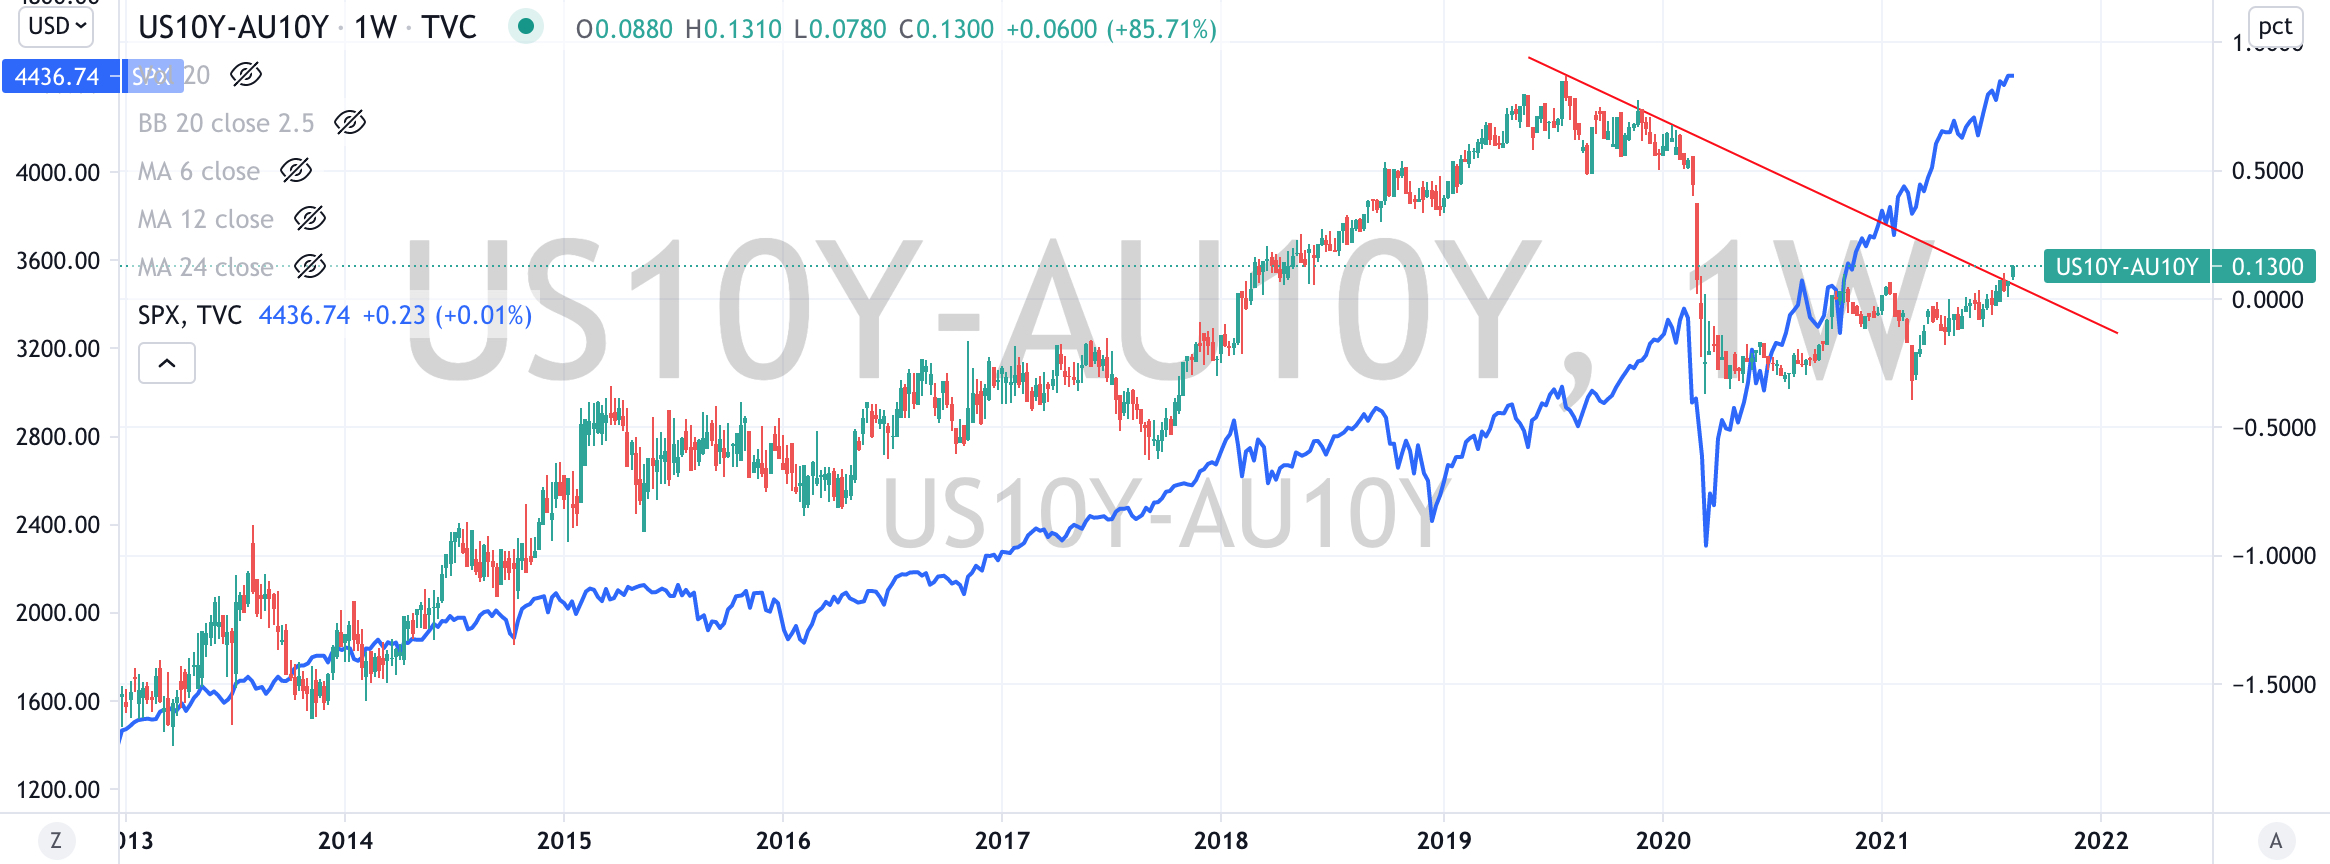
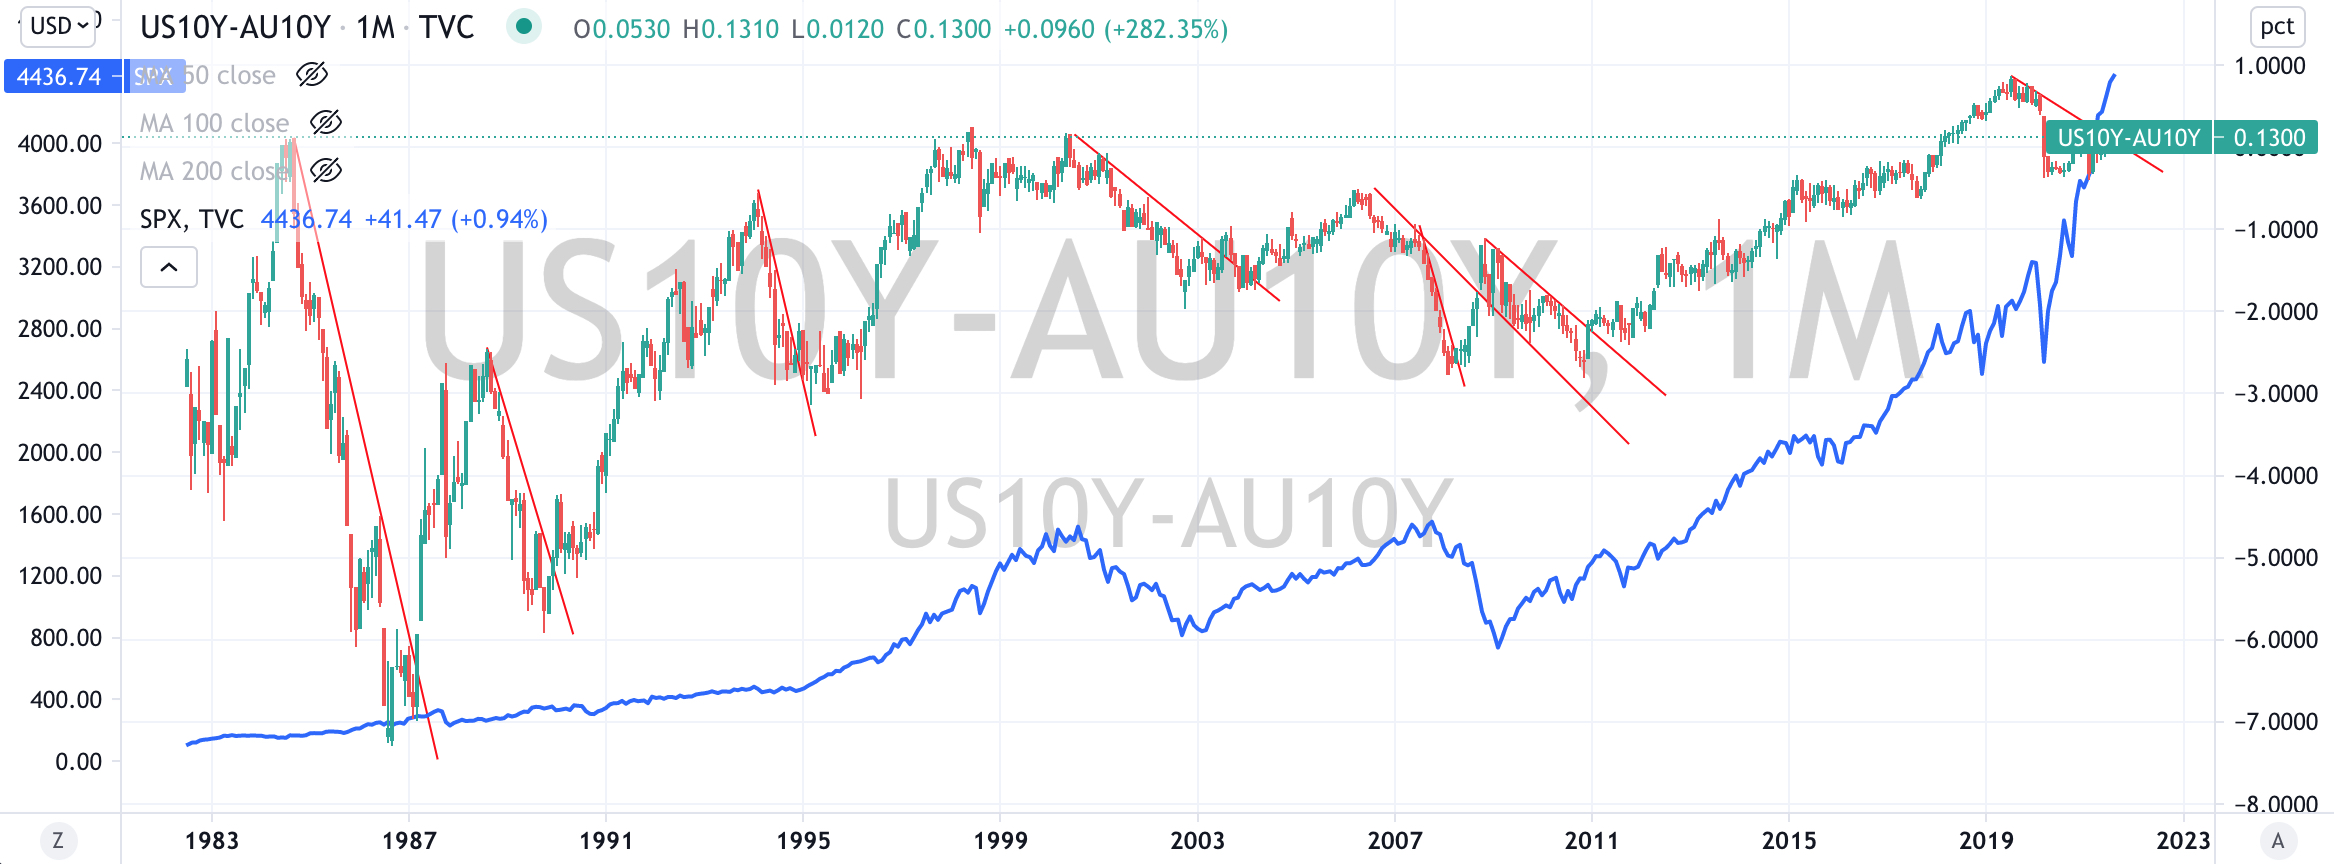
The US 10’s are yielding 1.33% and the Aussie 10’s are 1.20%.
That spread (difference) between the US 10 Government Bond Yield and the Australian 10 Year equivalent is currently 0.13%.
But the figure doesn’t really matter, it’s the direction of the trend which is of greater importance.
As we see today………a rising trend (and when coupled with a break above a trend line) portends greener pastures for equity prices.
Below you will find a ‘close-up’ of a Weekly chart, highlighting the current ‘break-out’, while the 40 year chart (on a Monthly basis) illustrates a rising trend (of the spread) equating to an advancing S&P 500 (SPX), while a decline trend results in a lower or sideways travel.
A rising trend in this interest rate differential tend to also equate to a stronger US Dollar, which in turn means a weaker AUD.
Which…..also correlates to weaker commodity prices.
This is an indicator worth watching for your macro and longer term positioning.
Who would think we’d see a stronger US Dollar?
Rising yields on U.S. Treasuries will prolong the advance in the Dollar.
And rising interest rates add to debt servicing stress which can lead to Sovereign Debt pressure (there is no use calling it a crisis, until it becomes one) at which point the U.S. Dollar remains the currency of ‘last resort’.
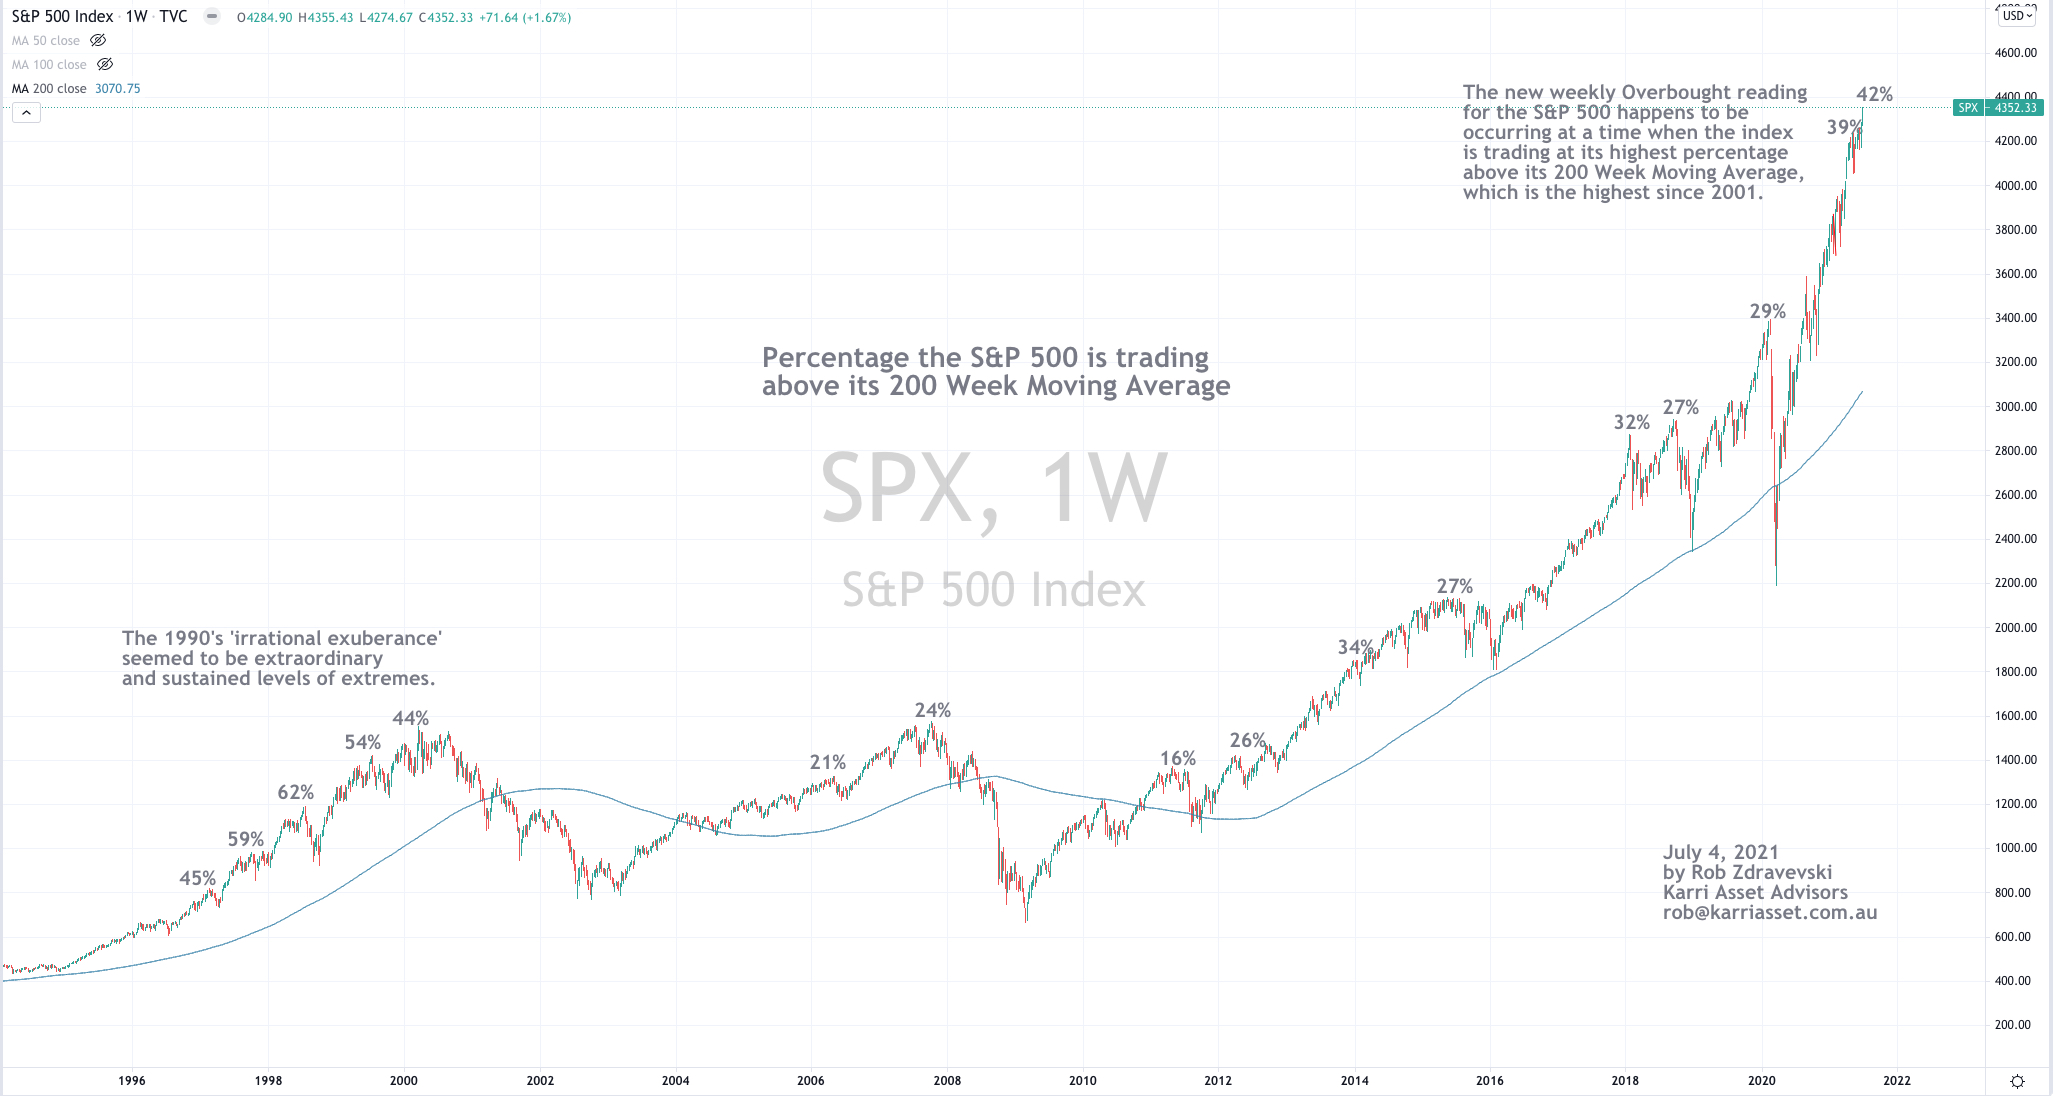
The S&P 500 is trudging higher and has registered a new Weekly Overbought reading.
This Overbought moment is also occurring with some coincidence of it also trading at its highest percentage above the 200 Week Moving Average (WMA).
This is long-term stuff.
These levels were last seen in 2007 and 2001.
It seems logical for the S&P 500 to mean revert over the coming 2 years but keep in mind the mean will continue to roll higher, perhaps to 3,500 in mid-2022.
So, if the S&P 500 ‘rolls over’ and meanders from current levels back to the 200 WMA, it’ll result in a 20% decline and only mean we are back to the same levels seen in November 2020 (for context, that’s 8 months ago)
This is why I think index based/ETF type (overly diversified) investing will provide poor results over the coming 2 years and the ‘age of the stock picker’ is already upon us.
Although (and perhaps confusingly), if you reference this link, the broader market also has every reason to carry on higher, much like the late 1990’s and perhaps more so when coupled with today’s liquidity and with a risk-free rate (the 10 year bond yield) which is now averaging ~ 1.8% as opposed to the 5.5% in the late 1990’s…..all, until the 10 year minus 2 year yield spread moves above 2%.