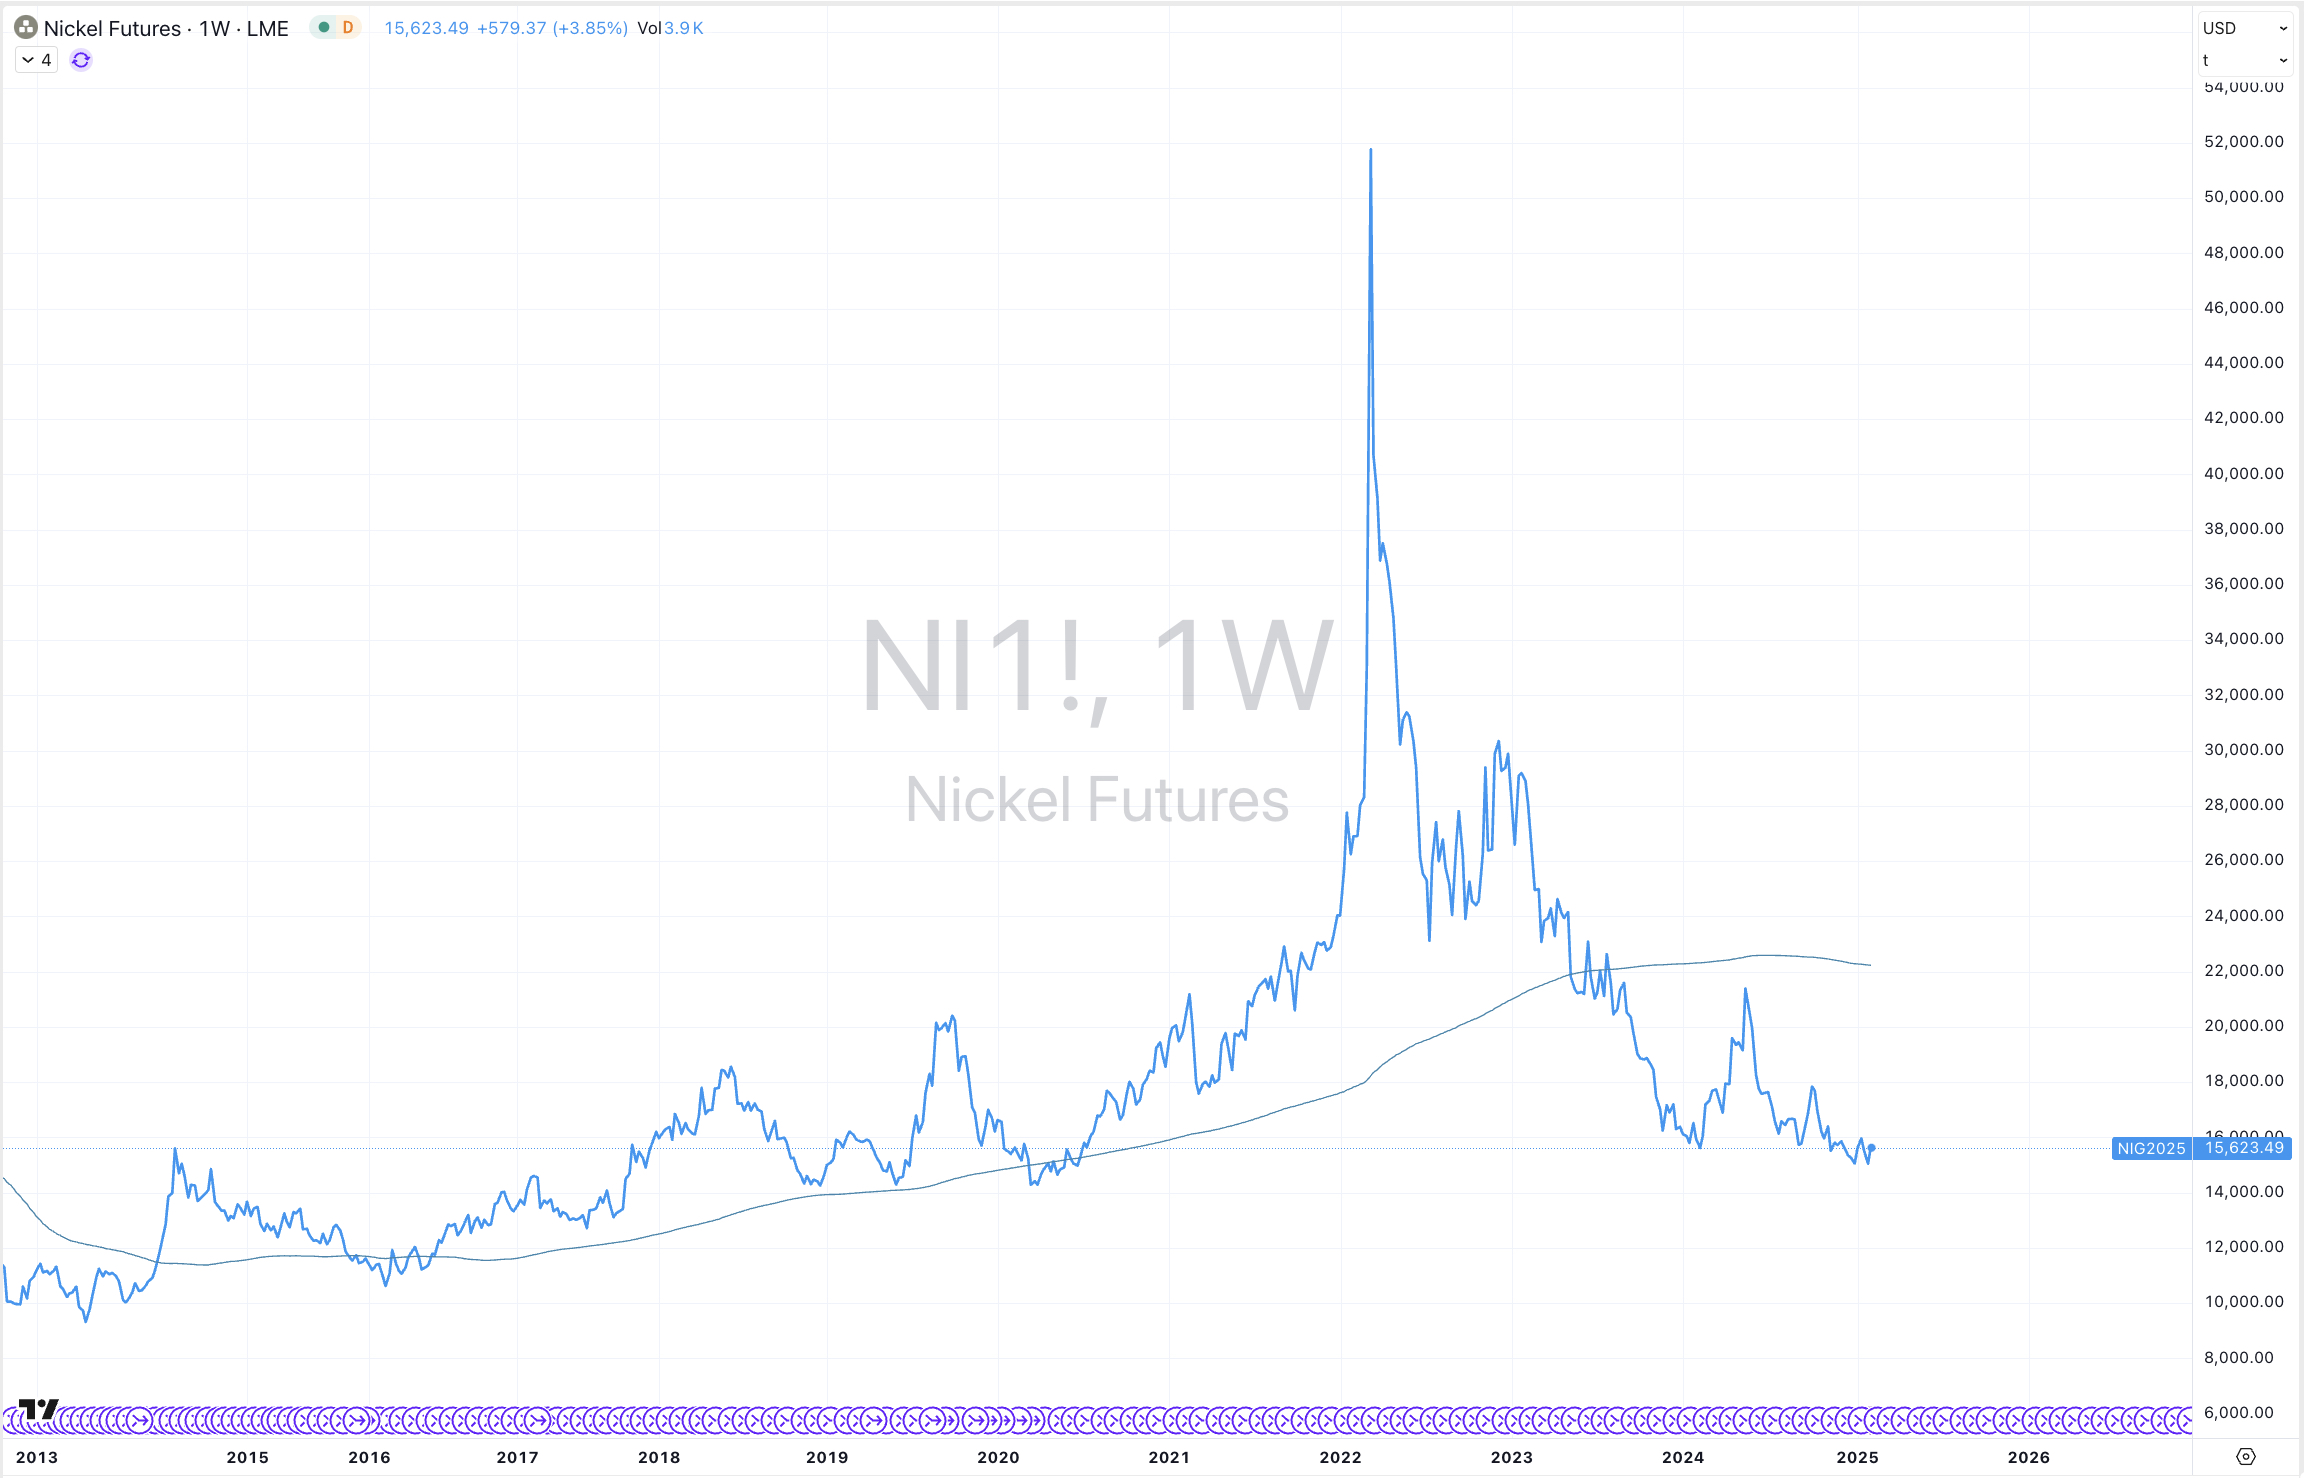
While much damage has been done to the Nickel price, I think there is a little a more lower travel ahead before dearth of supply meets an apathy of interest.
At the time of writing the price of LME (forward month) Nickel futures are trading at US$15,623.
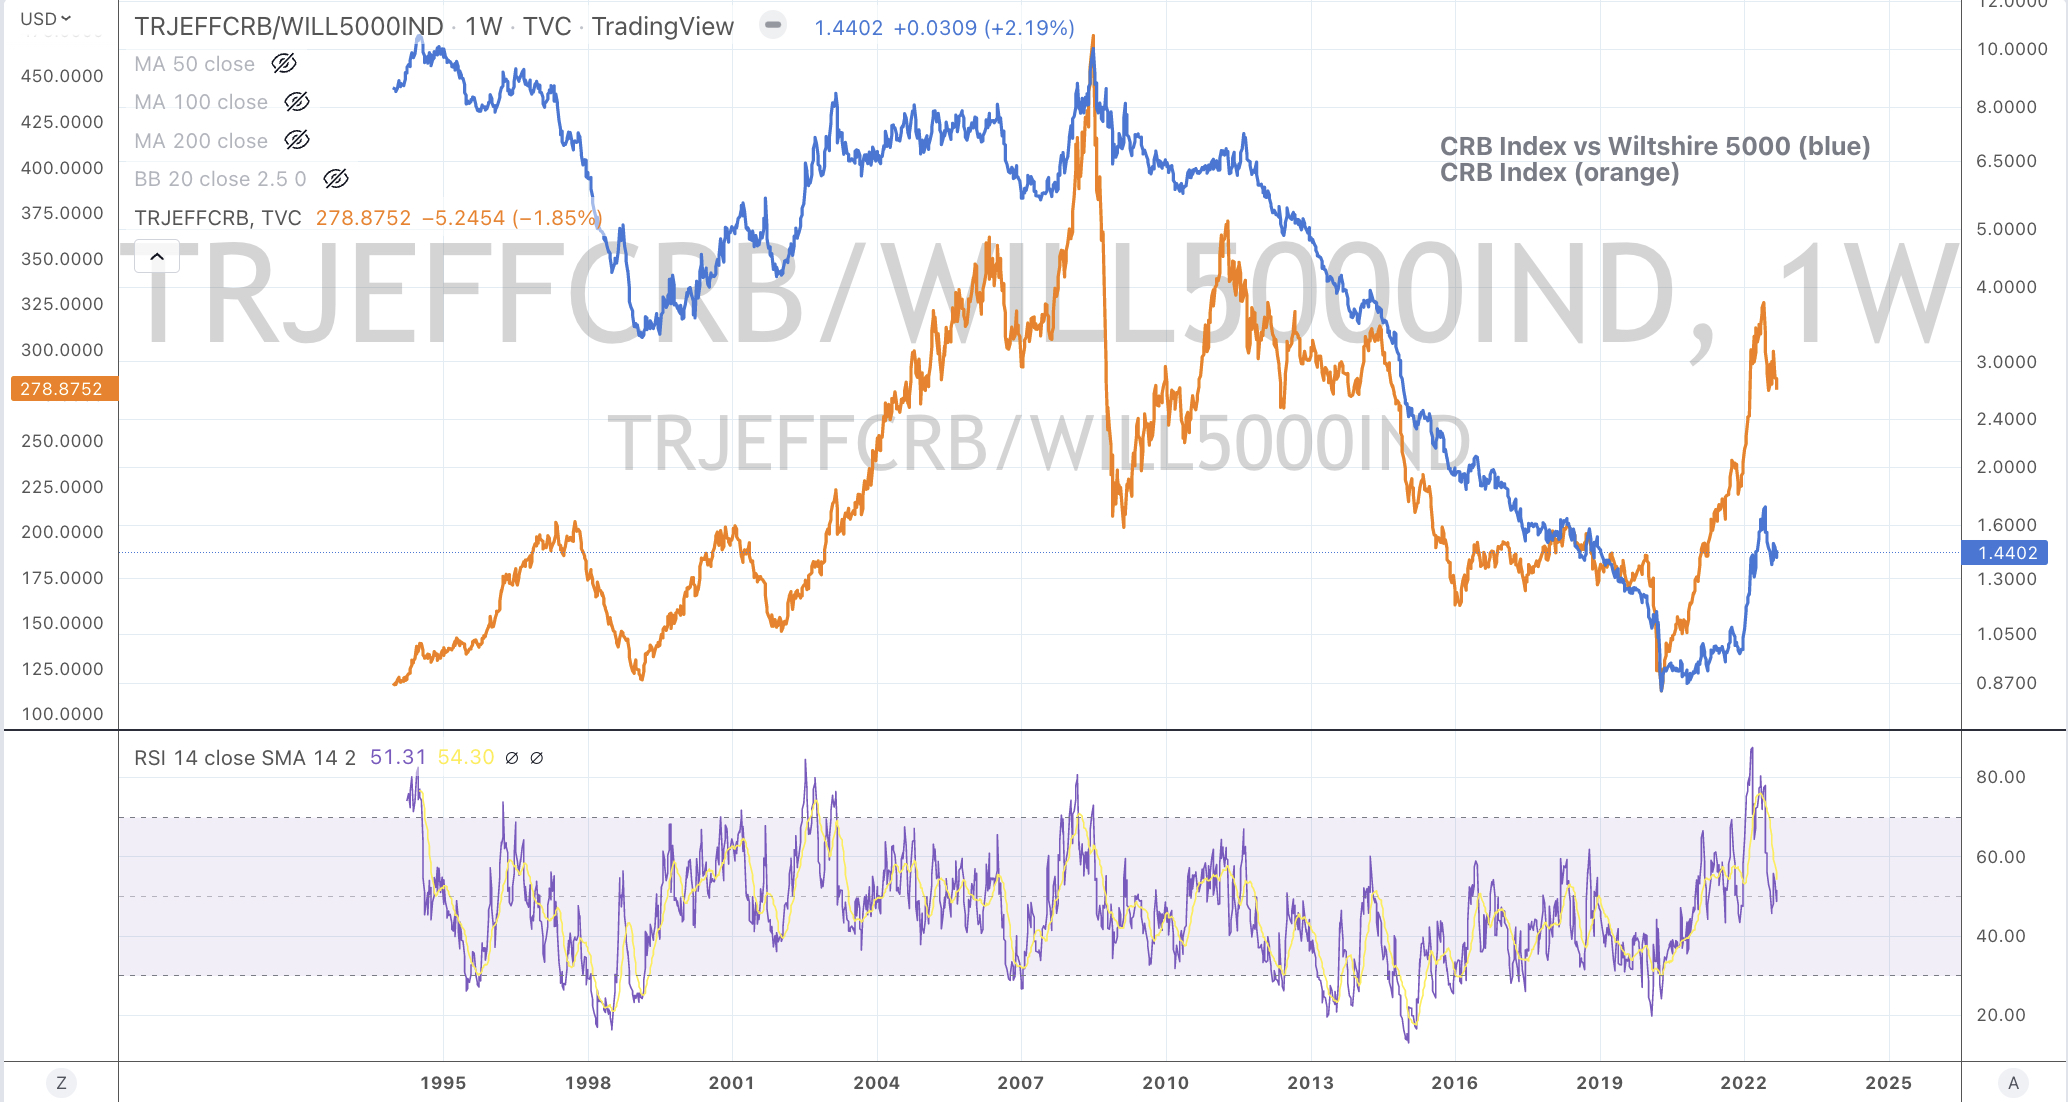
I use this ratio (in blue), being the Wilshire 5000 Total Market Index divided by the S&P Goldman Sachs Commodity Index (SPGSCI) to help identify when equities are either cheap or expensive relative to commodities.
Readers may piece together that I have bearish on commodities for the past 15 months or so.
I have circled 13 notable periods over the past 30 years when this ratio was overbought on a weekly basis.
Commodities are now entering such a period of being relatively attractive compared to equities.
I am constructively bullish about commodity prices, however that opinion is not broad nor blindly so.
I’m working on how to express my best ‘absolute’ view in a specific commodity or theme. Buying scarcity and those who have capacity will be a key criteria.
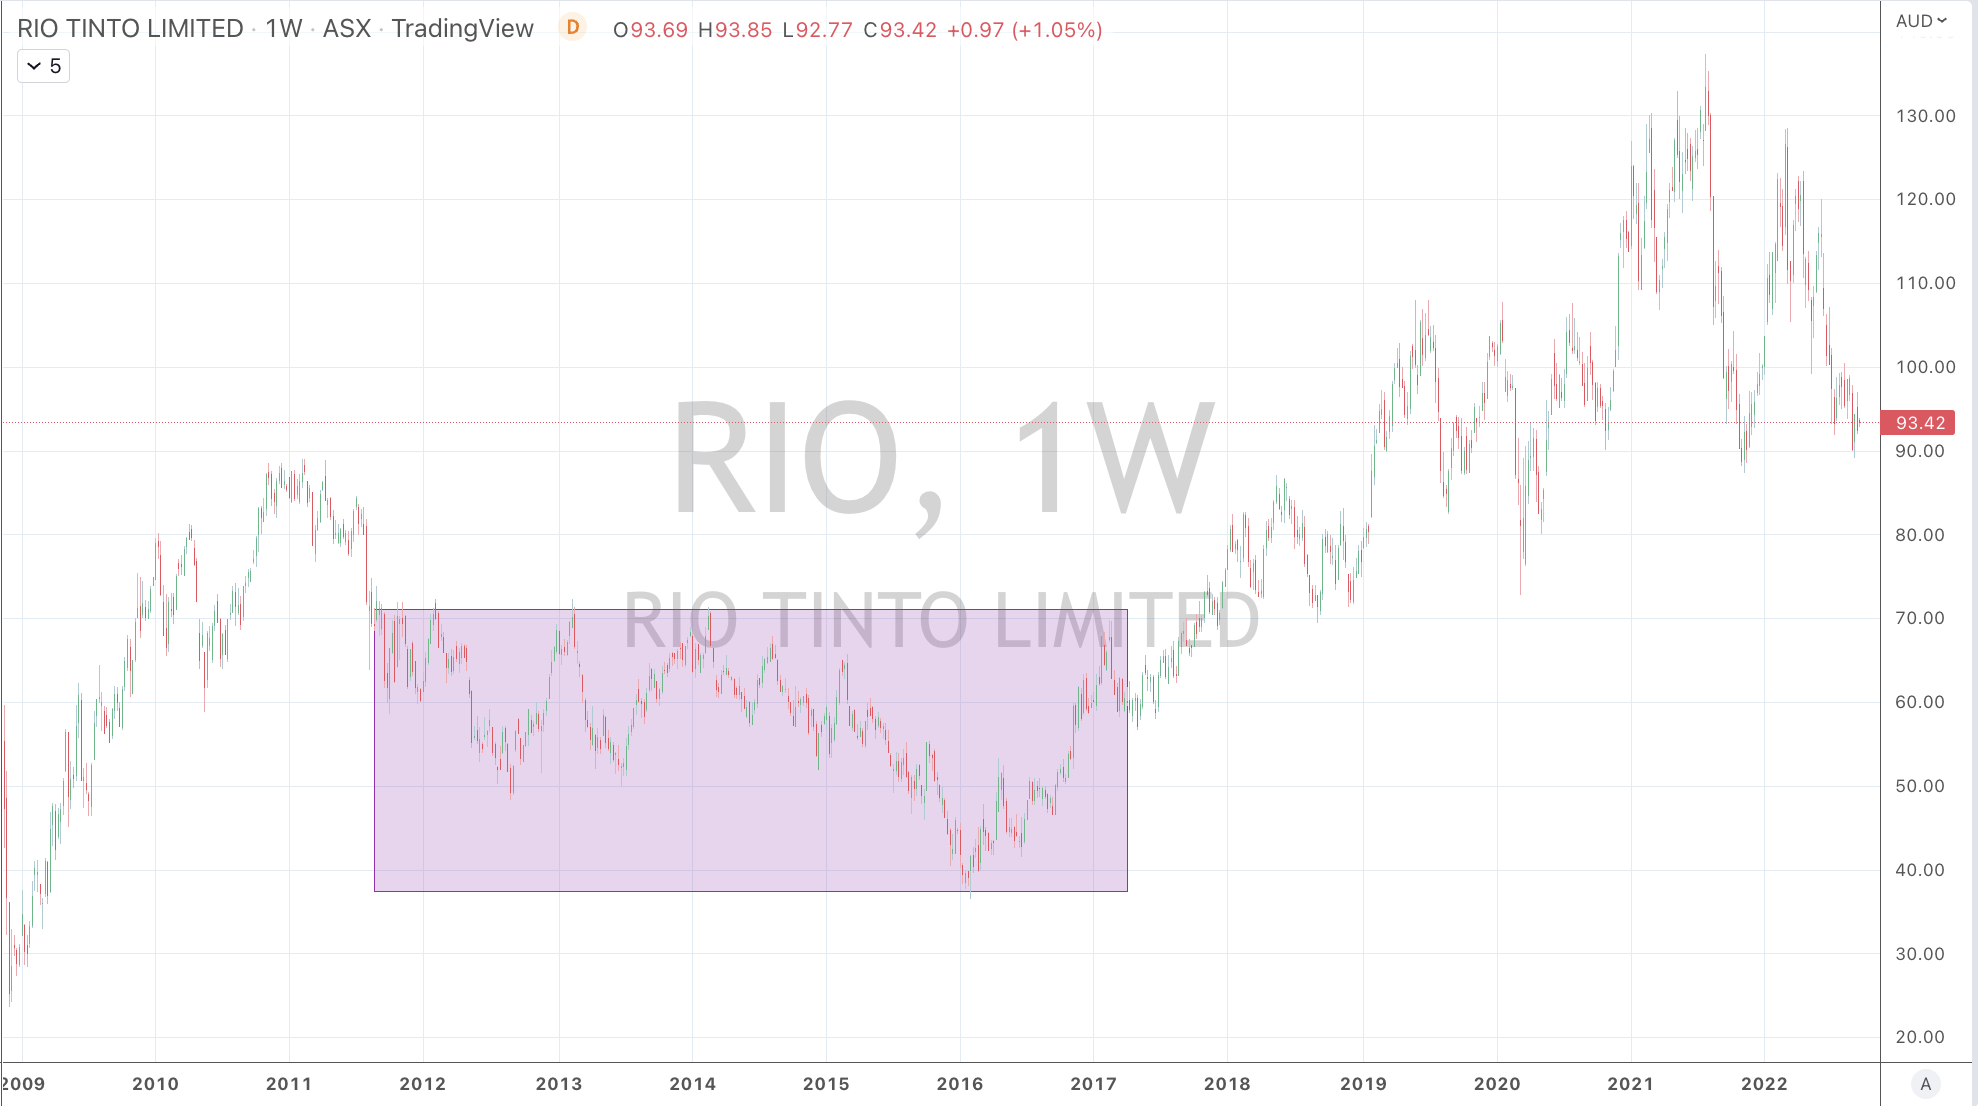
I remind myself that commodities can trade sideways (as Rio Tinto did for 7 years) and the broader CRB Index had for a 10 year bear market.
While I find analysis on a ‘relative basis’ irksome, commodities are nearing another visit to being inexpensive relative to equities, as the CRB Index to Wilshire 5000 chart shows.
Peaks in the USD/AUD have corresponded with troughs in the CRB Index (give or take 1-3 months)
Keep in mind that the Commodity Research Bureau (CRB) Index calculates the pricing of a basket of 19 commodities with energy contracts comprising nearly 40% of the weighting.
In my recent writings and observations, the energy complex is the last holdout in the current mean reversion in commodity prices.
This and the markets are currently telling me……
1) the USD strength is closing in on a peak, while allowing for one more surge higher (read: probability that AUD sympathetically moves a little lower too)
and
2) I expect energy prices to have one more lower leg or wave (RBOB Gasoline has nearly completed its)
So, I am preparing for another moment where this peak and trough synchronise.
The Thomson Reuters (core commodity) CRB Index hits its highest level since November 2014.
Weightings are particularly heavy towards energy and agricultural contracts.
The CRB is a whisker away from the target mentioned in this story written a few days ago, while the AUDUSD has hit my target of 0.7135.
This is part of my call of a peak for broader commodity prices.
Just take a look around the prices of Oil, Gasoline, Heating Oil, Corn, Wheat, Coffee, Cattle, Oats etc etc.
Also, the price action in Crude Oil is suggesting the recent run is waning.
#meanreversion
In turn, I am not owning any related equities across Oil & Gas, Bulk producers of grains and even miners of raw industrial/base metals.
It’s as good as it’s going to get for in this current wave.
So, what else to do…..
Well, I’ll wait…..
then I’ll watch the stock prices of companies who buy these raw commodities such as Kellogg, Starbucks, Kraft Heinz, Nestle, Nucor or Nippon Steel, as their input costs will fall, thus improving their margins.
…….also, the unloved precious metals are worthy of some attention, while the AUD/USD isn’t acting very constructively.
To many, it might seem perverse to Buy USD (and sell your AUD 0.7130) but that is what the market is telling me.
I’m also seeing divergences in currency correlations.
Take a look at the chart below showing the AUDUSD laid over the CRB Index and then the other is the price of BHP over the same currency cross.
I believe currency before I believe the equity.
For extra kicks, I’ve thrown a chart showing the price of Woodside Energy mimicking the CRB Index.