Macro Extremes (week ending October 14, 2022)

The following assets (on a weekly timeframe) registered an Overbought or Oversold reading and/or have traded more than 2.5 standard deviations above or below its rolling mean.

Extremes “above” the Mean (at least 2.5 standard deviations)

EUR/AUD

Overbought (RSI > 70)

U.S. Dollar Index (DXY)

TBX

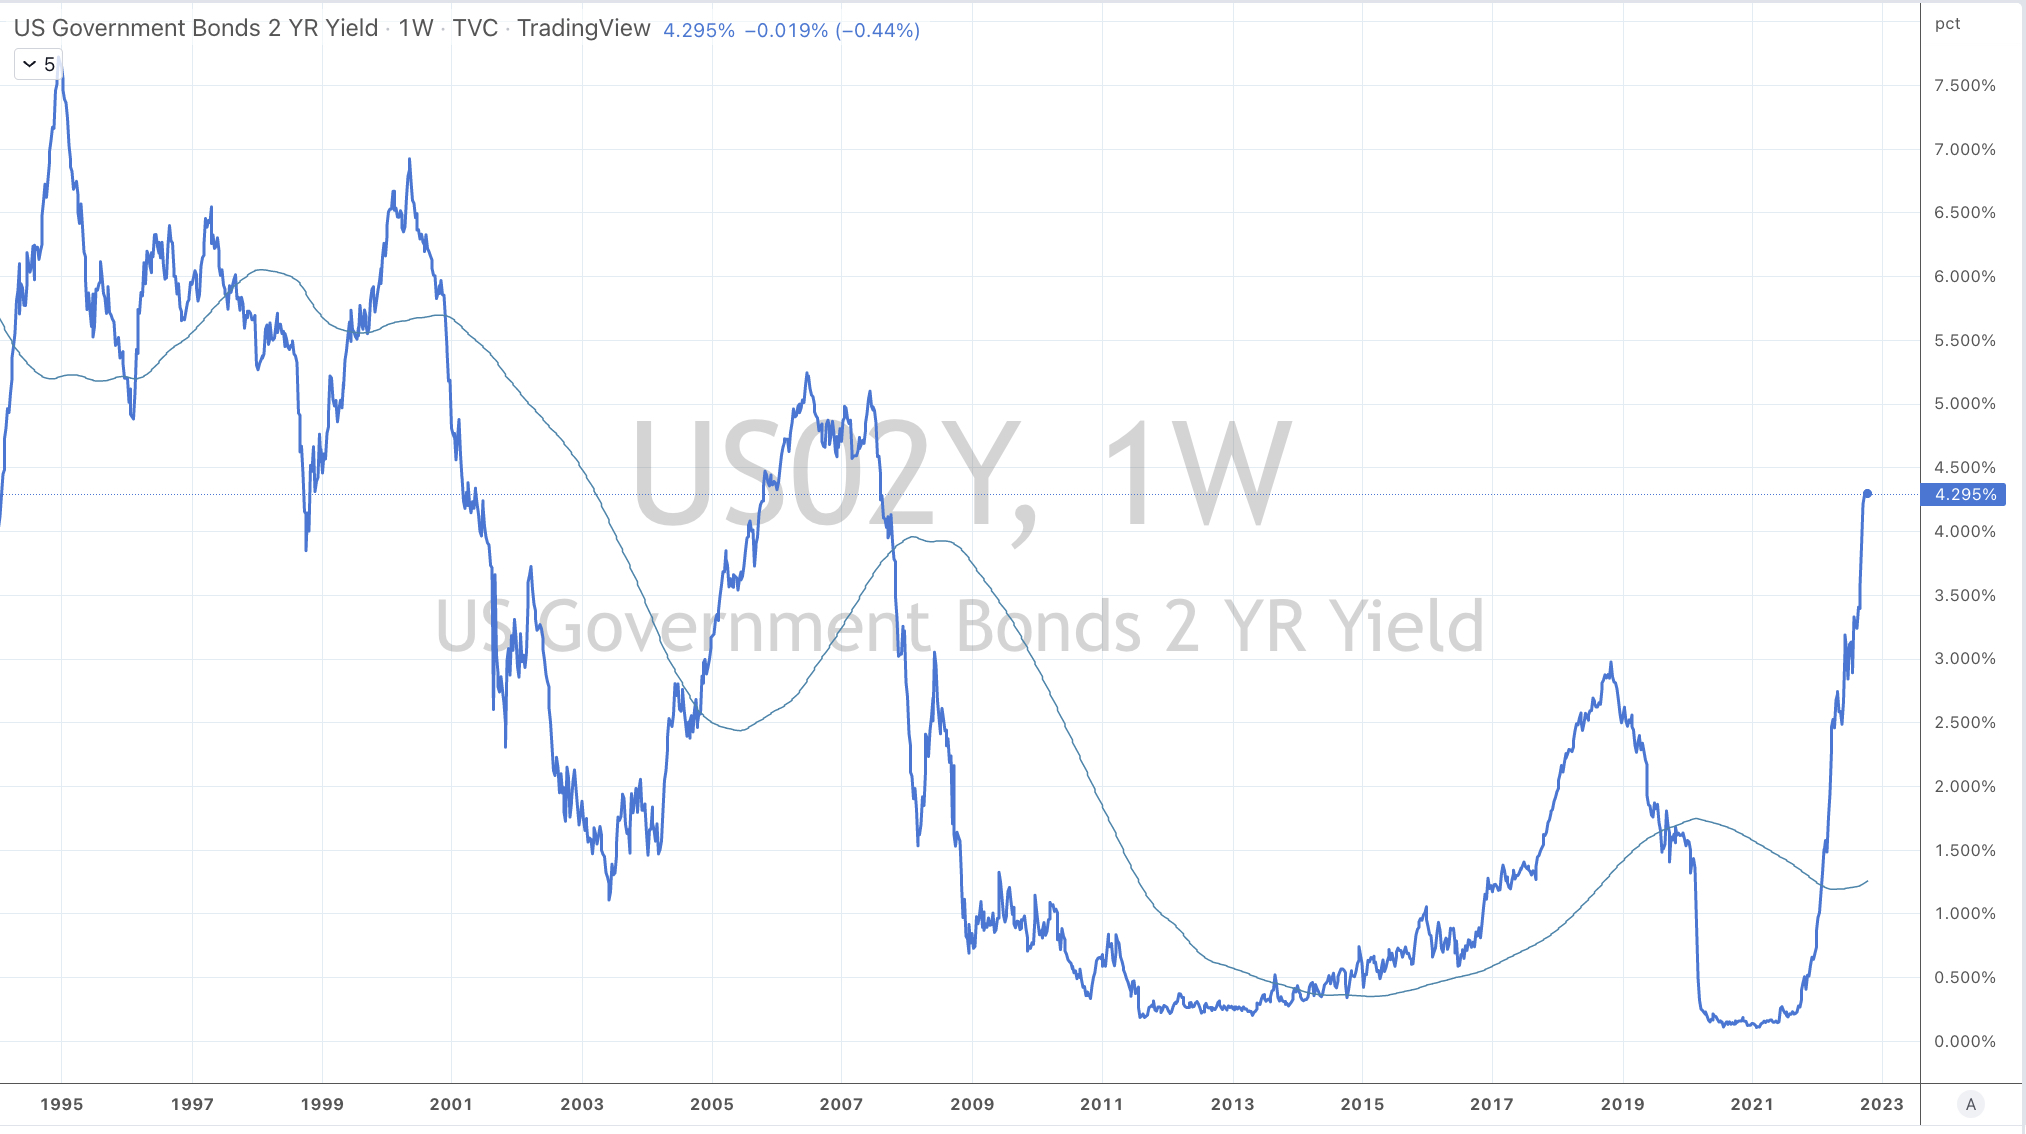
U.S. 2,5, 10, 20 and 30 year government bond yields

German 2, 5 & 10 year government bond yields

British 5 year government bond yields

Spanish, French, British, Greek, Italian, Korean, Portuguese and New Zealand 10 year government bond yields

The Overbought Quinella – Both Overbought and Traded at > 2.5 standard deviations above the weekly mean)

TBT

Extremes “below” the Mean (at least 2.5 standard deviations)

INR/AUD

AUD/CAD

Shanghai Composite

CSI 300 

FTSE 100

Oversold (RSI < 30)

Tin

Hot Rolled Coil Steel (HRC)

TLT

IEF & IEI

CAD/USD

EUR/USD

NZD/USD

CNH/USD

DKK/USD

JPY/USD

ZAR/USD

KRW/USD

SEK/USD

Hang Seng’s HSCEI and HSI equity indices 

And Taiwan’s TAIEX equity index

The Oversold Quinella – Both Overbought and Traded at > 2.5 standard deviations above the weekly mean)
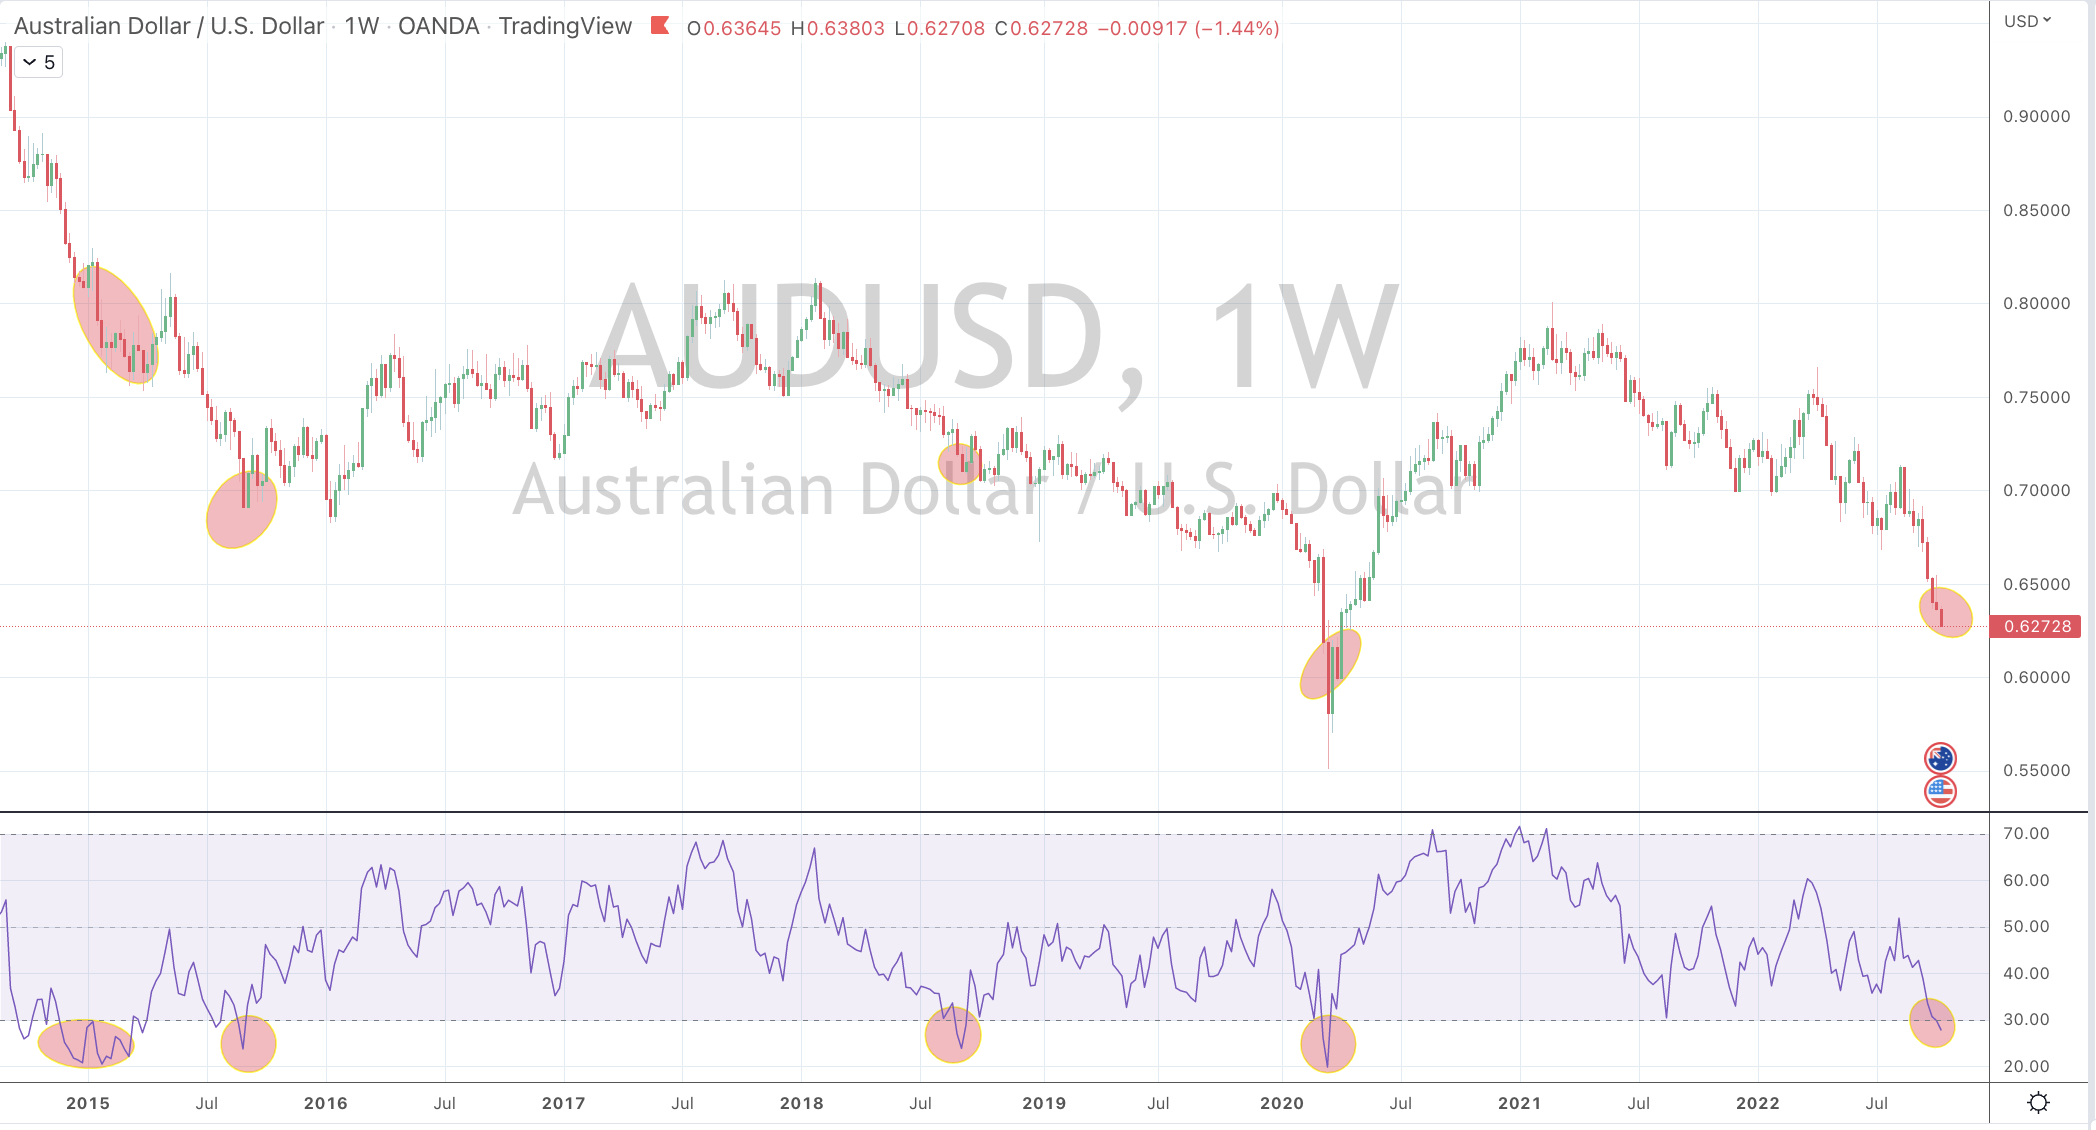
AUD/USD

AUD/SGD

Notes & Ideas:

The big news for the week was the first visit for the AUD/USD into a quinella of Oversold readings not seen for 2.5 years, which last occurred in March 2020.

The Aussie was also weak against the Singapore Dollar and the Euro (it has lost 8% vs EUR in a month) although more interestingly against another commodity sensitive peer, being the Canadian Loonie.

There will be a seperate post about my thoughts on the AUD/CAD currency cross.

This somewhat correlates with the was weakness in the energy commodities complex but that is OK for in last week’s edition I wrote, “ Gasoline, Brent, Heating Oil and Diesel rose somewhere between 15% and 26% in a single week”.

In other news, equities were mostly muted except for the movers in the list below while Palladium and Silver had a rough week.

If you are a ‘market person’ you’d know that many government bond yields (albeit they rose for the week) are not higher than seen 3 weeks ago.

The British Pound against the USD and other currencies is no longer Oversold. In fact, the Aussie has weakened 8% against Pound Sterling in the past 2 weeks. That’s a heck a move for a developed world currency cross however the fact that the AUD/GBP is no longer overbought isn’t a surprise as it was reported at such an extreme in this publication 3 weeks ago.

In other news, Bitcoin hit an intra-week low of $18,131. It’s lowest since June 13, 2022. The prior time that it traded that low was in December of 2020.

Cotton and Toronto’s TSX mean reverted to its 200 week moving average.

The New Zealand 10 year yields reappeared into Overbought territory.

The South Korean KOSPI isn’t Oversold this week.

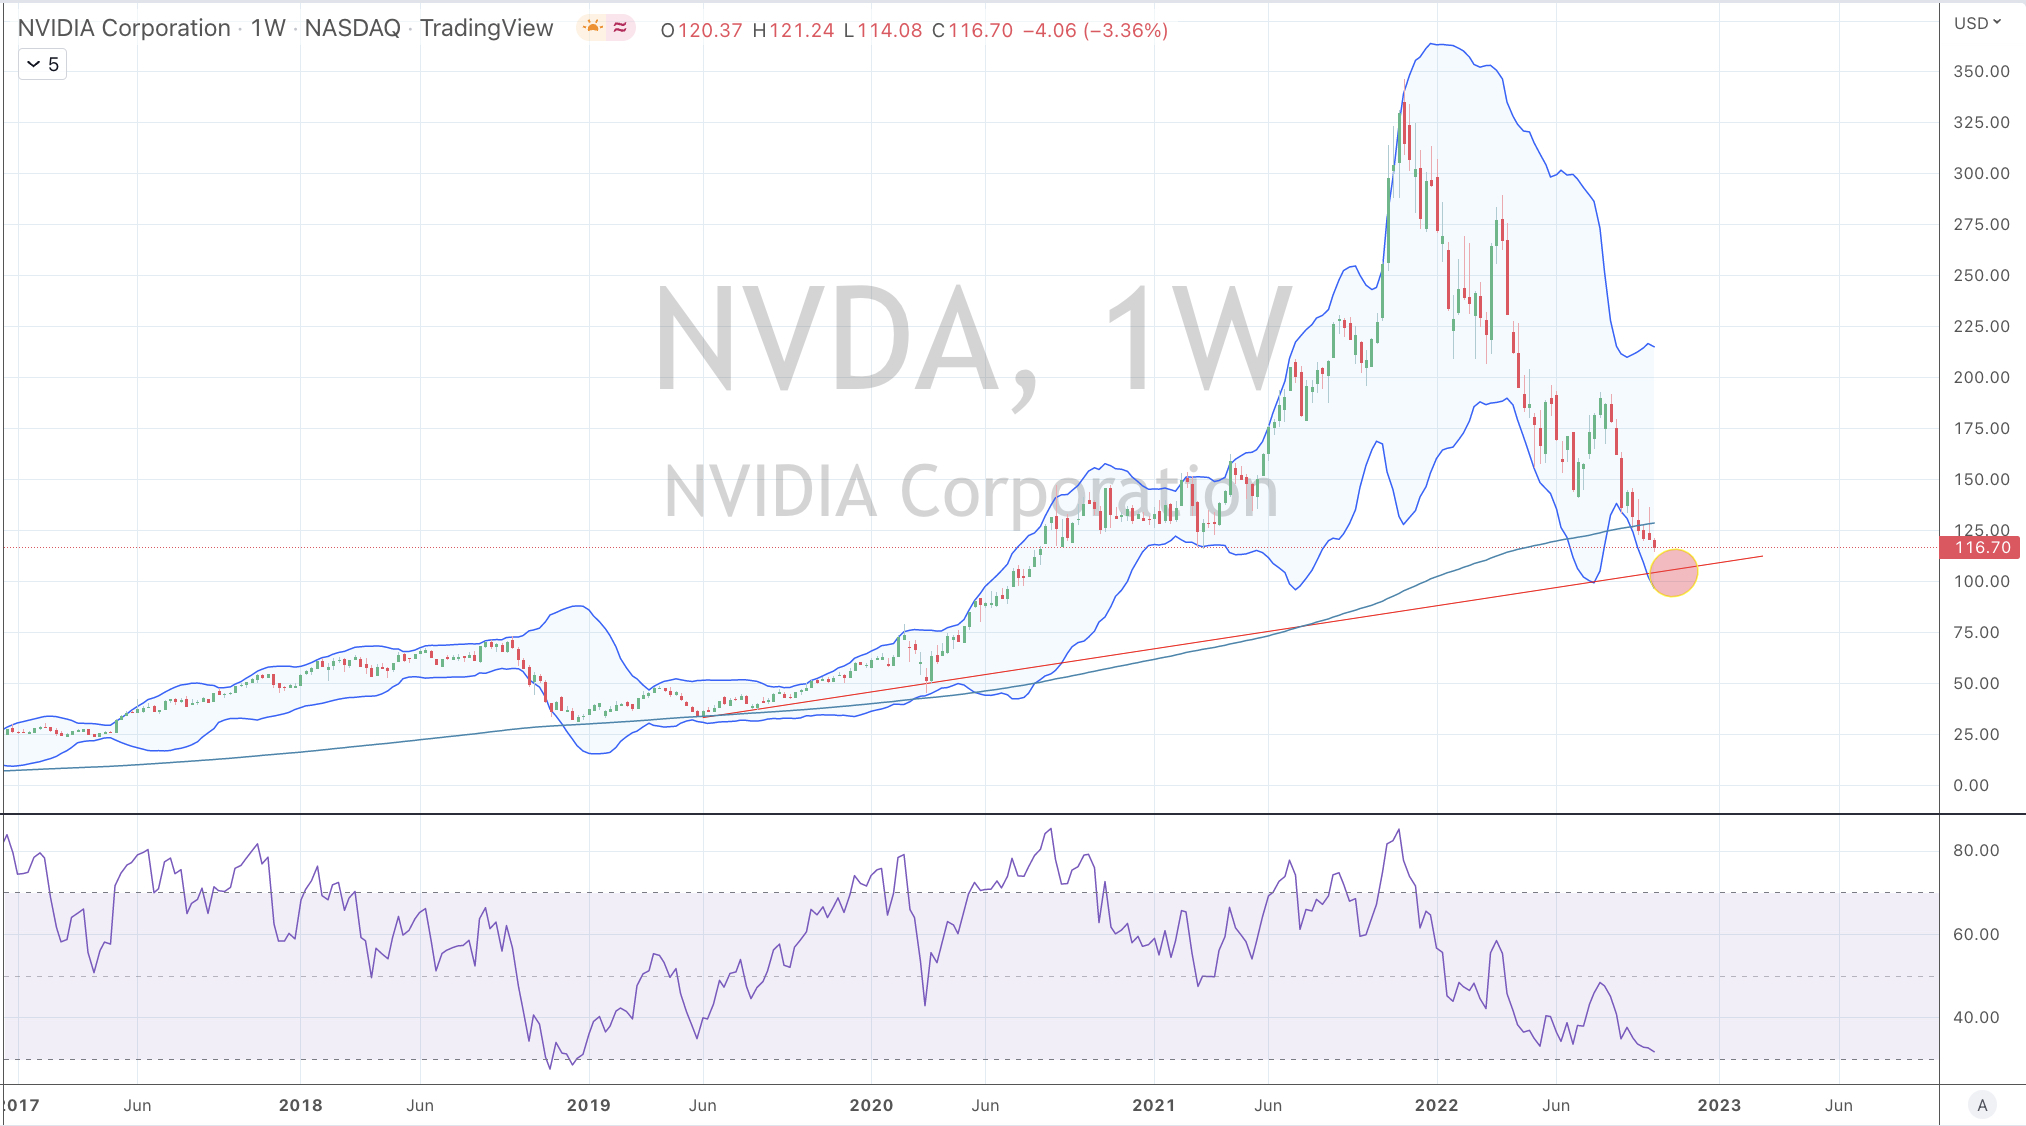
The Philadelphia Semiconductor Index (SOX) has now fallen 30% in the past 10 weeks. 

The second biggest news was that most of the energy complex (attributing much to the CRB Index percentages rise) had a cracker of a week with Gasoline, Brent, Heating Oil and Diesel rose somewhere between 15% and 26% in a single week……all except Gas, including Natural Gas which saw an intra-week low of $6.30 and closing in on my $5.00 target.

Dutch TTF Gas and the Japan-Korean LNG Marker continue their string of notable weekly declines.

It’s not a surprise that Rotterdam delivered coal rose 5% follow a 34% drubbing over the past 5 weeks and after touching an Oversold extreme last week and that the Baltic Dry Index fell 6% following its tear of 81% over the past 5 weeks.

The larger advancers over the past week comprised of; 

Australian Coking Coal 3.9%, Aluminium 1.8%, Rotterdam Coal 4.7%, Lumber 10.9%, Uranium 4.1%, Oats 5%, DAX Index 1.3%, Copenhagen 2.6% and Helsinki rose 1.9%.

The group of decliners included;

Bloomberg Commodity Index )3%), Baltic Dry Index (6.3%), WTI Crude (7.6%), Gasoil (13.7%), Gold (3%), Lean Hogs (11.5%), JKM LNG Marker (6.4%), Coffee (9.8%), Tin (2.2%), Natural Gas (4.4%), Palladium (8.9%), Platinum (2.5%), Gasoline (3.8%), Silver (9.2%), CRB Index (3.1%), Dutch TTF Gas (9.1%), Brent Crude (6.8%), Silver in AUD (6.9%), Wheat (2.3%), SP GSCI (5.2%), AEX (2.6%), HSCEI (7.3%), HSI (6.5%), Bovespa (3.7%), Nasdaq 100 (3.2%), Oslo (2%), SOX (8.3%), STI (3.4%), TAIEX (4.2%), FTSE 100 (1.9%), Nasdaq Composite (3.1%) and Australia’s ASX 200 was flat for the week. It fell 0.06%.

October 16, 2022

By Rob Zdravevski

rob@karriasset.com.au   

Oversold Aussie yield curve is good for an ASX 200 rally

The vertical lines show when the AU 10Y-2Y yield curve becomes oversold (on a weekly basis) it coincides with a starting point for an advance in the ASX 200.

Keep in mind, this is not a study about an inverted yield curve. On that topic, the current Australian 10 year minus 2 year government bond yields are not forecasting a recession.

October 14, 2022

by Rob Zdravevski

rob@karriasset.com.au

An Oversold US 5Y – 3M yield curve is good for SPX longs

Checking in to look at the U.S. 5 year bond yield minus 3 month bill rate (yield curve)

Rather than watching whether this yield curve inverts in order to predict a recession…….this study shows you that when this yield curve trades Oversold on a Weekly basis (irrespective of its percentage spread), it portends the beginning of a new or an extension of an immediately preceding rally in the S&P 500.

The most recent moment occurred this past July.

October 14, ,2022

by Rob Zdravevski

rob@karriasset.com.au

No one is going to blow up Taiwan Semiconductor

Additional tension between China, the United States and the importance of Taiwan Semiconductor Manufacturing Company may signal the end, at least when it comes to the plunge in stock prices of affected or related semiconductor companies.

Today’s news is as close to a crescendo of threats as may be possible, without the next step being actual action.

https://www.bloomberg.com/news/articles/2022-10-12/no-need-to-blow-up-tsmc-in-china-war-taiwan-security-chief-says?sref=qLOW1ygh

This heightened angst may signal we are nearing the end of the tough talk but it’s a reminder that he deeper reason for many stoushes involving the United States are about trade and economics.

Will China actually take over TSMC?

This post I wrote in February 2022 put TSMC’s importance in perspective.

This post also written in February 2022 posed a put option trade idea should things become a little more ‘hairy’.

Since late February, shares in TSMC have fallen 50% and those options have risen 4-fold.

Was Pelosi’s visit to Taiwan worth it?

Since Nancy Pelosi arrival on Taiwan soil on August 2nd, 2022, the SOX Index has fallen 27%. 

Good one Nance ! 

All of that in 2 months but I think hubby, Paul’s call option buying of Nvidia in the days prior to you announcing the trip to Taiwan haven’t worked out either (presuming he’s still holding them) as that stock has tanked 39% since your visit.

Is Biden’s decision on Friday October 7th, 2022 to ban semiconductor (and equipment) exports to China wise?

https://www.bloomberg.com/news/articles/2022-10-07/white-house-announces-new-restrictions-on-chip-exports-to-china?sref=qLOW1ygh

Since then (in 3 trading sessions) the shares in LAM Research, Applied Materials, Intel, AMD, Nvidia, KLA Corp, ASML and TSM have fallen 19%, 14%, 8%, 15%, 12%, 15%, 13% and 15% respectively.

Biden is still help bent on his pre-mid term election strategy of being tough on China and invoking massive domestic spending (the opposite to Obama, whom Biden blames for their mid-term mauling in 2014) but he causing higher inflation by ‘de-globalising’ relations which have traditionally assisted the United States and various nationalism and protectionist measures are adding to global tensions.

I don’t think Biden realises the job losses and investment losses he is about to cause with these export bans, let alone the investment losses being caused. 

For some perspective, notwithstanding overvaluations and possible slowing product demand, since is price peak in November 2021, Nvidia has seen its shares fall 65% and its market capitalisation has declined by $554 billion.

That is the same amount of money if you wiped out the entire market capitalisation of Australia’s largest 4 banks, BHP, Rio Tinto, Wesfarmers and Woolworths or 50% of the total market capitalisation of companies listed on the Australian Stock Exchange (ASX).

October 12, 2022

by Rob Zdravevski

rob@karriasset.com.au

Banks not only feed the piggies but they slaughter them too

I keep reiterating that what is more important about where interest rates have traded up to isn’t about the nominal rate, but rather the quantum or factor which the nominal rate have risen by.

Yes, the numbers look bigger when rates are rising from 0.5%…..but people, households, companies, governments etc etc don’t necessarily temper their borrowing when rates are low…..We tend to become accustomed to the ‘going rate’.

In general, the piggies are always at the trough.

When a family is seeking a mortgage of $600,000 but their credit provider announces the good news that they have been approved for $680,000, I suspect that they accept all of the $680,000. After all, they can use it for the landscaping etc etc.

We are happy to continue taking as much we can get or is available.

If my mobile phone plan allows for 20GB of data, I’m sure I’ll use it up and then ask for an upgrade to 40GB. Soon after, I’ll be requesting for an upgrade to 60GB of data.

When the Australian cash rates were 0.25% in last 2020, I was asked if I thought the Reserve Bank of Australia would cut rates at the next meeting.

My response was, “who cares”. The questioners were often shocked by my seeming flippancy.

At this point, I would add by asking, “How much debt do you have and how pressure are you under, that you need a further 15 or 25 basis points of relief”.

Today, if your cost of borrowing has risen from 3% to 6% and you are now speculating whether interest rates go up a further 1% receives the same response from me with the difference being, are you still carrying so much debt that you may ‘break’.

Is it the Fed that is possibly going to ‘break something’ or have we simply kept taking on more debt?

In the graphics below, you can see where the citizens of various nations sit in the indebted stakes.

source: Trading Economics
https://tradingeconomics.com/country-list/households-debt-to-gdp

Look at those frugal and financial responsible Latvians and Hungarians.

Household Debt as % of net disposable income
source: OECD

Let me get back to the illustrating the ‘factor’ of the rise.

When rates went from 6% to 8%, it was only a 33% increase.

When rates went from 8% to 16%, it was ONLY a 50% increase.

Mortgage rates in Australia have nearly doubled. In the U.S., they have easily doubled.

The U.S. 2 years Treasury Bond yield has risen 10 fold.

When your interest repayments or the total cost of capital increase by such a factor, it is the quantum of the rise from the previous levels where you were comfortable with, that hurts the most.

My studies show that government bond yields have never risen by factors of 3 or 4 from their lows within any credit cycle.

At these extremes, as the chart within the below shows, the 2 year bond yield is miles above its 200 week moving average.

Why doesn’t mean reversion matter now, when it has many times prior?

Expecting rates to go higher and challenge gravity, probability and mathematics is a very foolish and crowded trade.

This is not about calling doom and whether the Fed ‘breaks something’……but rather it’s about thinking independently and reading the market tape as it is.

Behind the talk of where rates go to, sits speculative or investing opportunity.

If you have a view….then make the trade and take a position.

Those who shorted bonds when rates were 1% have made a fortune.

Today, if you think rates go up noticeably more……enough to tempt you into a trade, then short bonds and ride the expectation of whether the Fed keeps hiking rates to a point where ’they break something’.

If you think interest rates will fall, you could buy bonds.

Although, this is not a binary choice and the bond market may not be your natural business.

You can express you trade idea in many different manners.

For example, if interest rates keep rising, then you could short the equity of heavily indebted companies or technology stocks which aren’t profitable and have negative free cash flow, or

If you think rates are going to decline, then perhaps owing shares in high growth companies may see their prices ‘catch a bid’.

Of course, this is not personal advice and it’s important to do your research and analysis.

October 12, 2022

by Rob Zdravevski

rob@karriasset.com.au

The real return matters

Once upon a time when you bought a government bond to receive a yield of 2% and the inflation rate was 1%, your real return was 1%.

When bonds were yielding 0.5% and inflation was 0.5%, the real return was 0%. At least investors weren’t losing money.

Heck, when German 10 year bonds were yielding negative 0.5% and inflation was negative 0.2%, investors capital remained mainly intact.

Now that bond yields have risen sharply, many holders of those bonds have lost capital. If you are not aware, when the price of a bond falls, the yield inversely rises. And vice-versa.

Today, if you are tempted to or are pondering buying a U.S. government bond, you will receive a 4% yield but when inflation is 7% (and I’m being kind), your real return is Negative 3%.

With this losing prospect, (unless you seek riskier or distressed opportunities) many investors are choosing to either sell their bonds (and realising capital losses) or not buy them at all.

This is exacerbating the selling or general distaste of or for bonds and that means prices continue to fall as bond yields rise further.

The latter is a problem for governments or companies who need to issue debt. Their interest (coupon) repayments costs are higher than recent times.

If you are in business, the cost of (capital) borrowing is now more expensive.

But, if investors are selling bonds or choosing not to buy them, logically that means those intended funds are remaining as cash.

The real return for cash is worse than being in bonds.

Real Estate may yield 3% or 4% but its real return isn’t any better especially if you need to account for taxes and any borrowing costs.

Commodity prices do correlate well with inflation and worthy of investment merit although they don’t produce income or a yield per se.

This brings me to the equity market.

Generally speaking, valuations of many equity markets are not demanding in their own right.

When compared to their real return (earnings yield minus inflation) they are presenting a slightly better proposition than government bonds.

The S&P 500 has a forward P/E of 16, thus its earnings yield (divide the PE ratio of 16 into 100) is 6.2% and so when we subtract a 7% inflation rate, it becomes slightly negative.

That is better than the (3%) real return from a 10 year government bond.

S&P MidCap 400 P/E is 13 so its earnings yield of 7.7%, making the real return slightly positive or breaking even.

The Chinese equities market has a P/E of 10 which calculates into a 10% earnings yield. Subtracting the China inflation rate of 3% (its actually 2.7%) renders a positive real return of 7%. When also you ponder converting USD into a weak Yuan…….Whoa !!!

If those index examples are not enticing enough or too risky, then individual equities may offer a better return whilst possibly taking less risk.

There are companies with terrific franchises trading at P/E ratios of 8 (or an earnings yield of 12%) with real businesses, hard assets and have little to no debt.

Instead I’ll look at companies that have real businesses, with hard assets and current cashflows. The ones which don’t have any debt or only a little.

The ones with P/E ratios below 8.

And if they have debt, some of them issued their bonds cleverly such as Apple’s recent 40 year maturities on a yield of 2.8%. This implies that Apple Inc. is more creditworthy than the U.S. Government.

I like the the type of companies whose businesses are solid and don’t rely on the ‘kindness of a stranger’ to use them. Companies who may have market share or pricing power. Where they have balance sheets and income statements which suggest that one year of EBITDA (even if its discounted and reduced) would easily cover all of its debt, where its current assets could pay off the whole of its total liabilities or where I don’t want to pay too much for an inflated amount of goodwill.

With a little more movement in markets and adjustment in corporate valuations, equities could once again carry the moniker of T.I.N.A. …….There Is No Alternative.

More so, with all this cash sitting around earning negative real returns.

October 12, 2022

by Rob Zdravevski

rob@karriasset.com.au

Semi’s are closer to the end of the move

Many are watching the great semiconductor shake-out.

The warnings of fervour and a peak where evident 15 months ago.

Speculators were playing in rarefied air when the SOX Index was flying between 3,400 and 4,000.

Today, it’s trading at 2,275.

Nvidia is one but not the only proxy for calling an end of the decline.

Seeing NVDA shares trade at $105-$108 may be a point to heighten my awareness to some form of exacerbation or trough in share prices of various semiconductor stocks.

October 11, 2022

by Rob Zdravevski

rob@karriasset.com.au

You won’t buy them on a P/E of 11

I’m reminding myself to be ready to buy great franchises at valuation multiples that you seldom see.

Microsoft may be one of those.

If the price trades down to the $216 mark, the price action makes me comfortable that the stock has noticeably mean reverted to its 200 week moving average and has traded to 2.5 standard deviations below its weekly mean and registered a weekly oversold reading.

At $216, MSFT would be trading on a forward P/E ratio of 18.

One doesn’t see MSFT trade at 18 times earnings too often.

October 11, 2022

by Rob Zdravevski

rob@karriasset.com.au

AUD/USD – it’s time

The next and perhaps last point for the AUD/USD in this last downward leg sits around 0.6210 (+/- 20 basis points)

The AUD/USD is entering a 5th moment of being Oversold in the past 8 years.

This can be paraphrased by saying we are in the vicinity and ‘it’s good enough’.

So, I’m selling some USD and buying AUD.

This currency low and pending reversal or reversion will also has have affect on assets such as Copper, Oil and Gold.

October 11, 2022

by Rob Zdravevski

rob@karriasset.com.au

It always remains about Oil

Did anyone find the irony and hypocrisy in the Biden Administrations disapproval over OPEC+’s decision to cut oil production quotas at their recent meeting?

President Biden et al. aren’t thrilled with the decisions, which should invariably send oil prices higher.

It did.

WTI Crude and Brent Crude rose 16.5% and 15% for the week, respectively.

So, does Biden actually want OPEC+ to pump, produce and export more oil?

But isn’t this against his climate policy?

Well, this is another hypocrisy of his.

It’s not a question about why he is releasing so much oil from the U.S. Special Petroleum Reserve. That answer is to win votes this November 2022.

But it inevitable that when more Oil is released, then more Oil is burned and used.

And this story goes round and round and round.

It’s relevant to identify the price-taker and who is the price-maker.

October 9, 2022

by Rob Zdravevski

rob@karriasset.com.au