Oil & Gas rigs are still climbing

Globally, we may be 6 months away from reaching the same oil rig count as seen in March 2020, for the number of rigs in action tend to decline through November – February.

The lag in deployed rigs appears in the Middle East, Africa and ESG ‘shamed’ Europe.

I don’t know why Biden is so angry at his American Oil & Gas E&P companies, for their rig count is nearly back to where they once came from.

I think that threat of his to impose a super tax of their ‘super’ profits was a mid-term election rhetorical ploy.

November 10, 2022

by Rob Zdravevski

rob@karriasset.com.au

A declining Revenue to Employee ratio equals job layoffs

Too many employees and not enough revenue?

Perhaps your revenue to employee ratio isn’t what you are hoping for?

Decades ago, I figured good businesses tend to generate $300,000 of revenue for each employee on the books. That number was and is still considered quite good.

See if that works out close amongst some local businesses that you may know.

Back in original tech boom, Cisco Systems was amongst the gold standard in this category.

In 1998 Cisco had revenues of $8.5 billion and 145,000 employees thus the revenue to employee (Rev/Emp) figure was $586,000

In 2016, their revenue was $49.2 billion versus 73,700 for $668,000 revenue per employee.

In 2021, revenue was relatively steady at $49.8 billion against 79,500 employees for a Rev/Emp of $626,000.

The better gold standard back in 1998 was Apple.

A year after Steve Jobs returned to the company and launched the iMac to replace the ‘Macintoshes’, they were doing $6 billion revenue with 6,700 employees for a Rev/Emp of $895,000

In 2016, revenue of $216 billion using the employ of 116,000 people made that figure jump to $1.86 million

and in 2021, $366 billion revenue with 154,000 employees equals $2.38 million revenue for each employee.

So, when we look at the job layoffs occurring in Silicon Valley this year, perhaps the companies are running with too much fat.

Facebook (Meta) at $1.64 million Rev/Emp and Spotify’s $1.73 million seem to be looking OK, while Twitter’s $667,000, Tesla’s $757,000, Shopify’s $520,000 and Oracle’s $302,000 may help explain labour redundancies.

In comparison, companies such as Coca Cola has a Rev/Emp ratio of $535,000, Boeing is at $430,000, Citigroup is $343,000 and Starbucks does $182,000 based on its $25 billion of revenue compared to their headcount of 138,000 people.

November 10, 2022

by Rob Zdravevski

rob@karriasset.com.au

Macro Extremes (week ending November 4, 2022)

The following assets (on a weekly timeframe) registered an Overbought or Oversold reading and/or have traded more than 2.5 standard deviations above or below its rolling mean.

Extremes “above” the Mean (at least 2.5 standard deviations)

Copper/Gold Ratio

Overbought (RSI > 70)

Cattle

Orange Juice

TBT and TBX bond ETF’s

U.S. 2, 5, 10, 20 and 30 year government bond yields

German 2 and 5 year government bond yields

U.S. 5-7 year corporate bond yields

U.S. 10 year minus Australian 10 year bond yields

Divide the difference between the yield of the U.S. 10’s and Australian 10’s

U.S. 5 year bond yield minus U.S. 5 year breakeven inflation rate

U.S.10 yer bond yield minus U.S. 10 year breakeven inflation rate

The Overbought Quinella – Both Overbought and Traded at > 2.5 standard deviations above the weekly mean)

None

Extremes “below” the Mean (at least 2.5 standard deviations)

Coffee

Oversold (RSI < 30)

Tin

Hot Rolled Coil Steel (HRC)

IEI, IEF & TLT bond ETF’s

Taiwan’s TAIEX index

INR/USD

IDR/USD

JPY/USD

The Oversold Quinella – Both Overbought and Traded at > 2.5 standard deviations above the weekly mean)

None

Notes & Ideas:

This past week’s big news is bonds were mainly bid higher causing many yields to fall, even after the Bank of England, Australia’s Reserve Bank and the U.S. Federal Reserve all lifted interest rates.

It was a case of ‘sell the rumour and buy the fact’.

In this week’s list ‘extremes’ above, I have added some stranger bond yield relationships to create some curiosity.

Commodity indices had a strong week.

Many more currencies aren’t showing ‘extreme’ weakness against the U.S. Dollar.

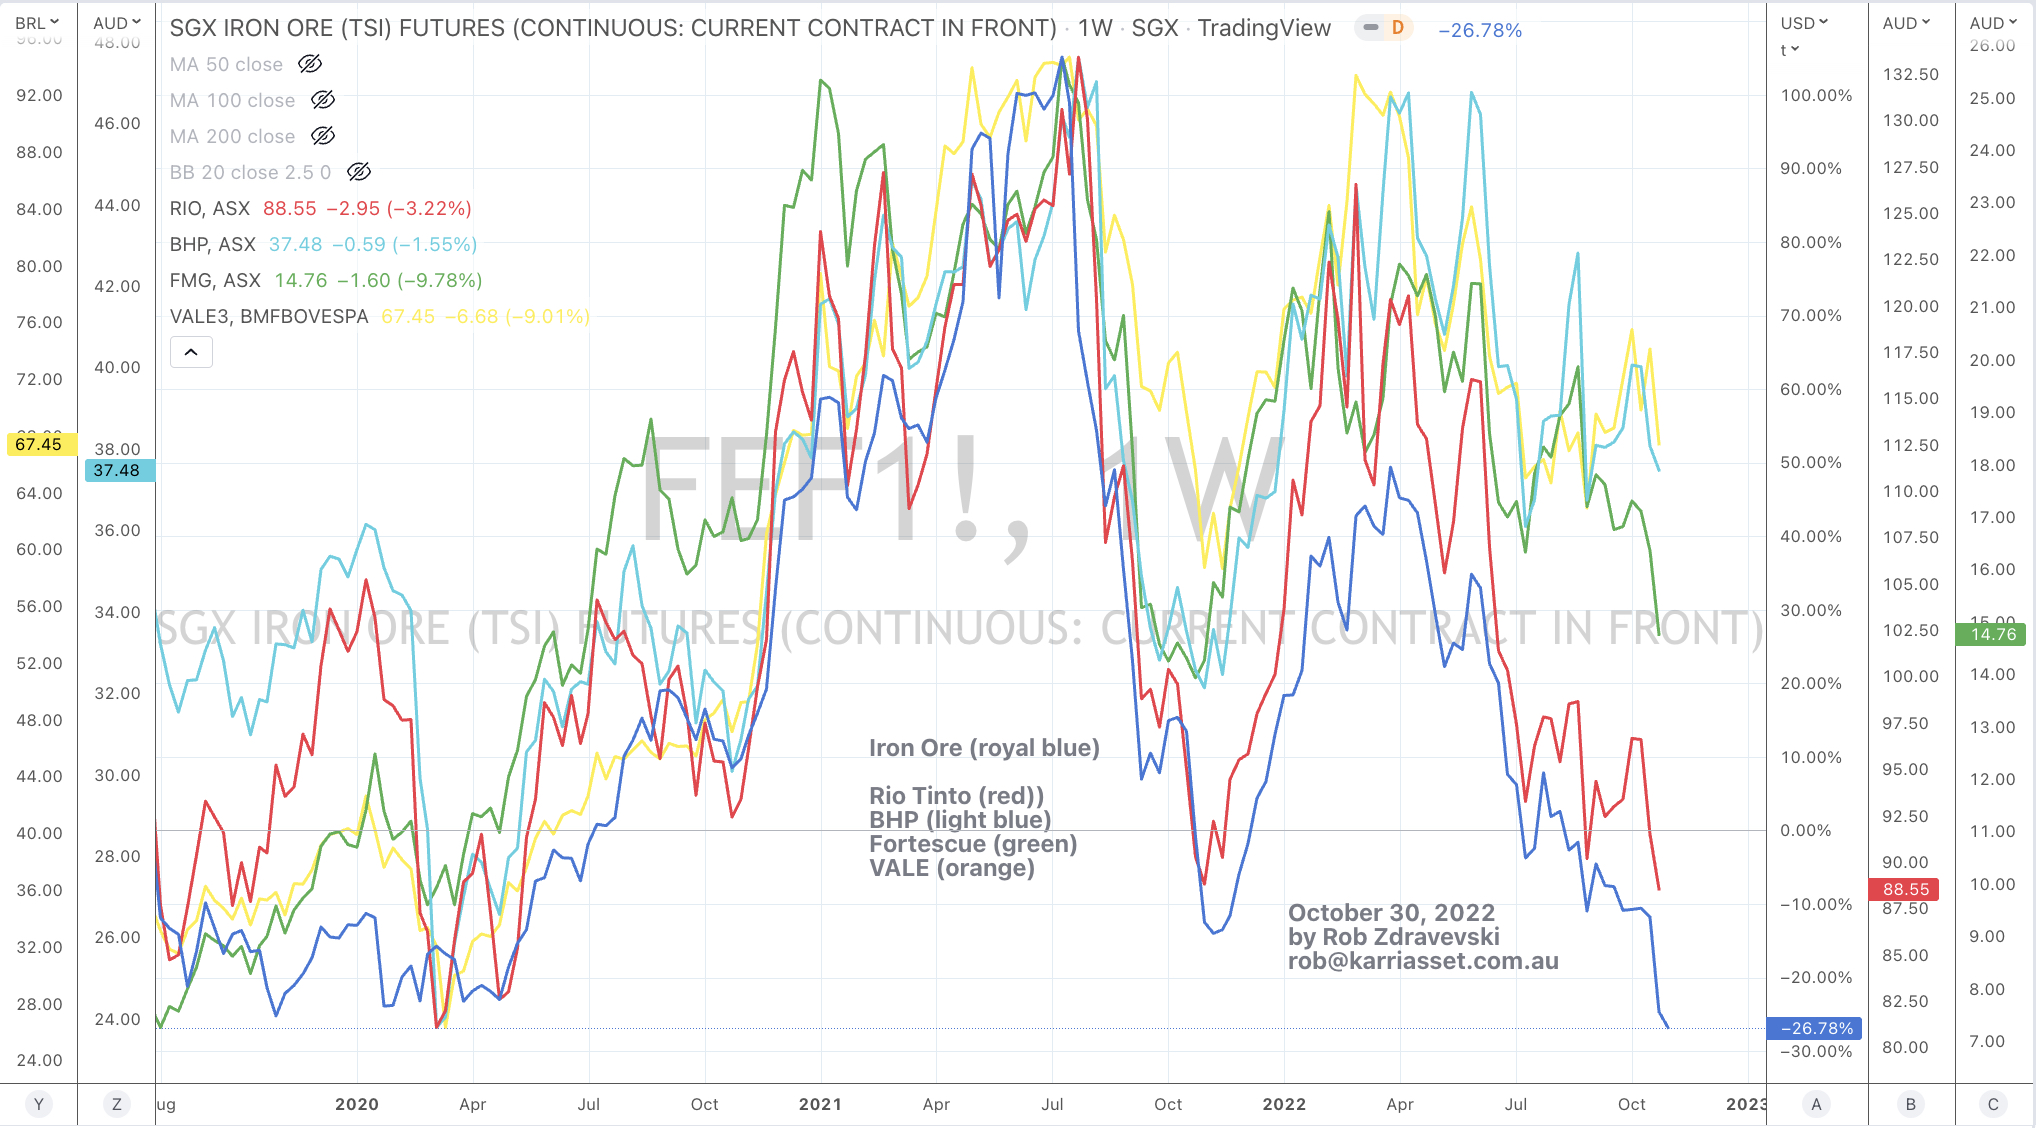
Iron Ore, Cotton and Hong Kong/Chinese equities are no longer at ‘extremes’. They bounced from their recent oversold levels. The Hang Seng index rose 9% for the week.

Other examples of prices bouncing off their recent extreme lows include the KOSPI rising 8.5% over the past 5 weeks and the U.K.’s FTSE 100 is up 6.7% in 3 weeks.

If you made 7% in a month, would you be tempted to close the books and take the next 11 months off?

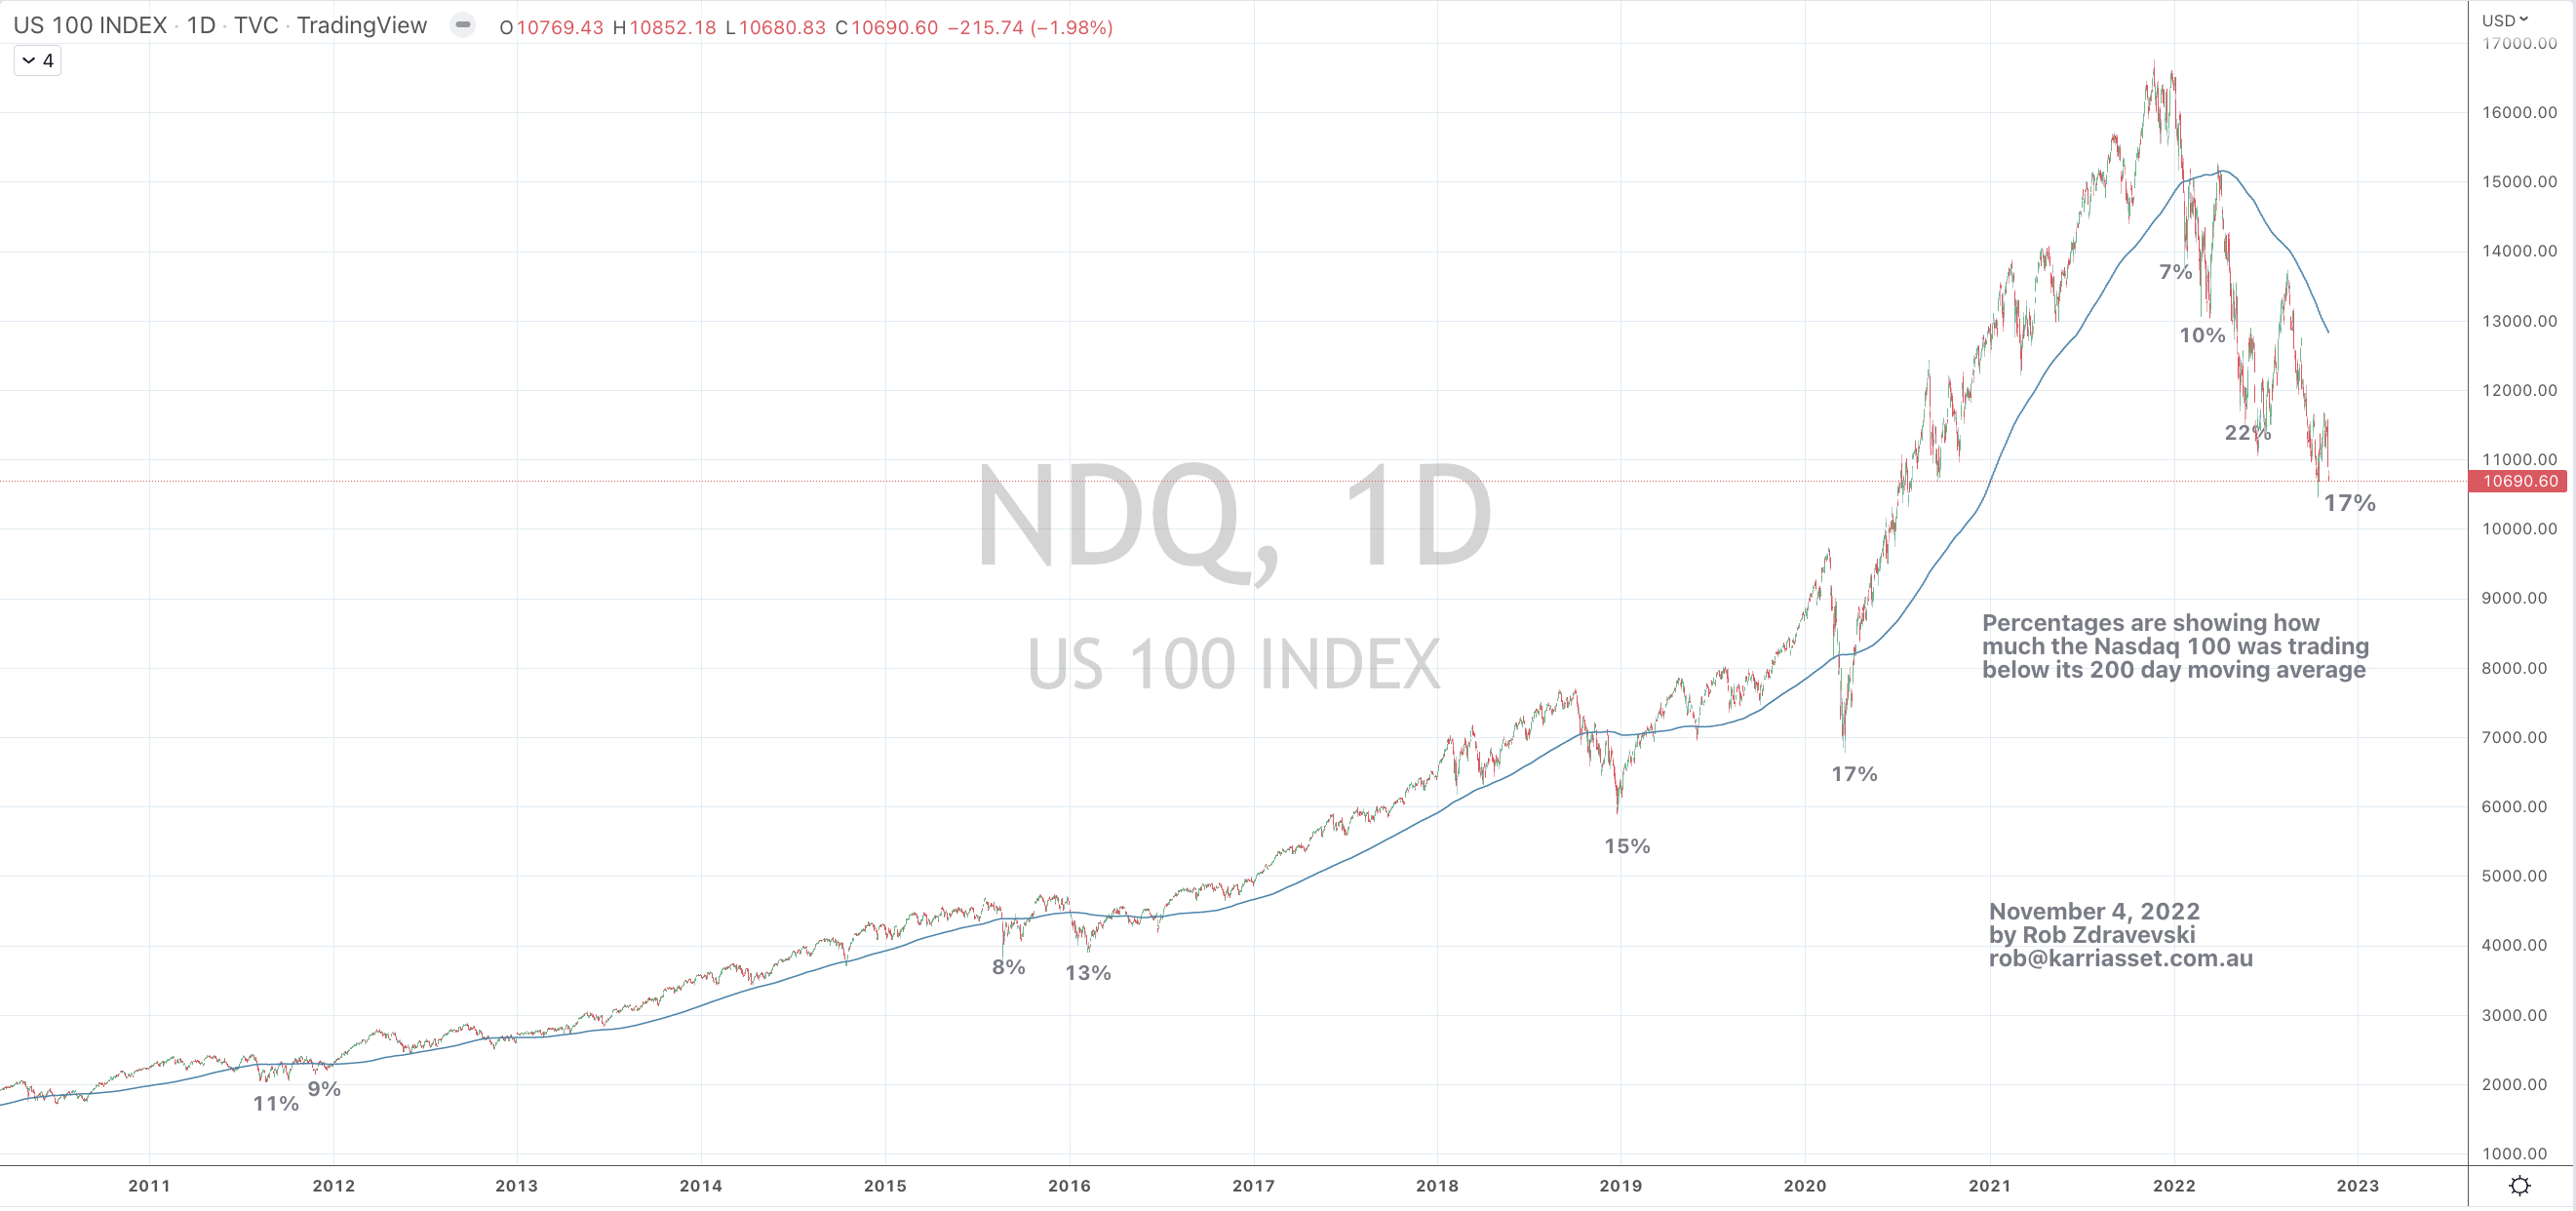
The U.S. equity markets seemed to give off a feeling that they had a positive week, when the opposite occurred.

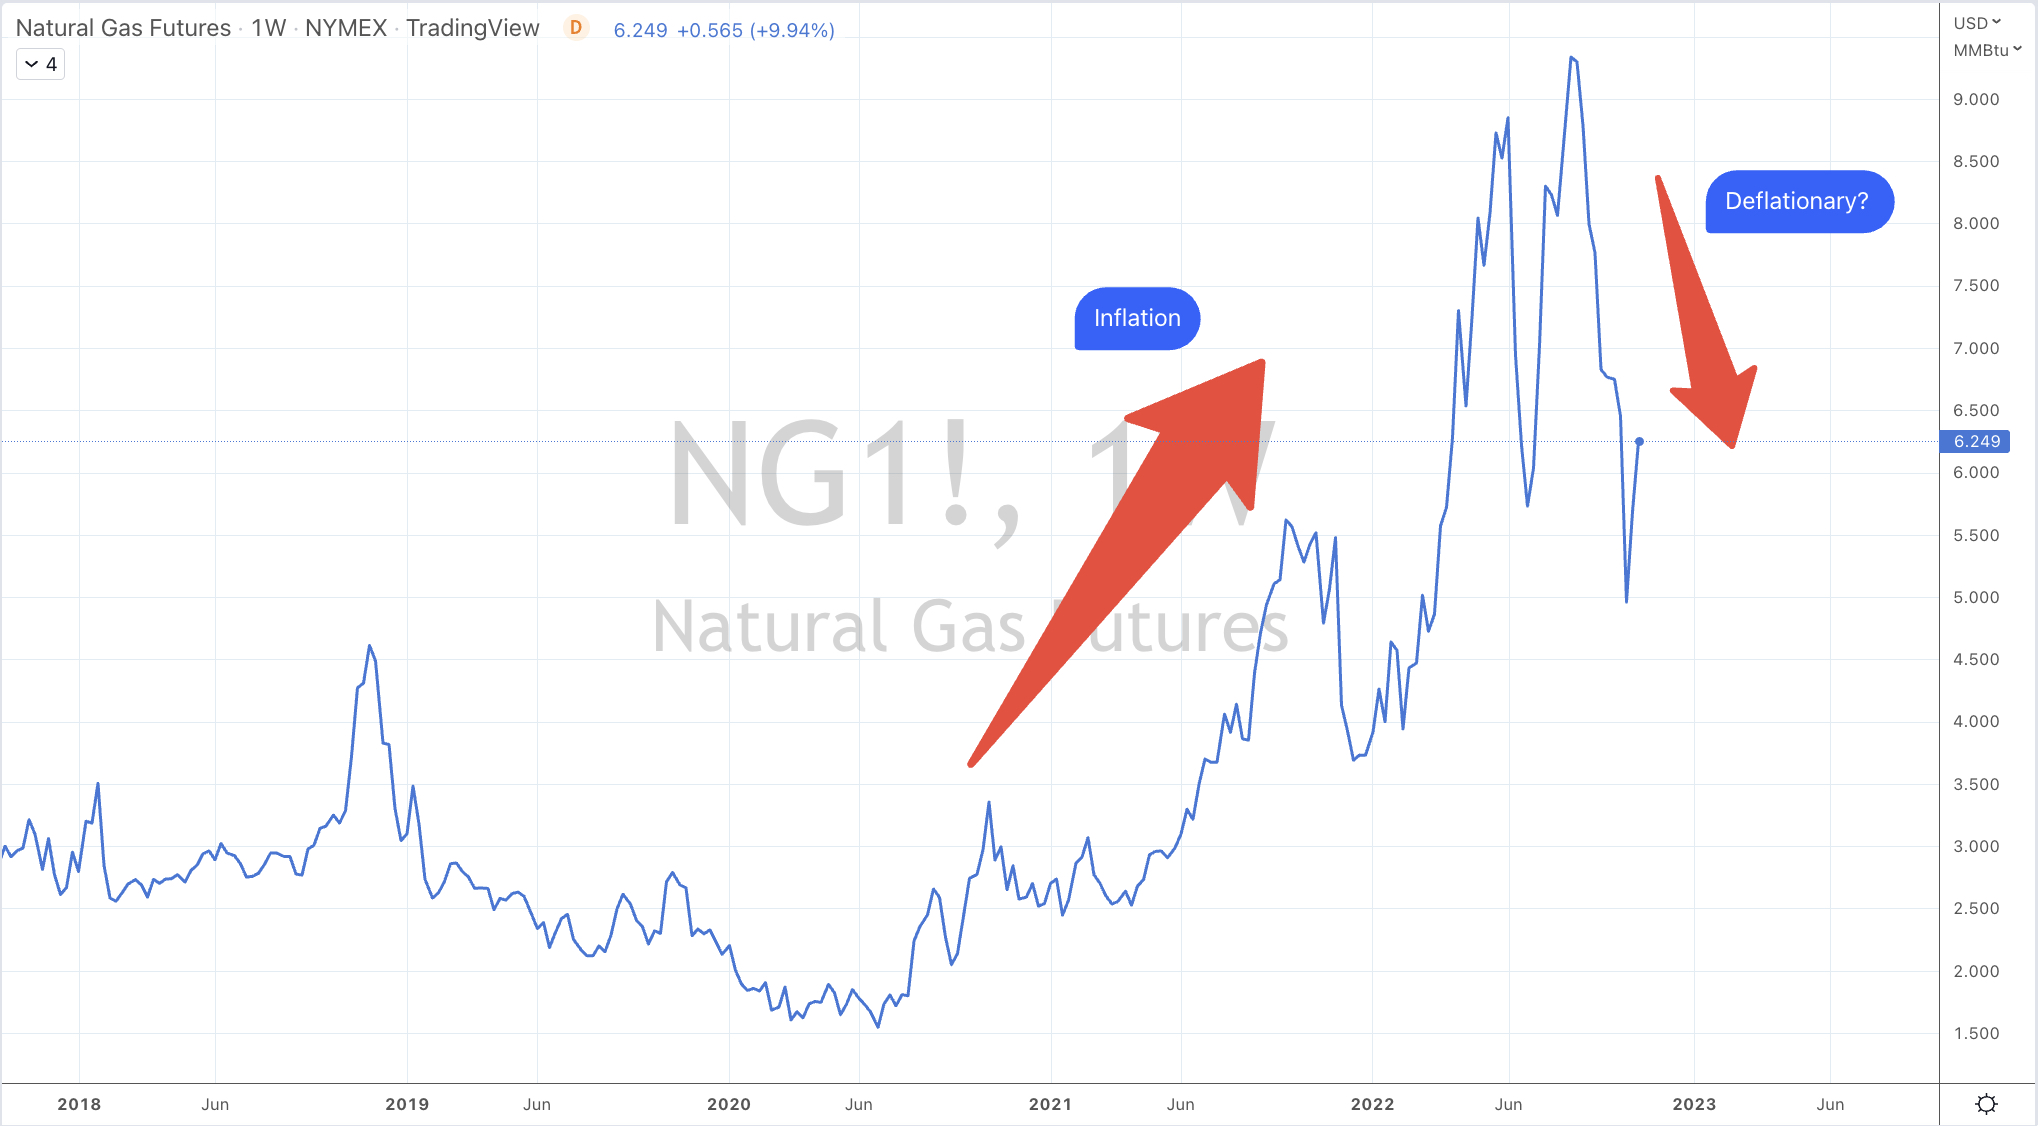
In addition to this week’s list of notable movers, over the past fortnight, Natural Gas has soared 27%, Silver is up 14% and WTI Crude has risen 9%.

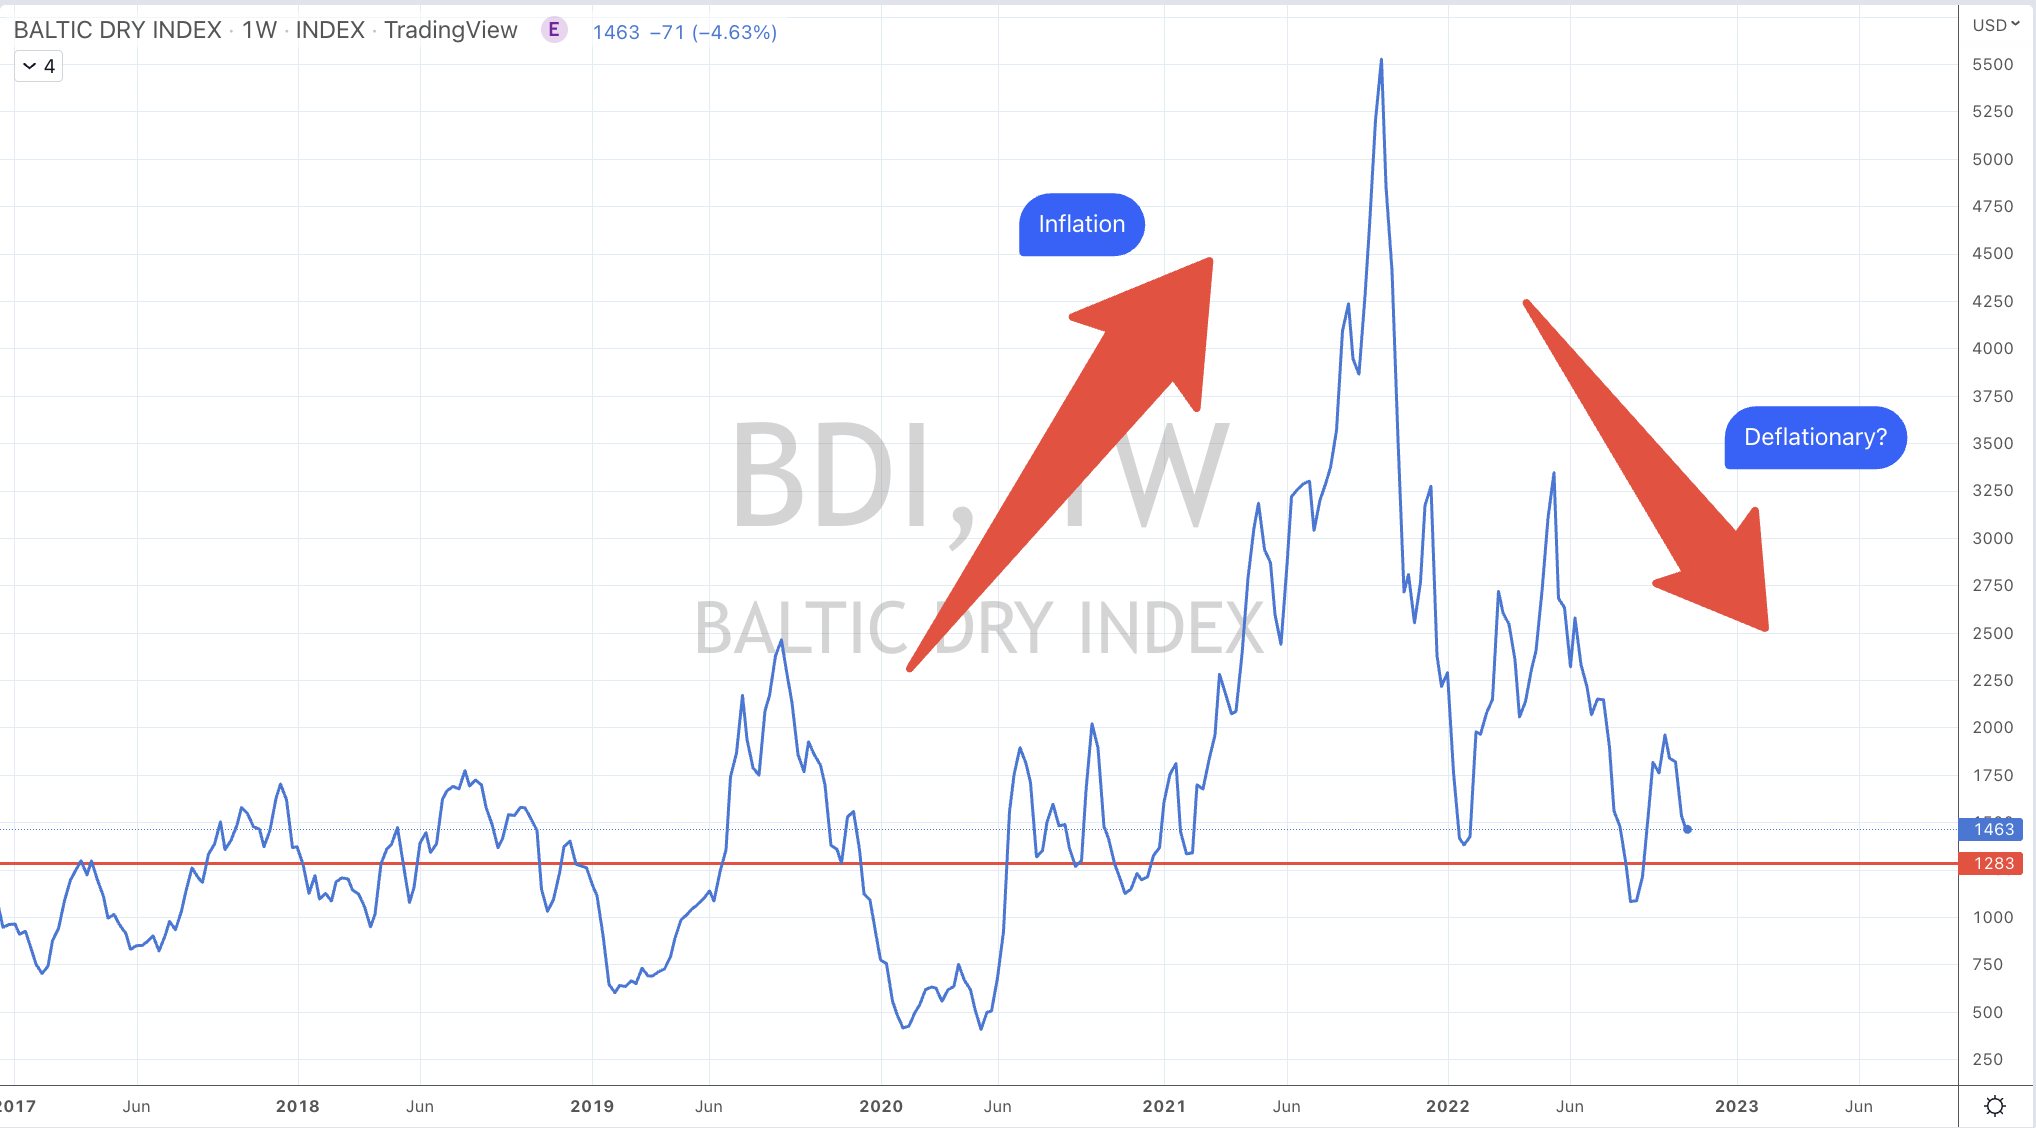
On the downside over the last fortnight, Hot Rolled Coil Steel has eased 11%, Rotterdam Coal has fallen 21% and the Baltic Dry Index has tanked 29%.

And don’t let the news headlines fool you. Even with wheat being blockaded from leaving Ukraine, the price of Wheat is flat over the past 2 weeks. 

The larger advancers over the past week comprised of;

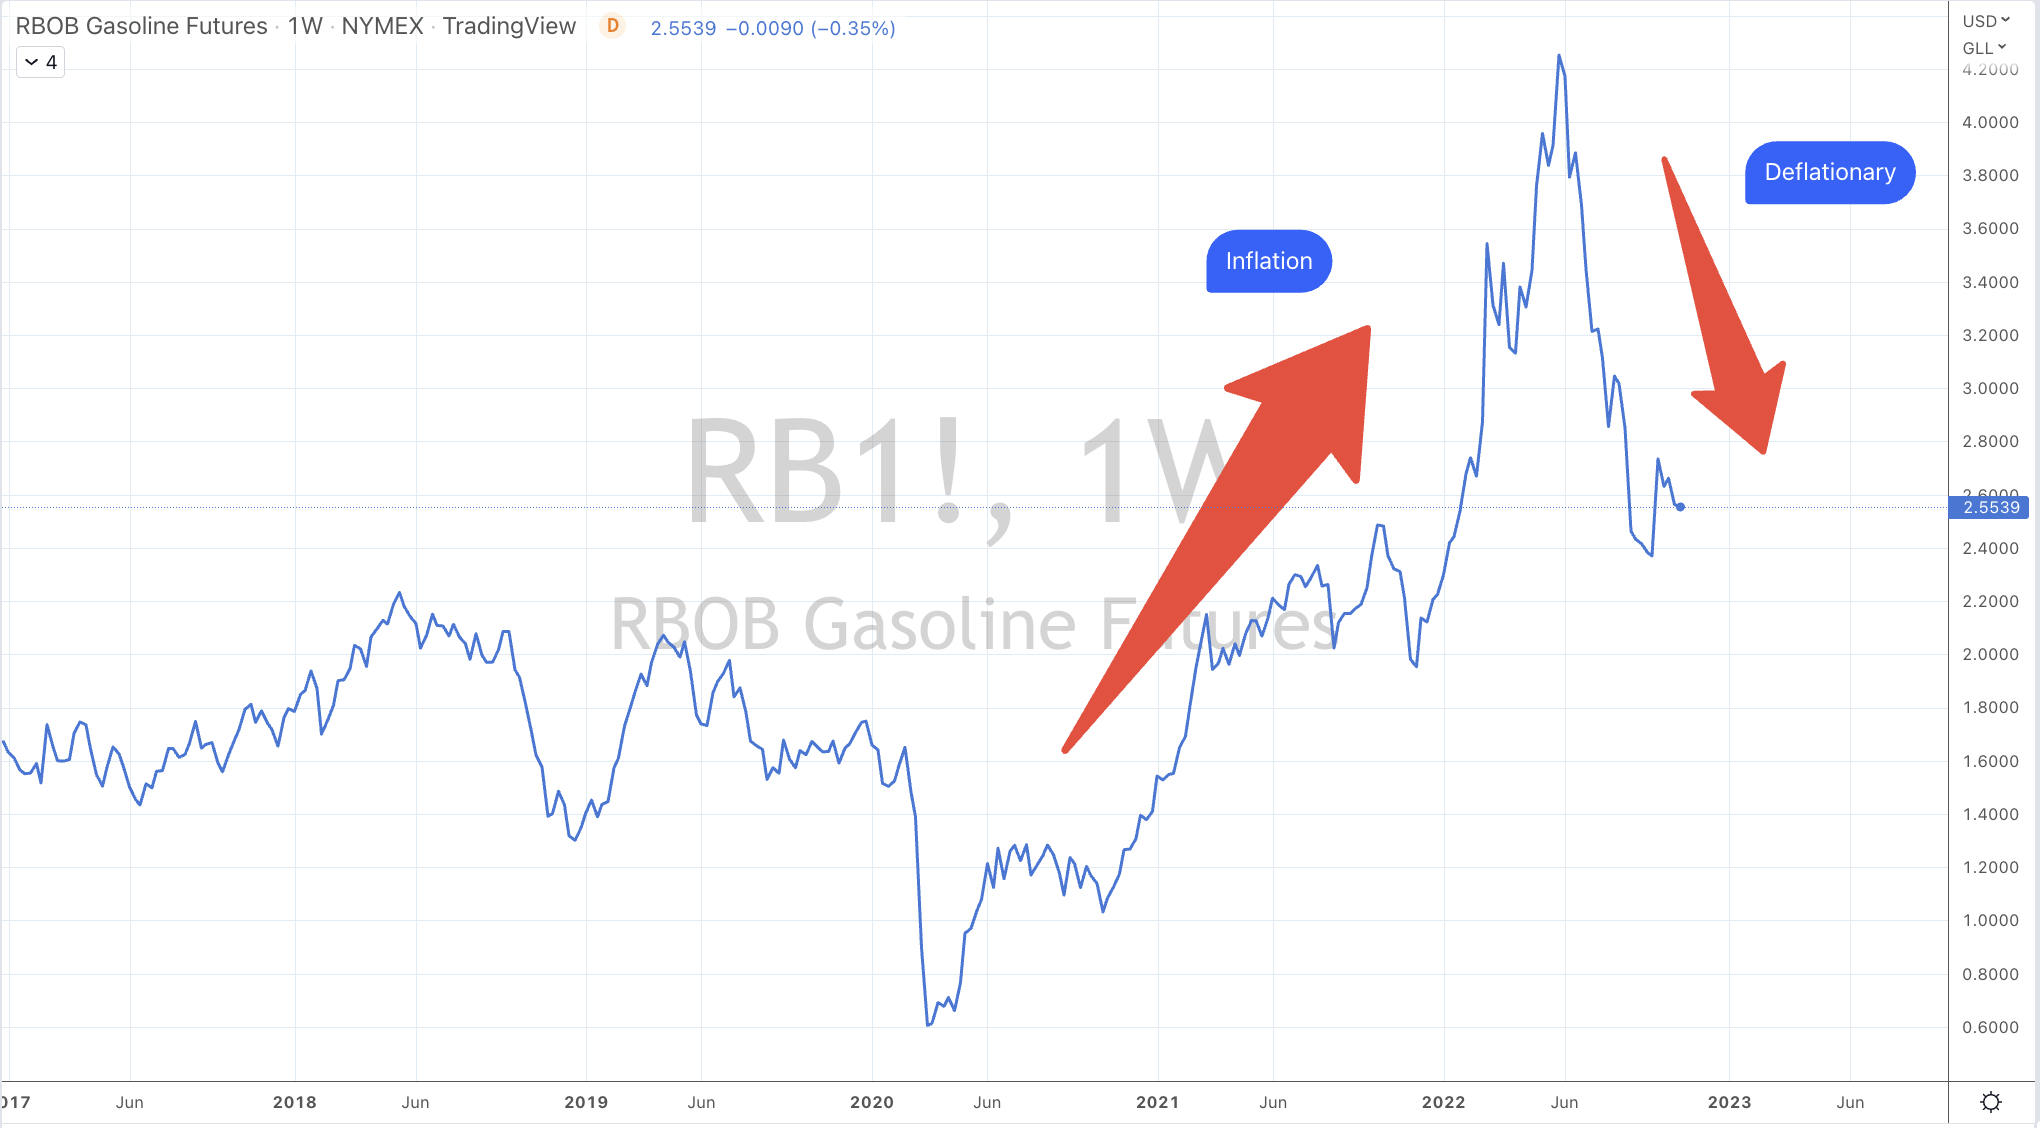
Aluminium 7.7%, Bloomberg Commodity Index 5.1%, Cocoa 5.7%,  WTI Crude 5.4%, Copper 7.5%, Copper/Gold Ratio 5.5%, Coffee 3.5%, Natural Gas 12.6%, Nickel 6%, Orange Juice 6.3%, Gasoline 6.7%, Sugar 3.4%, Silver 8.3%, CRB Index 5.5%, Cotton 20.6%, Brent Crude 4.7%, Urea Middle East 6.8%, Silver in AUD 7.3%, Gold 2.2%, Oats 6.6%, Rice 7.2%, Soybeans 4.4%, Wheat 2.2%, S&P GSCI 4.6%, Shanghai Composite 5.3%, KBW Banking Index 0.7%, CAC 2.3%, CSI 300 6.4%, DAX 1.6%, MIB 3.3%, HSCEI 9%, Hang Seng Index 8.7%,  BOVESPA 3.2%, KOSPI 3.5%, Oslo 3%, Helsinki 2.5%, Sensex 1.7%, Straits Times 2.3%, TAIEX 1.9%, FTSE 4.1%, Istanbul 8% and Australia’s ASX 200 rose 1.6%, for the 2nd consecutive week.

The group of decliners included;

Rotterdam Coal (10%), Baltic Dry Index (13.8%), China Coal (5.7%), Lean Hogs (3.6%), Hot Rolled Coil Steel (HRC) (4.5%), Heating Oil (14%), JKM LNG Gas (4.1%), Lumber (4.4%), Tin (3.4%), Palladium (3%), Dutch TTF Gas (17.6%), Uranium (3.2%), DJ Industrials (1.4%), DJ Transports  (0.7%), S&P MidCap 400 (1.2%), Nasdaq 100 (6%), Russell 2000 (2.6%), SOX (1.5%), S&P 500 (3.4%), S&P SmallCap 600 (2.1%) and the Nasdaq Composite fell 5.7% 

November 6, 2022

by Rob Zdravevski

rob@karriasset.com.au

Another tale of being in the last decile

This chart revisits the percentages which the Nasdaq 100 was trading below its 200 day moving average.

Today, that percentage is at 17%.

It’s kinda towards the bottom end of recent history.

I find this study useful when I combine it with other contrarian data to decide my weighting allocation towards equities.

The most extreme percentages seen during 2022, 2008 and 2009 were between 31% & 40% below the Nasdaq 100’s 200 day moving average.

Is the current market environment today different to those times?

Well, it is because the cost of capital is rising at a larger quantum than ever seen.

In 2001/2002 it was a re-adjustment of frothy valuations.

In 2009/2009, it was a systemic banking crisis.

November 4, 2022

by Rob Zdravevski

rob@karriasset.com.au

Where has the labour gone?

3 million people are Door Dashers.

They average earning $26 per hour.

Depending which U.S. state you may work in, that is much better than the $10-$14 minimum wage.

I learned (in today’s quarterly earnings call) that 90% of Door Dashers work less than 10 hours per week.

This adds up to a lot of people if I extrapolate that across those who ‘host’ or clean AirBnB properties, drive for ride sharing companies, life coaches or any type of freelancer, who are not in ‘traditional’ work force.

After all, why would you work 40 hours per week doing a job that you don’t like and are required to answer to a boss or superior, when you can earn 60% of what you normally would, while working 70% less hours than your ‘previous’ life.

One example is where a local yoga teacher conducts an hour long session at a nearby park, charging $15 and 30 people show up.

$450 on Saturday and $450 on Sunday.

2 hours work

Cash.

Why would you want to wipe down restaurant tables and deal with customers?

Listening to the quarterly calls or reading the transcripts) of the ‘gig’ related companies may provide clues to when the labour market eases.

I think a good recession will fix the tight labour market.

Perhaps people working in the “gig’ economy may then start to reconsider flexibility and lumpy income for steadier climes and company health insurance?

Especially, if mortgage repayment stress rears its head.

November 4, 2022

by Rob Zdravevski

rob@karriasset.com.au

The numbers always prevail beyond the theme

Vestas (the Denmark headquartered maker of wind turbines) holds a lot of inventory on its books.

It’s equal to 35% of it market capitalisation or 45% of its annual revenue.

This helps explain why its stock price has been struggling.

It seems it either has some discounting ahead or is relying on a raft of orders to move that stock out.

On a positive note, Vestas has ample stock available for buyers looking to secure supply immediately.

While investors may like the renewable energy theme or a host of other ‘hot’ topics, the price being paid for that stock always matters.

I always remind myself that in the absence of value, price is questioned.

if you don’t think this is the case, then water never finds its true level.

November 3, 2022

by Rob Zdravevski

rob@karriasset.com.au

Today’s prices look deflationary

Due to secular underinvestment and the resulting tightness in various industries, I think inflation will stay at levels higher than we’ve been accustomed over the past 25 years.

This is the ‘new’ calculation and consideration for the next decade or so.

However, in the nearer term, I do think they will abate from the current levels of 7%, 8% or 9% being seen today.

If I’m pressed for a figure, let’s say 4% or 5%.

If pundits could cite and prove today’s inflation rate is a result of the rising prices seen across a host of commodities, shelter, groceries, services, etc……why are we (collectively) not acknowledging that falling prices may temper inflation?

Keep in mind that official inflation rates report the prices seen yesterday.

I have collated various charts showing prices rising and since falling.

Remember all of that palaver about soaring Lumber and Steel prices?

Take a look at them now.

This is part of my argument that inflation has ‘peaked’ and so have government bond yields.

I mean, I think we are in the last decile or so.

Other parts of my argument for lower prices in various assets/commodities and a subsequent abatement of inflation has been a combination of my long-term mean reversion thesis along with my written notes about the factor and velocity of interest rate hikes.

The last holdout in price declines remains in various energy prices such as Diesel and Heating Oil.

Interestingly, Crude Oil prices have only fallen 30% from their peak, they are now trading at prices last seen in 2011 – 2013, when U.S. inflation, at that time was being reported between 1.5% – 3%.

Back then, we weren’t making an overall ‘hoo-ha’ that inflation was about to scream higher.

Obviously there is more to this analysis and many variables from renewed supply chain disruptions coupled with continued tighter labour markets and pent-up demand when China fully reemerges from COVID lock-down could thwart this thesis.

Not assigning reasonable probability that these falling prices may/will contribute to lower inflation reports in coming quarters is something that may catch investors or the market, out.

The result of abating inflation will have an affect on suffering longer duration assets, the strong U.S. Dollar and interest rates, which have risen between 11-14 fold from their mid-2020 lows.

Once (if) that happens, then we move onto figuring out where inflation and prices move to from that moment.

November 1, 2022

by Rob Zdravevski

rob@karriasset.com.au

Government Confiscation

Not by who’d we normally suspect.

It’s being done by the United States government.

(Civil) forfeiture has been part of Biden’s business since he has been a senator when the introduced the Comprehensive Forfeiture Act in 1983.

The U.S. can confiscate assets of Russian nationals. (up to $30 billion at last count)

They can tell American and semiconductor companies abroad to stop doing business with Chinese corporations.

A new report from the Attorney General’s office proposes the ability to seize cryptocurrencies which doesn’t require a conviction or even criminal charges to be filed.

Now they want (to seize some of the) profits from oil companies.

‘Zero emissions Biden’ wants Big Oil to produce more of the stuff while he is draining the Strategic Petroleum Reserve and when they don’t acquiesce to his production requests, he now ostracises them and wants part of their profits.

You can’t make this stuff up !

Exxon’s $18 billion profit from this past quarter must be salivating to the Fed’s seeing that they have sent $17 billion in ‘aid’ to Ukraine.

After all, the U.S. could have tempered the risk of Russia invading Ukraine except Mr Blinken triggered something when he said that NATO entry to Ukraine is always open.

Through confiscation, they may be able to cover the estimated $300 billion (over the next decade) cost of student debt foregiveness.

They have confiscated land from families to be used for U.S./Mexico border wall construction.

Look up ’eminent domain’.

There are many more examples of domestic and international confiscation that been conducted, let alone corporate standovers.

Beyond this being a political observation and comment, within it lies investing ideas and opportunities.

If you are a Chinese national who owns real estate in California, Seattle or Vancouver, one may consider selling and moving your money back to (a cheaper and beneficially weaker) Chinese Yuan.

They may find better asset protection in their own country rather than anywhere else.

Should an Indian national who owns assets in United Kingdom become nervous should his government buy much more oil from Russia?

Incidentally, the Swiss have been freezing Russian assets.

The (neutral) Swiss !!

Putting xenophobia aside, I can understand the suggestion for U.S. exchanges to delist Chinese companies for not being transparent about their audit and their books……but the U.S. can’t even manage to have a former President present his tax returns.

The bully in the room has been gaslighting many to believe that ‘others’ are the oppressors when it’s actually them.

All of this and they can’t manage to confiscate guns?

Votes !

Happy mid-term elections everyone.

November 1, 2022

by Rob Zdravevski

rob@karriasset.com.au

Macro Extremes (week ending October 28, 2022)

The following assets (on a weekly timeframe) registered an Overbought or Oversold reading and/or have traded more than 2.5 standard deviations above or below its rolling mean.

Extremes “above” the Mean (at least 2.5 standard deviations)

Orange Juice

U.S. 10 year minus German 10 year bond yields

Overbought (RSI > 70)

Cattle

U.S. 2, 5, 10 and 20 year government bond yields

German 2 year government bond yields

U.S. 5-7 year corporate bond yields

U.S. 10 year minus Australian 10 year bond yields

The Overbought Quinella – Both Overbought and Traded at > 2.5 standard deviations above the weekly mean)

TBT

U.S. 30 year government bond yields

Extremes “below” the Mean (at least 2.5 standard deviations)

Coffee

Shanghai Composite

Oversold (RSI < 30)

Tin

Hot Rolled Coil Steel (HRC)

Cotton

Iron Ore

IEI & TLT

CSI 300 Index

Hang Seng & HSCEI Indices

Taiwan’s TAIEX index

KRW/USD

CNH/USD

JPY/USD

INR/USD

IDR/USD

The Oversold Quinella – Both Overbought and Traded at > 2.5 standard deviations above the weekly mean)

None

Notes & Ideas:

There have been many changes from last week’s list especially within the currency and bond markets.

New additions to this weeks list include some eclectic bond spreads.

The big news this past week was the stellar advance in equity markets. Individually, they warrant attention and trend analysis. For example, Spain’s IBEX market has risen 10% over the past 2 weeks.

In other observations, I’m watching if indices such as the DJ Industrials and Transports make ‘higher highs’.

Weekly extremes in the AUD and CAD are no longer oversold.

The USD (DXY) is not overbought.

Many government bond yields fell notably during the week telling us bonds were ‘catching a bid’.

The 10 year bond yields of Australia, Canada, Switzerland, Spain, France, the UK, Italy and other…are not overbought, following a few weeks of appearing as so.

The German 2 and 5 year yields aren’t overbought anymore, while the U.S. listed bond IEF isn’t oversold.

The interest rate differential between the U.S. 10 year and Australian 10 year bond yields hit an overbought level (on my usual weekly basis measure) not seen since May 2019.

And finally, I want to remind and emphasise the height of the noise seen in British 10 year Gilts a few weeks ago, when yields touched 4.63%. They are now 3.50%.

A 25% move in 3 weeks is quite something, within a few weeks.

When bonds were being thrown away and sold by spooked by investors tuned in to the ‘temporary’ noise, they did so, at the wrong time.

This weekly publication is designed to highlight when pendulums are at the extremes points of their arcs.

The rest of the week’s notable movers are below.

The larger advancers over the past week comprised of;

Australian Coking Coal 8.9%, WTI Crude 3.4%, Gasoil 7.9%, Heating Oil 18.7%, Cattle 1.7%, Natural gas 14.6%, Dutch TTF Gas 22.7%, S&P GSCI 1.8%, AEX 2.3%, KBW Banks 5.9%, CAC 3.9%, DAX 4%, DJ Industrials 5.7%, DJ Transports 7%, MIB 4.5%, IBEX 4.9%, KOSPI 2.5%, S&P Midcap 400 5.3%, Nasdaq 100 2.1%, Oslo 2.9%, Copenhagen 5.1%, Stockholm 3.8%, Russell 2000 6%, SMI 3.4%, SOX 4.2%, S&P Midcap 5.3%, S&P 500 4%, STI 3%, TSX 3.2%, S&P SmallCap 600 6.1%, Nasdaq Biotech 6.8%, Nasdaq Composite 2.2% and Australia’s ASX 200 rose 1.6%.

The group of decliners included;

Rotterdam Coal (11.1%), Baltic Dry Index (15.7%), China Coal (9.2%), Iron Ore (2.8%), Lean Hogs (3.4%), Hot Rolled Coil Steel (HRC) (6.8%), JKM LNG Gas (7.1%), Coffee (11.1%), Lumber (14.8%), Tin (4.2%), Nickel (3.2%), Palladium (5.4%), Gasoline (3.7%), Sugar (4.4%), Cotton (8.9%), Florida Gulf Urea (9.6%), Middle East Urea (8.3%), Oats (2.6%), Wheat (2.5%), Shanghai Composite (4.1%), Hang Seng Index (8.3%), HSCEI (8.9%) and Brazil’s BOVESPA fell 4.5%

October 30, 2022

By Rob Zdravevski

rob@karriasset.com.au   

Who is China’s preferred supplier of Iron Ore?

Here is a chart comparing the stock prices of Iron Ore’s Big 4 to the 62% grade Iron Ore price.

Rio Tinto is cuddling more sympathetically to iron ore’s recent decline.

Fortescue is next.

BHP less so.

VALE being the least.

The percentages that these stock prices are tracking Iron Ore’s price may be a representation of each company’s mine localities, corporate domicile, national allegiance or perhaps ‘politics’.

It may be a the market’s interpretation of who China may see as their preferred supplier?

October 30, 2022

by Rob Zdravevski

rob@karriasset.com.au