Another tale of being in the last decile
November 4, 2022 Leave a comment
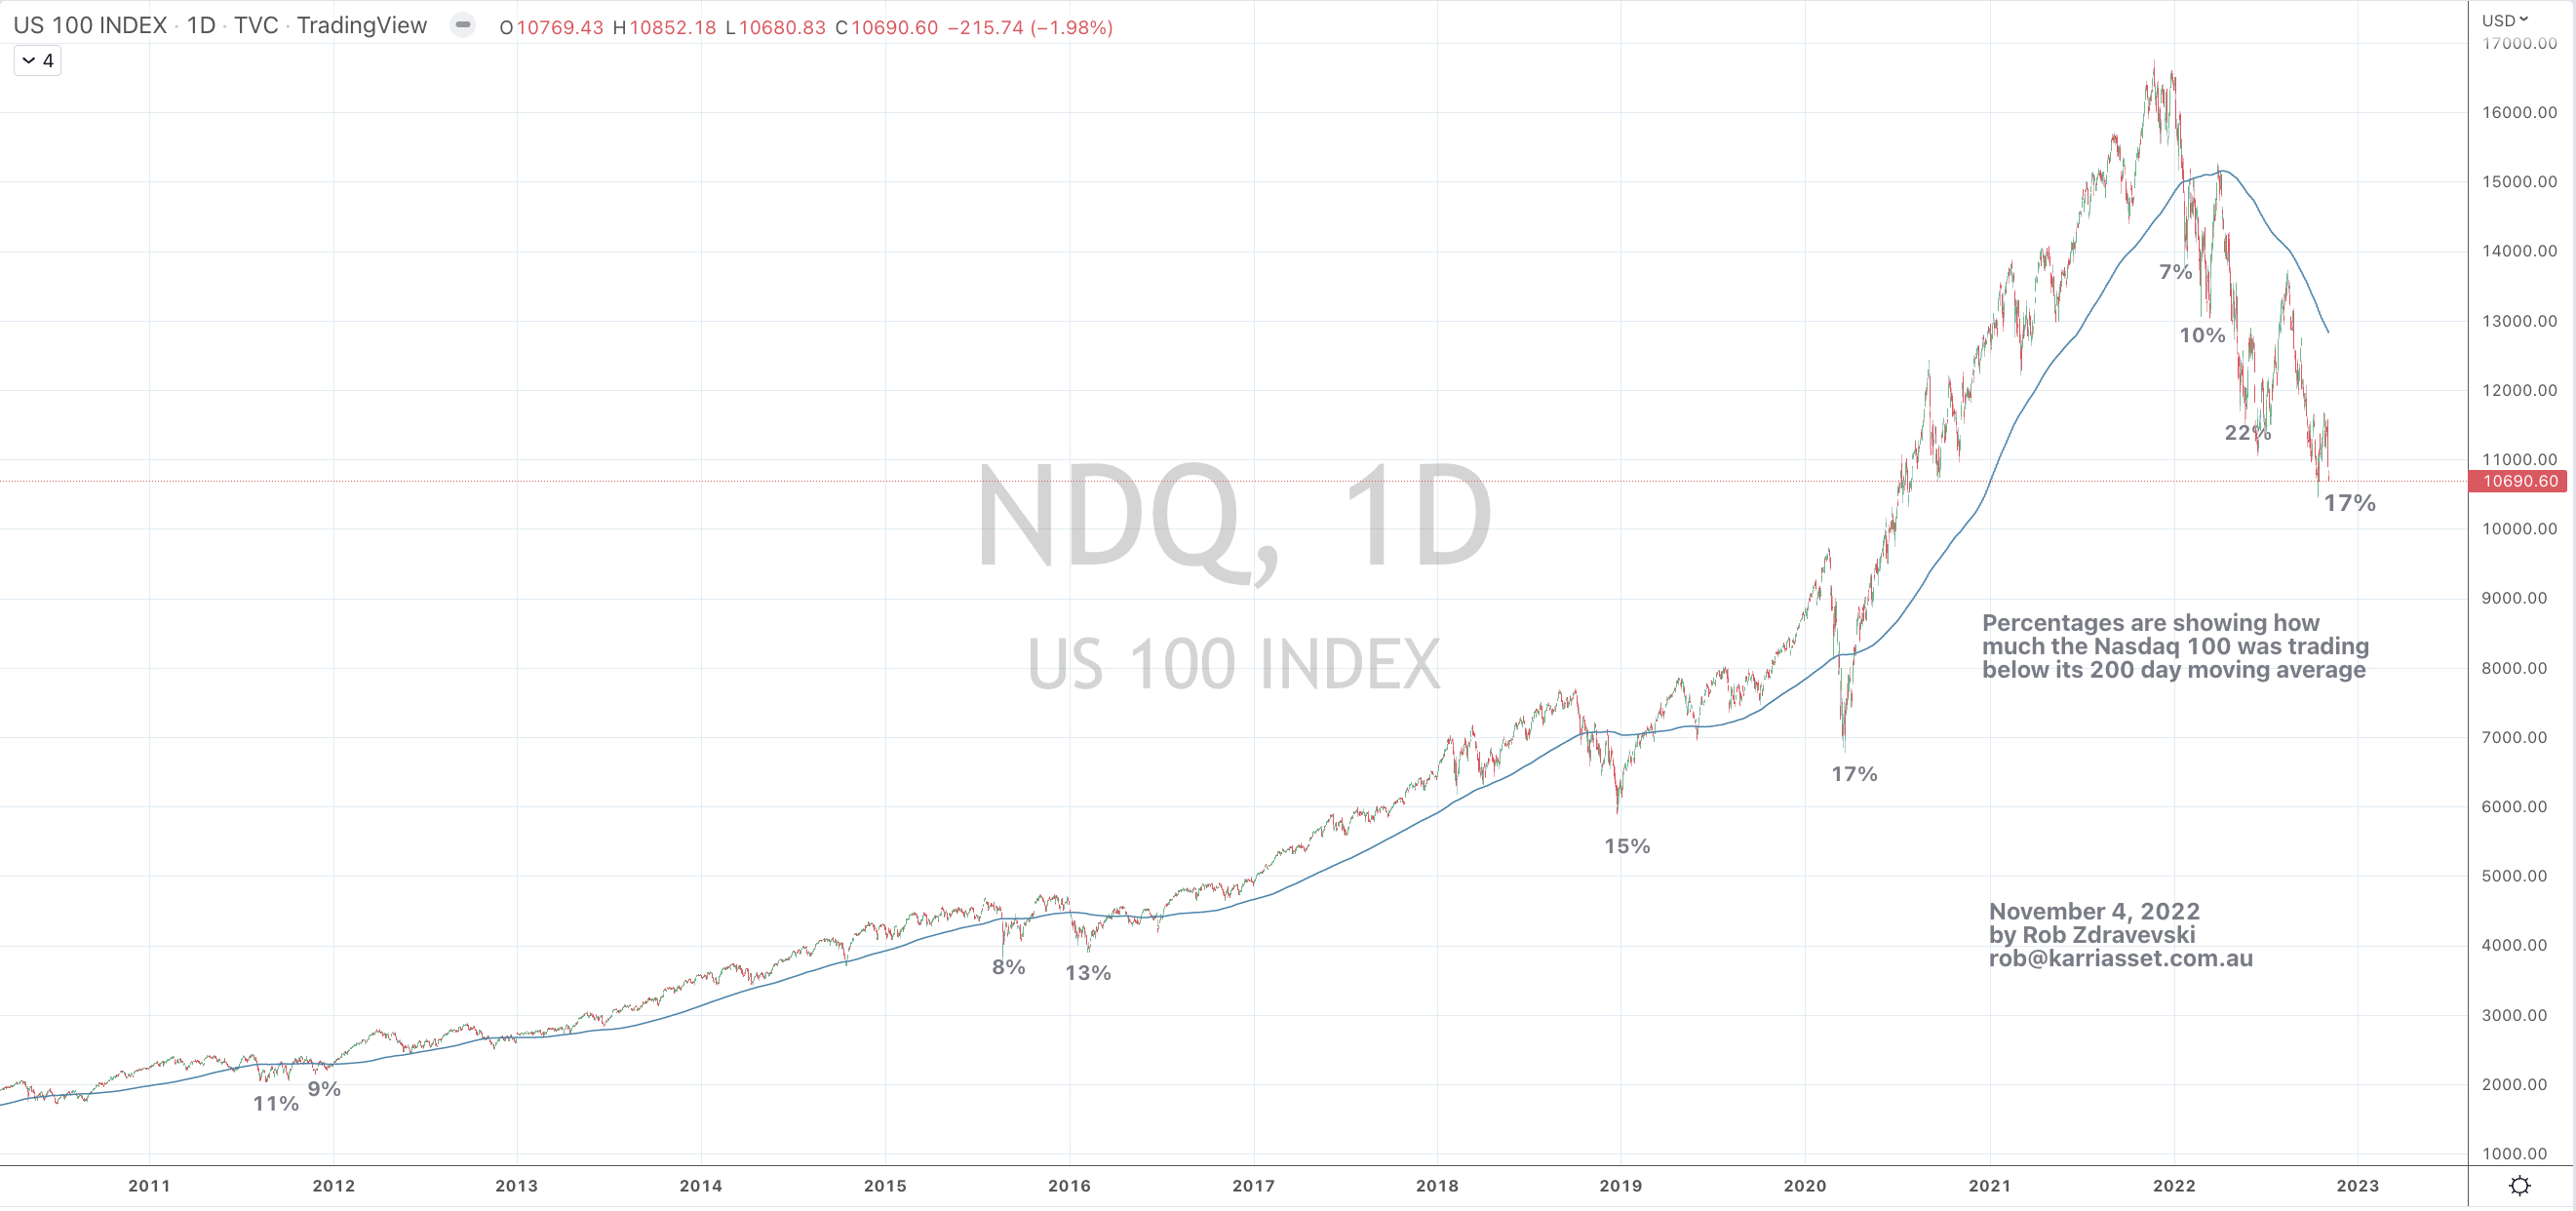
This chart revisits the percentages which the Nasdaq 100 was trading below its 200 day moving average.
Today, that percentage is at 17%.
It’s kinda towards the bottom end of recent history.
I find this study useful when I combine it with other contrarian data to decide my weighting allocation towards equities.
The most extreme percentages seen during 2022, 2008 and 2009 were between 31% & 40% below the Nasdaq 100’s 200 day moving average.
Is the current market environment today different to those times?
Well, it is because the cost of capital is rising at a larger quantum than ever seen.
In 2001/2002 it was a re-adjustment of frothy valuations.
In 2009/2009, it was a systemic banking crisis.
November 4, 2022
by Rob Zdravevski
rob@karriasset.com.au