Lower bond yields ahead?

With all the connotations and effects that come with bond buyers prevailing as the more aggressive, I see bond yields declining into the next year.

The figures in the chart below denote the percentage that the U.S. 2 year government bond yield is trading above its 50 month moving average.

Obviously, taking a larger view and trying to get the bigger call correct.

Allowing for convergence, I think this yield makes its way towards the 2.75% region in 12 months time.

It’s currently 4.43%

February 7, 2023

by Rob Zdravevski

rob@karriasset.com.au

Macro Extremes (week ending February 3, 2023)

A weekly Macro, Cross Asset review of prices trading at extremes which may generate future investment ideas and opportunities.

The following assets (on a weekly timeframe) registered an Overbought or Oversold reading and/or have traded more than 2.5 standard deviations above or below its rolling mean.

Extremes “above” the Mean (at least 2.5 standard deviations)

Chinese 10 year government bond yield

Australian Coking Coal 

Tin

Sugar

CSI 300

U.S. KBW Banking Index

Dow Jones Industrials

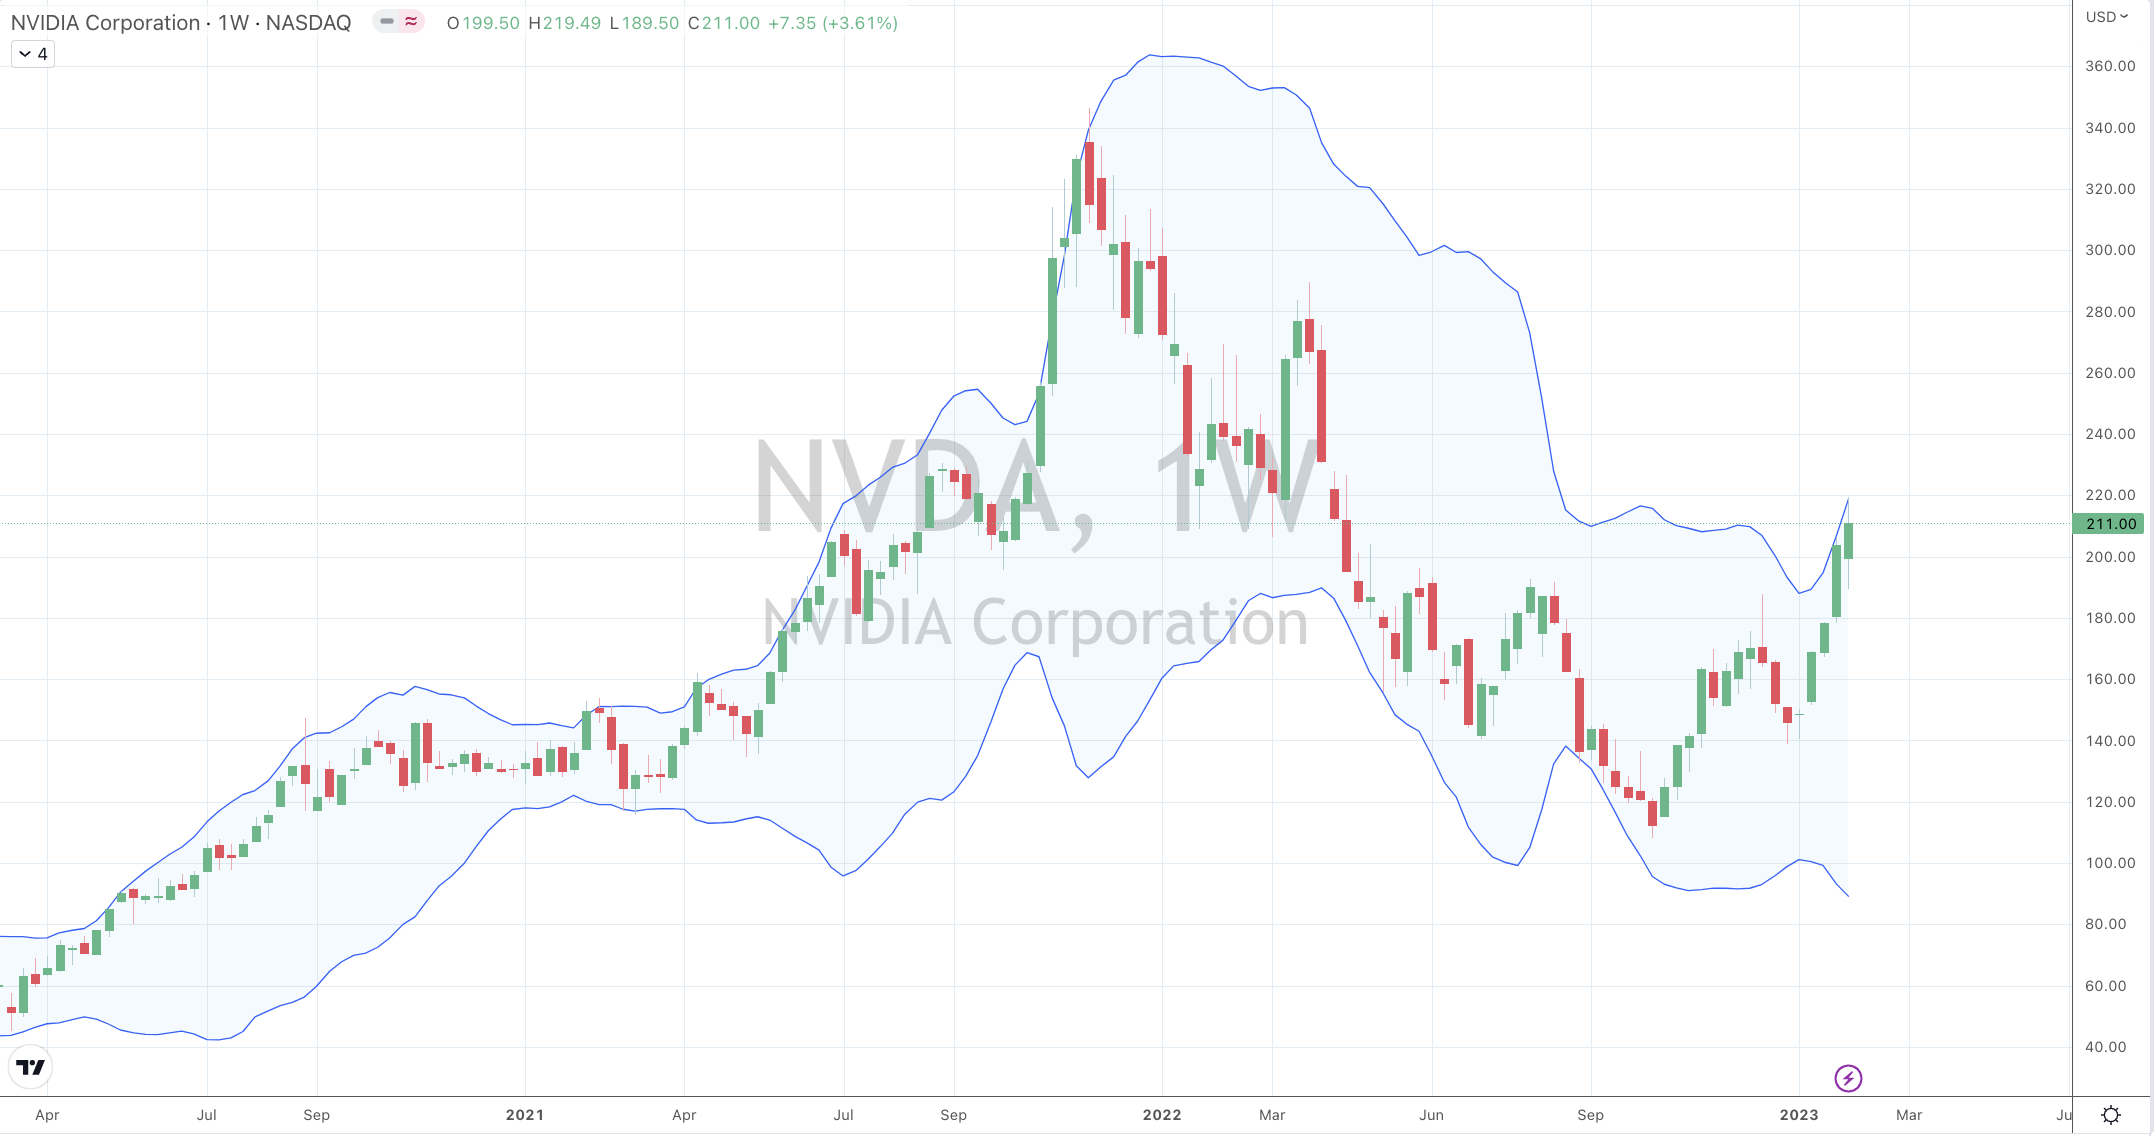
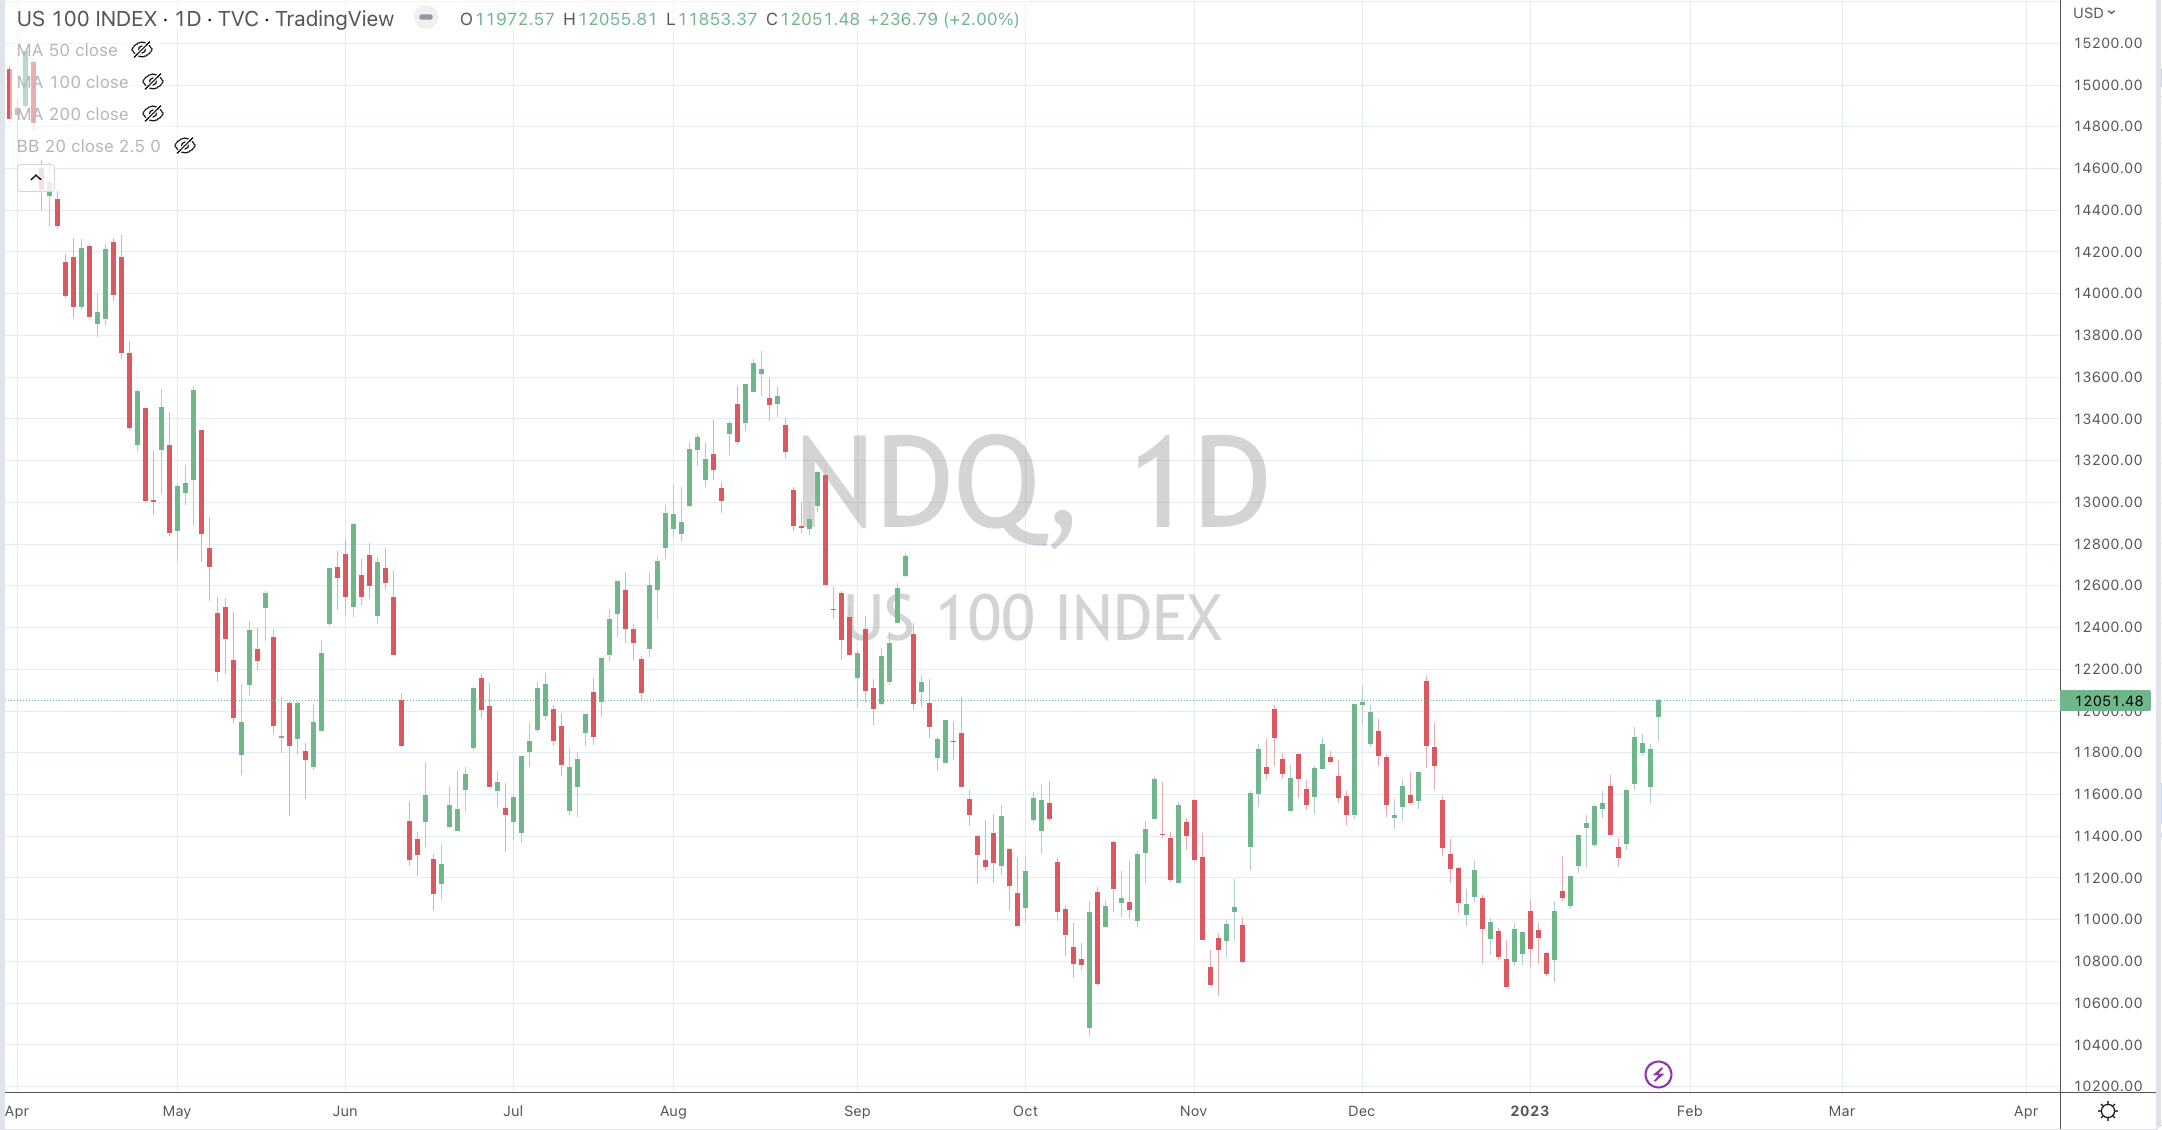
Nasdaq Composite and 100

Russell 2000

SOX

Overbought (RSI > 70)

German 2 year government bond yields

Cattle

CAC, DAX, MIB and IBEX equity indices

The Overbought Quinella – Both Overbought and Traded at > 2.5 standard deviations above the weekly mean)

Orange Juice

Extremes “below” the Mean (at least 2.5 standard deviations)

Bloomberg Commodity Index

USD/BRL

Oversold (RSI < 30)

U.S. 5 year yield minus U.S. 3 month bill yield spread

Natural Gas

Urea (U.S. Gulf) 

Urea (Middle East)

Baltic Dry Index

The Oversold Quinella – Both Overbought and Traded at > 2.5 standard deviations above the weekly mean)

None

Notes & Ideas:

It’s a very interesting list of entries featured amongst the ‘extremes’.

We are seeing the return on equity indices and some commodities back into the list.

Amongst bonds, yields generally fell, especially along at the long end. It’s worth watching the bearish outside weeks that bond yields had, which adds to their case of edging lower.

Those bearish outside weeks were seen amongst Spanish, German, French, Greek, Italian, Korean and Portuguese 10’s.

While yields fell globally, that wasn’t the case in U.S. debt. 

As bond yield work or meander their way lower (toward their longer term means), it would inversely suggest that ‘tech stocks’ will continue to rally.

While some ‘tech’ indices are hitting Overbought extremes this past week, keep in mind that prices often stay ‘Overbought’ for a longer time than they stay ‘Oversold’.

And for cross referencing, bond yields aren’t commensurately nor correspondingly registering Oversold readings.

Indices such as the Nasdaq 100 can do much more ‘damage’ by rallying further but don’t confuse momentum with value.

In commodities, energy prices resume/continue to fall along with precious metals. The latter would be a surprise to many. 

The Japan Korea LNG Marker (JKM) touched its lowest price since September 7th, 2021.

Natural Gas saw its 7th consecutive losing week and simultaneously touched Oversold extremes…..

JKM, Platinum, Dutch TTF Gas, Brent Crude and Rotterdam delivered Coal continue to edge their way lower towards their 200 week moving average.

Shipping Rates weakened further. The Baltic Dry Index is now Oversold and has slumped 81% in the past 5 weeks.

Following this week’s declines, last week’s Overbought Gold entries are no longer so.

While Orange Juice was the massive upwards mover for the week with current prices now suggesting a Sell signal for speculators and producers.

In currencies, the AUD was down 2% against everyone, everywhere.

In equities, we mainly saw U.S. indices pop into Overbought territory with some major Europeans also mimicking.

Although it is worthy to note that the Dow Jones Industrials fell 0.2% for the week, the Nasdaq Biotech Index declined 1% while Toronto’s TSX and the ASX 200 rose 0.2% and 0.9% respectively.

And last week, I prompted thought about the odds of an extended rally in Chinese equites. This past week, Chinese equity indices were the noticeable losers.

Lastly, this past week saw ‘outside bearish reversal weeks’ in Cocoa, Silver in USD, Gold in USD and in the AUD/USD.

The larger advancers over the past week comprised of;

Australian Coking Coal 9.8%, Hot Rolled Coil Steel 2.8%, Cattle 2.3%, Orange Juice 17.5%, Dutch TTF Gas 4.4%, AEX 1.8%, KBW Banking Index 2.2%, CAC 1.9%, DAX 2.2%, DJ Transports 7.2%, MIB 2%, IBEX 1.8%, Nasdaq Composite 3.3%, S&P MidCap 400 3.4%, Nasdaq 100 3.3%, Copenhagen 4.5%, Stockholm 4.4%, Russell 2000 3.9%, Sensex 2.6%, S&P SmallCap 600 5.2%, SOX 4.7%, S&P 500 1.6%, TAIEX 4.5%, FTSE 100 1.8% and Argentina’s MERVAL rose 5.1%.

The group of decliners included;

Aluminium (3.4%), Bloomberg Commodity Index (4.1%), Baltic Dry Index (8.1%), Cocoa (2.2%), China Coal (6.4%), WTI Crude (7.9%), Gasoil (12.7%), Copper (3.9%), Heating Oil (15%), JKM LNG (5%), Tin (4.4%), Natural Gas (15.4%), Platinum (3.6%), Gasoline (10.5%), Urea U.S. Gulf (4.1%), Brent Crude (7.3%), Silver AUD (2.7%), Silver (5.3%), Gold (3.2%), Gold in CAD (2.6%), Rice (3.1%), AUD/USD (2.6%), HSCEI (5%), HSI (4.5%), BOVESPA (3.4%) and Istanbul’s BIST fell 3.7%.

February 5, 2023

by Rob Zdravevski

rob@karriasset.com.au 

Sell signal – Nvidia (NVDA)

In late 2021 and early 2022, I wrote often about the peak in the equity prices of semiconductor companies.

Then this note on October 11, 2022 (only 4 months ago) suggested a pending low in those related stocks.

Specifically, I wrote that I was looking for a low in the price of Nvidia stock between $105 – $108 as a buying point.

The next day, it traded to a low of $108.13…..

This week, it was time to get out again.

The intra-week high of $219.49 told me that the ‘fat part of the trade’ has been seen or had.

This call is still valid at the most recent closing price of $211.

Beyond my various reasonings suggesting a current peak……a 102% advance in 4 months should satisfy most {sic} all.

Or put another way, as stellar as the return is, this is a ‘get out of jail free’ card for many, while for anyone who bought this stock before October 2021 remains underwater.

If it’s not a current peak, I am definitely not a buyer of Nvidia with ‘new money’ at the prevailing prices.

The same goes for the SOX (the Philadelphia Semiconductor Index)

February 5, 2023

by Rob Zdravevski

rob@karriasset.com.au

Decline in Natural Gas complete

That’s your lot.

A round trip move for Natural Gas, rom $2.50 to $10 and back to $2.50 all within 22 months.

Regarding my short call from $10.00 to my target of $2.50 was reached today.

That’s your lot.

The fat part of the trade has been had.

The mean reversion from those heights back to and below its 200 week moving average also corrected that parabola seen a year earlier.

It’s now Oversold on a weekly basis.

February 2, 2023

by Rob Zdravevski

rob@karriasset.com.au

Wait for cheaper Corn (and Oil)

The price of Corn looks like going lower again.

My work suggests ‘new longs’ should be careful and wait for a decisive break higher and if so, it’ll be a momentum trade.

For producers needing cashflow, it’s prudent to lock in the current price $6.80 being offered.

For buyers, you should get some cheaper prices soon.

$5.80 comes to mind.

And something to ponder is how the price of Corn goes, so does Oil’s.

February 1, 2023

by Rob Zdravevski

rob@karriasset.com.au

Watching Higher Highs – Nasdaq and Occidental

To compliment recent posts about the S&P 400 MidCap Index and Rio Tinto, here are the price charts of the Nasdaq 100 and Occidental Petroleum.

Just something to watch if the market gives us conviction or the possibility of an extension, following some consolidation over the past few months.

January 31, 2023

by Rob Zdravevski

rob@karriasset.com.au

Higher Highs – Rio Tinto

I did the notations on this chart of Rio Tinto (RIO.AX) a few days ago.

That higher high of $128.55 is still something to watch for.

This is theorem and observation is valid for many asset prices amongst the current rally.

I’m watching for exhaustion, volume and whether ‘higher highs’ are made in order to assess any extension of this advance…..

but this stock (and others) are touching Overbought levels and there are ‘gaps’ lurking below.

January 31, 2023

by Rob Zdravevski

rob@karriasset.com.au

Macro Extremes (week ending January 27, 2023)

A weekly Macro, Cross Asset review of prices trading at extremes which may generate future investment ideas and opportunities.

The following assets (on a weekly timeframe) registered an Overbought or Oversold reading and/or have traded more than 2.5 standard deviations above or below its rolling mean.

Extremes “above” the Mean (at least 2.5 standard deviations)

None

Overbought (RSI > 70)

German 2 year government bond yields

Gold (in Canadian Dollars)

Gold (in U.S. Dollars)

Cattle

SGD/USD

The Overbought Quinella – Both Overbought and Traded at > 2.5 standard deviations above the weekly mean)

None

Extremes “below” the Mean (at least 2.5 standard deviations)

None

Oversold (RSI < 30)

U.S. 5 year yield minus U.S. 3 month bill yield spread

Natural Gas

Urea (U.S. Gulf) 

Urea (Middle East)

USD/SGD

The Oversold Quinella – Both Overbought and Traded at > 2.5 standard deviations above the weekly mean)

None

Notes & Ideas:

Turkey’s BIST Index is no longer Overbought. This is worth a mention because this stock index tripled in value over the past 12 months.

Global Equities resumed their rally.

As a recent blog post of mine said, “market wants to rally….and so the herd starts agreeing the same….and more and more will believe that it wants to rally…..and so it rallies until the last momentum holdout joins in……the antithesis is to sell on ‘up days’ before they become ‘down days’”

Last week, I highlighted the bullish cries amongst market pundits aimed at Chinese equities. They continued to rally this week, although caveat emptor is advised when observing the near-term pendulum. 

Commodities generally had a benign week with many prices posting ‘inside weeks’.

Other notable price action was seen in those commodities who have or are close to reverting back to their 200 week moving average or being Oversold….such as Rotterdam Coal, Urea, Dutch TTF Gas ($2 from its 200 WMA), Lean Hogs, Natural Gas (in its 6th consecutive down week) and the Baltic Dry Index, which I’m looking for a swoon towards $520.

The Baltic Dry Index continues its slump. It has now slumped 73% in the past 4 weeks.

And Palladium closed at its lowest level since March 23, 2021.

In currencies, the general news is that the USD continues to weaken (back towards its long-term mean) and all of those currencies (JPY, KRW, CLP, DKK) which were Oversold several weeks ago against the USD are now much stronger.

The AUD/CAD is nearing an Overbought reading, in fact the AUD was up 2% against everything for the week.

EUR/USD is nearing Overbought levels and has now risen 13% from its pessimistic early October 2022 lows.

Bonds had a quiet week considering the past 6 or so weeks. 

Yields generally reversed their declining streaks, which we were in line with last weeks comments.

The larger advancers over the past week comprised of;

Cocoa 2.3%, China Coal 2.5%, Hot Rolled Coiled Steel 8.4%, Coffee 9.8%, Lumber 14.3%, Sugar 6.3%, Uranium 3.5%, Oats 4.7%, Shanghai 2.2%, CSI 300 2.6%, KBW Banking Index 4.7%, Nasdaq 4.7%, DJ Industrials 1.8%, MIB 2.6%, HSCEI 3.9%, HSI 2.9%, Nasdaq Composite 4.3%, KOSPI 3.7%, S&P MidCap 400 2.5%, Nasdaq 100 4.7%, Nikkei 225 3.1%, S&P Small Cap 600 2.1%, Russell 2000 2.4%, SOX 5.4%, S&P 500 2.5%, STI 3.1%, Toronto’s TSX 1% and Australia’s ASX 200 rose 0.6% while the ASX Small Cap Index improved 0.9%.

The group of decliners included;

Rotterdam Coal (19.2%), Baltic Dry Index (11.4%), WTI Crude Oil (2.4%), Gasohol (4.6%), Lean Hogs (2.5%), Heating Oil (5.8%), JKM LNG (14.5%), Natural Gas (10.2%), Palladium (7.2%), Platinum (3%), Gasoline (2%), Dutch TTF Gas (17.1%), Urea U.S. Gulf (12.2%), Brent Crude (1.8%), Urea Middle East (12.1%), Silver AUD (3.3%), Gold AUD (1.9%) and Copenhagen’s equity index fell 1.8% 

January 29, 2023

by Rob Zdravevski

rob@karriasset.com.au 

Danger lurks below

Tech stocks are finding a floor and catching a bid as bond yields fall….

or if you look at it inversely; when bond prices rise.

The chart below shows ServiceNow vs the 3-7 Bond ETF (IEI).

Whatever direction the bond price goes, so does this stock.

Try it on some others.

But it’s the same story as before.

Lower yields (see discount rate) is good for lowly or unprofitable companies who are more so relying on higher revenue guidance to buoy their equity prices.

For the time being, I’m identifying these rallies as momentum and potentially being fortuitous rather than under the guise value and trading genius.

Whilst I think bond yields have more downside over the coming year, I see increasing probability that they take a break from their current downward trend and move a little higher to shakeout the late comer buyers.

My work suggest that the risk/reward of being long ‘tech’ with new money at todays prices is marginal which I think resembles a bull trap.

There are also many ‘gaps’ below in many equity prices.

I’d rather search for ‘maximum pessimism’ or ‘capitulation’ before exhibiting the sort of confidence (or short term memory loss) that I’m seeing today.

In such a bond yield bounce that I anticipate and subsequent decline in tech stocks, I also sound a warning to those holding or ‘playing’ the long side of 2x and 3x technology related index and sector ETF’s.

More on that later.

January 27, 2023

by Rob Zdravevski

rob@karriasset.com.au

Middle Eastern Urea prices join the Oversold parade

Overnight’s stunning 12% decline in the Middle East FOB Urea price has seen it revert back to its 200 week moving average, as the chart below illustrates.

It also registered a Weekly Oversold reading which was last seen 3 years ago.

The other 2 charts included show how the prices of Wheat and the Japan Korea LNG Marker dance along with the Middle Eastern Urea price.

January 27, 2023

by Rob Zdravevski

rob@karriasset.com.au