A weekly Macro, Cross Asset review of prices trading at extremes which may generate future investment ideas and opportunities.
The following assets (on a weekly timeframe) either registered an Overbought or Oversold reading and/or have traded more than 2.5 standard deviations above or below its rolling mean.
Extremes “above” the Mean (at least 2.5 standard deviations
KLSE – the Kuala Lumper Stock Exchange
Overbought (RSI > 70)
Cocoa
Uranium
Iron Ore
And India’s NIFTY and SENSEX equity indices
The Overbought Quinella – Both Overbought and Traded at > 2.5 standard deviations above the weekly mean)
None
Extremes “below” the Mean (at least 2.5 standard deviations)
Rotterdam Coal
Oversold (RSI < 30)
Nickel on India’s MCX Exchange
Lithium Hydroxide
The Oversold Quinella – Both Oversold and Traded at < 2.5 standard deviations below the weekly mean)
None
Notes & Ideas:
Government bond yields rose except for the Chinese 10’s and the Japanese durations.
Probability implied such a rise when observing the many 5-9 weeks declining streaks in existence.
While you may have not placed a trade to sell any bonds at this juncture, this publication certainly suggested that one shouldn’t buy bonds at the recent ‘extremes’.
Swiss 10’s have strung a 3 week yield rally from 0.61% to 0.83%. The were oversold 4 weeks ago.
The yield in the Aussie 10’s saw its 5 week declining streak come to end.
And the South Korean 10’s broke their 10 week losing streak.
Equities were mostly lower except for there IBEX, Oslo, Helsinki, SMI, SET & Copenhagen.
The latter has put together a 10 week winning streak, while Thailand’s SET is in its 5 consecutive rising week.
The Nasdaq Biotechnology has quietly risen for 8 straight weeks.
Asian and U.S. were amongst the larger declining indices for the week.
In fact, the DJ Industrials, the Nasdaq Composite and the S&P 500 all broke (unsurprisingly, again) their consecutive winning streaks.
As did Mexico, Stockholm & Chile’s main equity indices.
Furthermore, the AEX, CAC, DAX, KOSPI, TAIEX and the ASX 200, all performed weekly outside bearish reversals.
And the SOX did not make a new all-time high this week, instead it fell 6%.
Commodities were mostly weaker, although the commodity indices were flat to slightly higher.
The strength in the energy contracts helped offset the larger declines seen in metals and grains.
Rotterdam Coal rose 8% erasing last week’s 8% decline.
Natural Gas rose significantly while Palladium, Oats and Soybeans tanked.
Hot Rolled Coil Steel isn’t overbought anymore nor is Platinum and Coffee.
The former broke its 11 week winning streak.
All 3 fell notably during the week.
Finally, Rice had a bullish outside reversal week which suggests a continuation of its upward trend.
Aluminium fell 5% after rising 14% over the previous 4 weeks.
Orange Juice rose breaking its 6 consecutive weeks of gains
And Sugar’s rose, ending its declining weekly at 8 weeks.
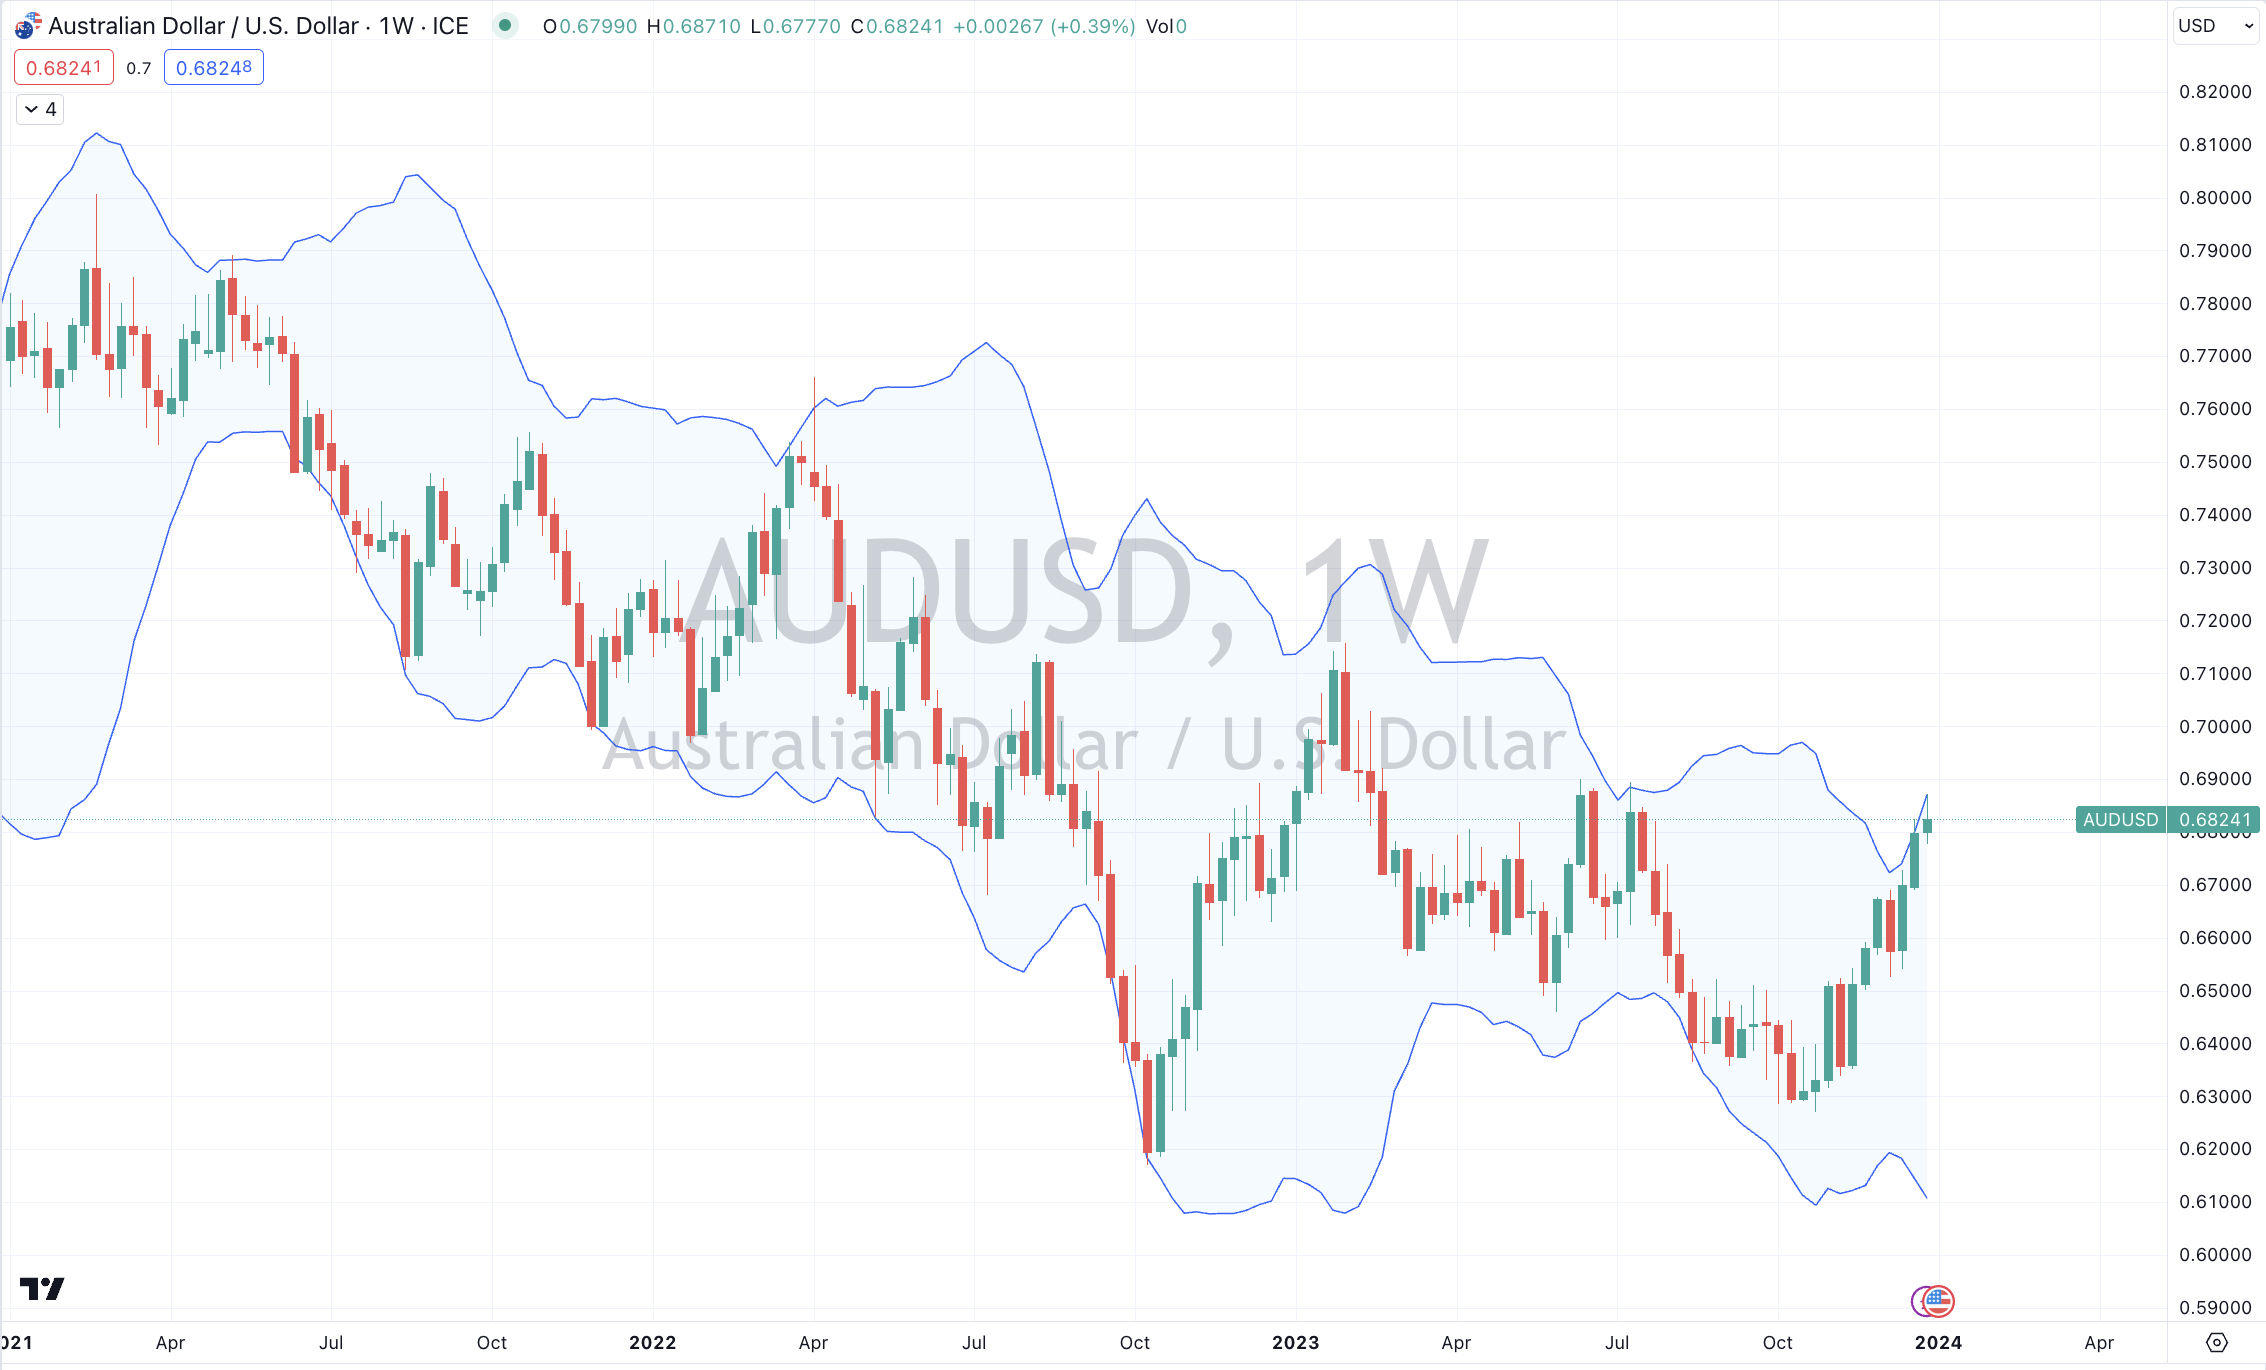
Amongst currencies, the USD rose strongly and it isn’t oversold this week.
No currencies are in any extreme territory this week and its easiest to reference last weeks edition to see which ones appeared as so.
The GBP was strong, the Euro was mixed and the Yen was weaker.
The AUD was weaker everywhere except against the Yen.
There were big moves in FX this past week, with many moving 1% or more.
For example, the SEK fell 1.7% versus the USD while the Yen fell 2.5% against the USD.
And the AUD/EUR had an outside weekly bearish reversal.
The larger advancers over the past week comprised of;
Australian Coking Coal 1.9%, Rotterdam Coal 7.8%, China Coking Coal 1.9%, WTI Crude 3.7%, Lean Hogs 2.3%, Heating Oil 2.5%, Cattle and Lumber rose 1.3%, Natural Gas 15.1%, Orange Juice 2.5%, Sugar 2.6%, S&P GSCI 1.1%, Dutch TTF Gas 6.8%, Brent Crude 2.3%, Gasoil 2%, KLSE 2.3%, MOEX 2%, Copenhagen 1.5% and Turkiye’s BIST 100 rose 2.1%.
The group of largest decliners from the week included;
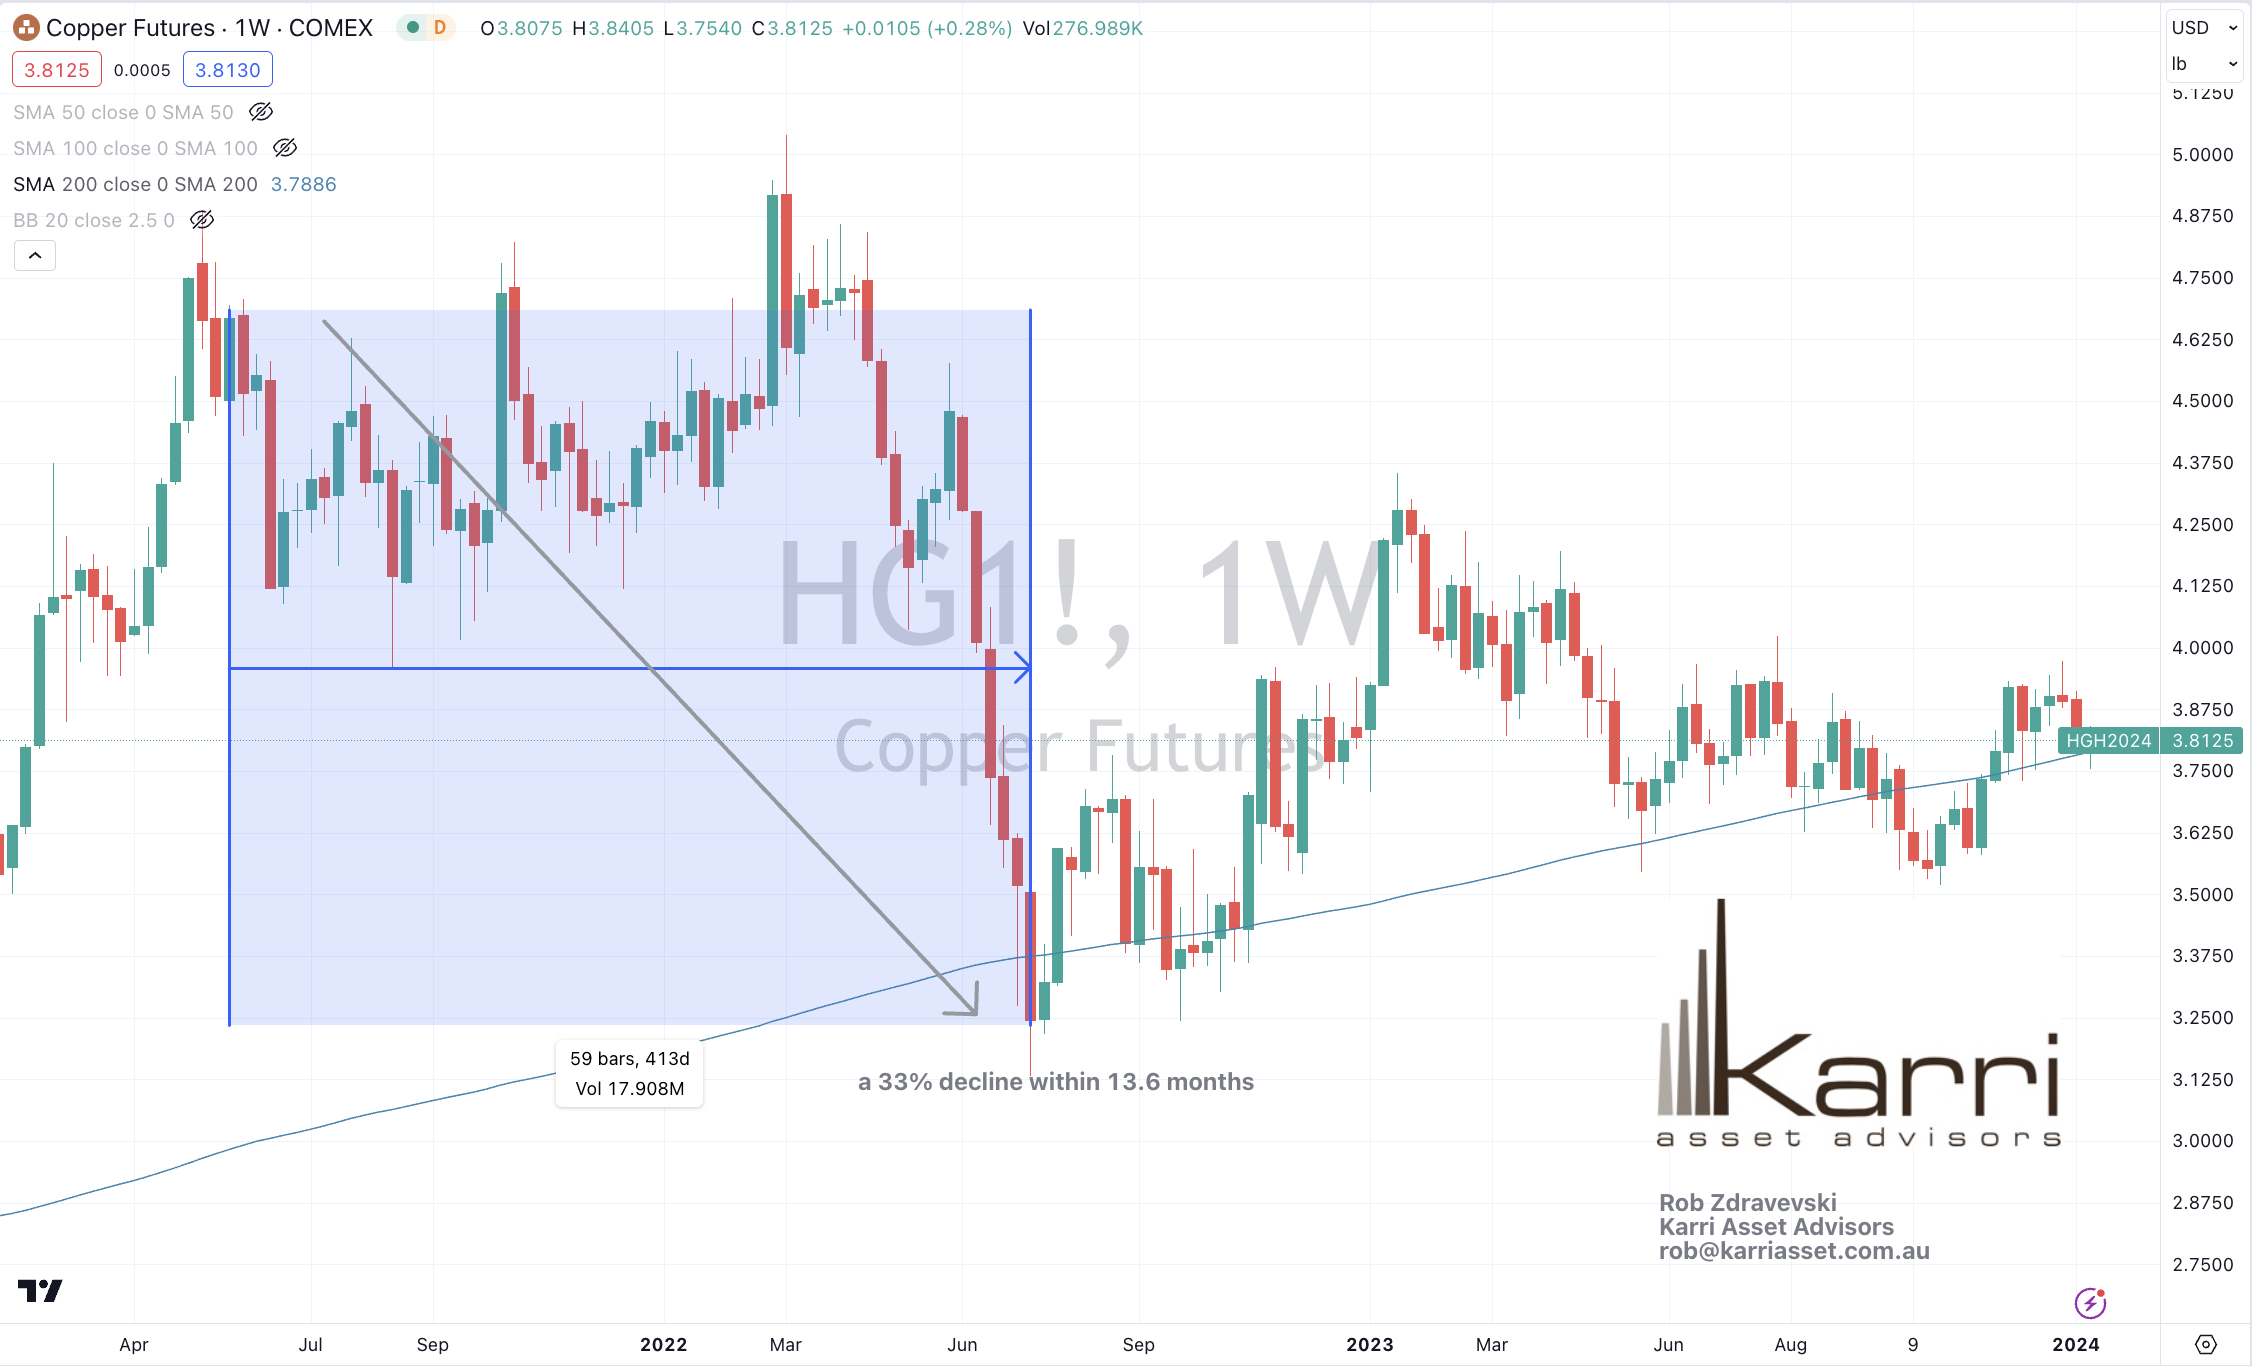
Aluminium (4.9%), Copper (2.3%), HRC (4.6%), Coffee (2.9%), Lithium (7.2%), Tin (2%), Newcastle Coal (2.5%), Nickel on MCX (1.9%), Palladium (6.5%), Platinum (3.7%), Urea Middle East (1.6%), Silver in USD (2.5%), Corn (2.2%), Oats (8.5%), Soybeans (3.2%), Wheat (1.9%), Shanghai (1.5%), CSI 300 (3%), CAC (1.6%), China A50 (2.8%), DJ Transports (2.5%), HSCEI (2.8%), Hang Seng (3%), BOVESPA (1.6%), S&P SmallCap 600 (3.6%), Russell 2000 (3.7%), Nasdaq Composite (3.3%), KOSPI (2.9%), FTSE 250 (2.4%), S&P MidCap 400 (2.4%), Mexico (2.1%), Nasdaq 100 (3.1%), Stockholm (2.5%), SOX (5.8%), Chile (2.3%), S&P 500 (1.5%), STI (1.7%), TAIEX (2.3%), ASX 200 (1.3%), ASX Materials (3%) and the ASX Small Caps fell 2.8%
January 7, 2024
by Rob Zdravevski
rob@karriasset.com.au