At some time during this past week, the following assets (on a weekly timeframe) registered either Overbought, Oversold or traded more than 2.5 standard deviations above its rolling mean.
For the second consecutive week, the only asset in my immediate universe which was either Oversold (where the RSI is < 30) and or trading at least 2.5 standard deviations below its mean was…..
Gold (priced in USD and AUD).
Note: Gold in CAD and EUR haven’t reached this point yet.
Extra Note :The material change from last week’s list is that the Oversold currencies have bounced and risen.
Everything else in my list below is in the “Overbought” territory
Extremes “above” the Mean (at least 2.5 standard deviations)
USD/JPY (The Yen is weak relative to the U.S. Dollar)
German 5 and 10 year bond yields (bonds are being sold and thus the yields are rising)
Spanish 10 year bond yields
French 10 year bond yields
(note: equity indices still not making this Overbought list, i.e. equities indices are not at extremes)
In fact, Nasdaq has now fallen 9% from its…..high
Overbought (RSI > 70)
AUD/JPY (a leading risk indicator)
WTI Oil (oil crisis aside, be careful if you’re a new buyer here, you may be marginalised)
Brent Crude Oil (not stretched on the standard deviations yet, but quite full)
CRB Index (we’ve already seen an impressive 6 month commodity rally)
Heating Oil (again)
Copper (last week it had the Quinella)
Iron Ore
Bitcoin – FYI the weekly mean is US$29,770 (rising from last week’s $28.000)
U.S. KBW Banking Index (mid cap, regional banks have been on a tear)
Dow Jones Transport Index
Swedish 10 year bond yields (coming off last weeks Quinella)
British 10 year bond yields
Corn
Soybeans
The Quinella – Both Overbought and Traded at > 2.5 standard deviations above the weekly mean)
Aluminium
Lean Hogs (3rd consecutive week)
The Copper/Gold ratio
U.S. 5 and 10 year bond yields
Australian 5 and 10 year bond yields
Korean 10 year bond yields (per last week’s comments, they were merely Overbought but now they touched 2%)
and New Zealand & Canadian 10 year bond yields
The big news in market extremes remains rising bond yields. See last week’s (February 27, ’21) commentary.
The spread between the 2 year and 10 year bond yield continues to widen, now sitting at 1.42%, something not seen since November 16, 2015. The topic of interest of not really the size of the spread but the fact that it has moved from 0.1% to 1.4% within 18 months. Such a terminal move particularly benefits banks (i.e. borrow short and lend out long) although the steepening of the curve (at the long end) does suggest higher corporate debt servicing costs.
Bitcoin is still trading at more than 400% above its 200 Weekly Moving Average.
The most overcrowded trade in the market today is believing that bond yields will rise.
And the uncrowded trade is being Long Gold.
Registrants of last week’s extreme readings above means and being Overbought, have since seen the following declines as shown in parentheses.
Tin has fallen 11%, the Chinese Renminbi changed direction and the Japanese 10 year bond yields reversed 38% from last week’s close of 0.16% to todays 0.10%.
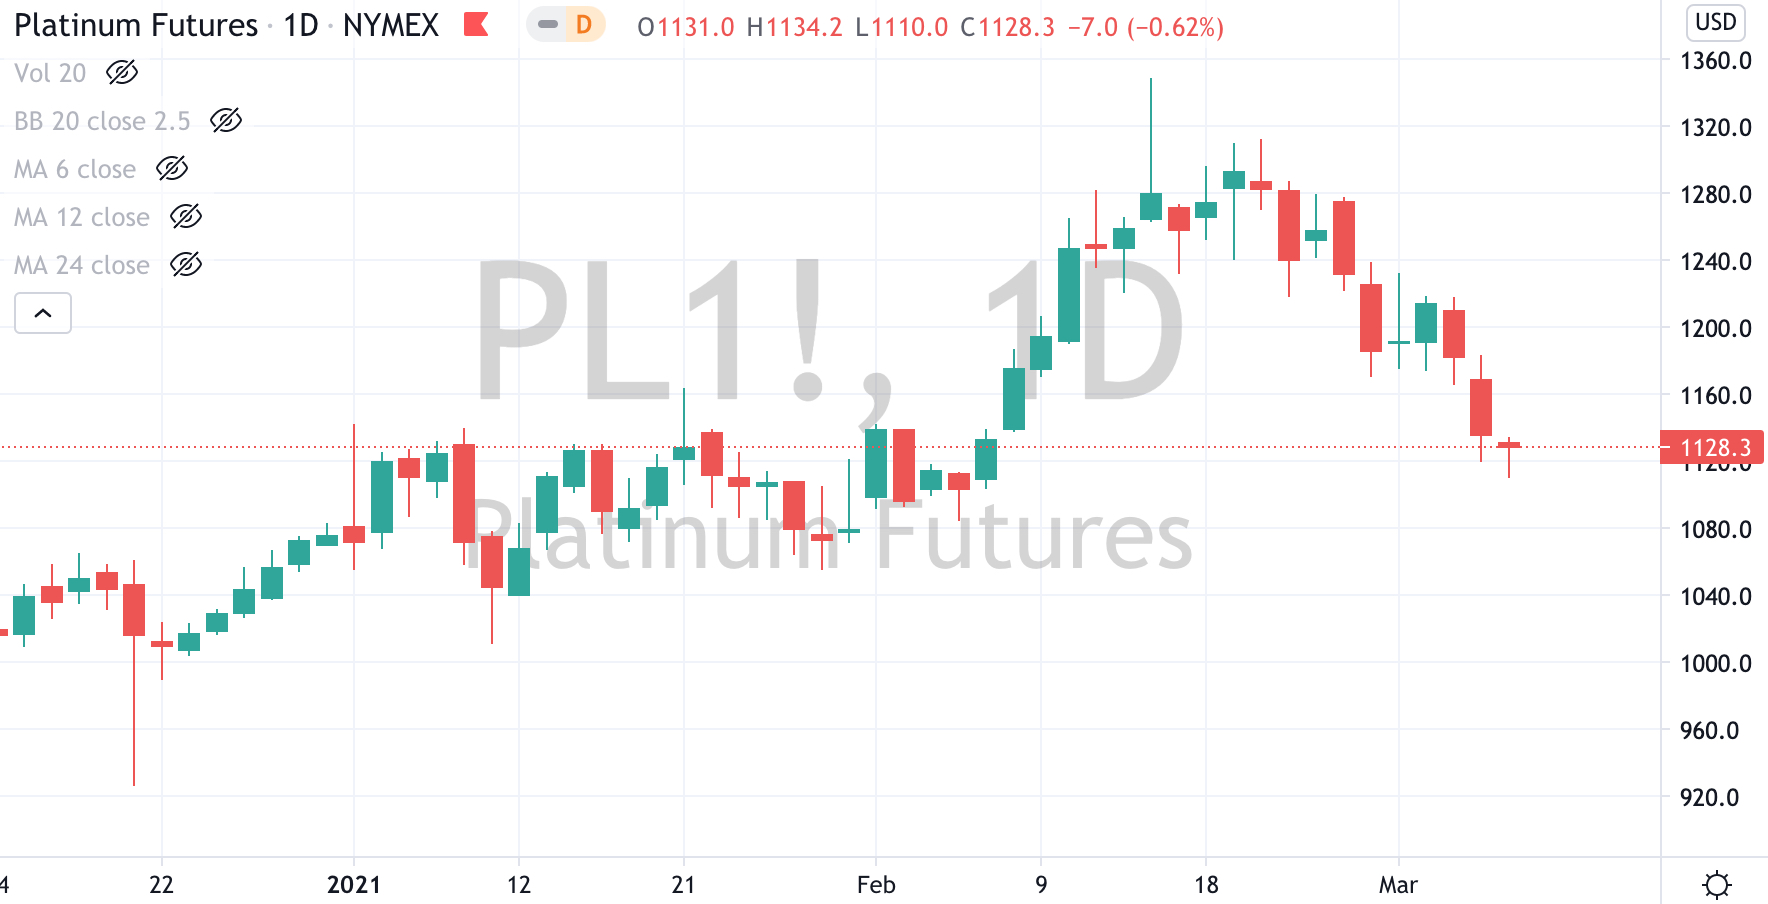
And following on from the previous week’s reversals and losses, Platinum carried on with a further 5% decline and Natural Gas retraced 2.5%.
March 7, 2021
by Rob Zdravevski
rob@karriasset.com.au