A 3-sigma event in Bitcoin
November 27, 2020 Leave a comment
A week ago I wrote this about Bitcoin’s price action.
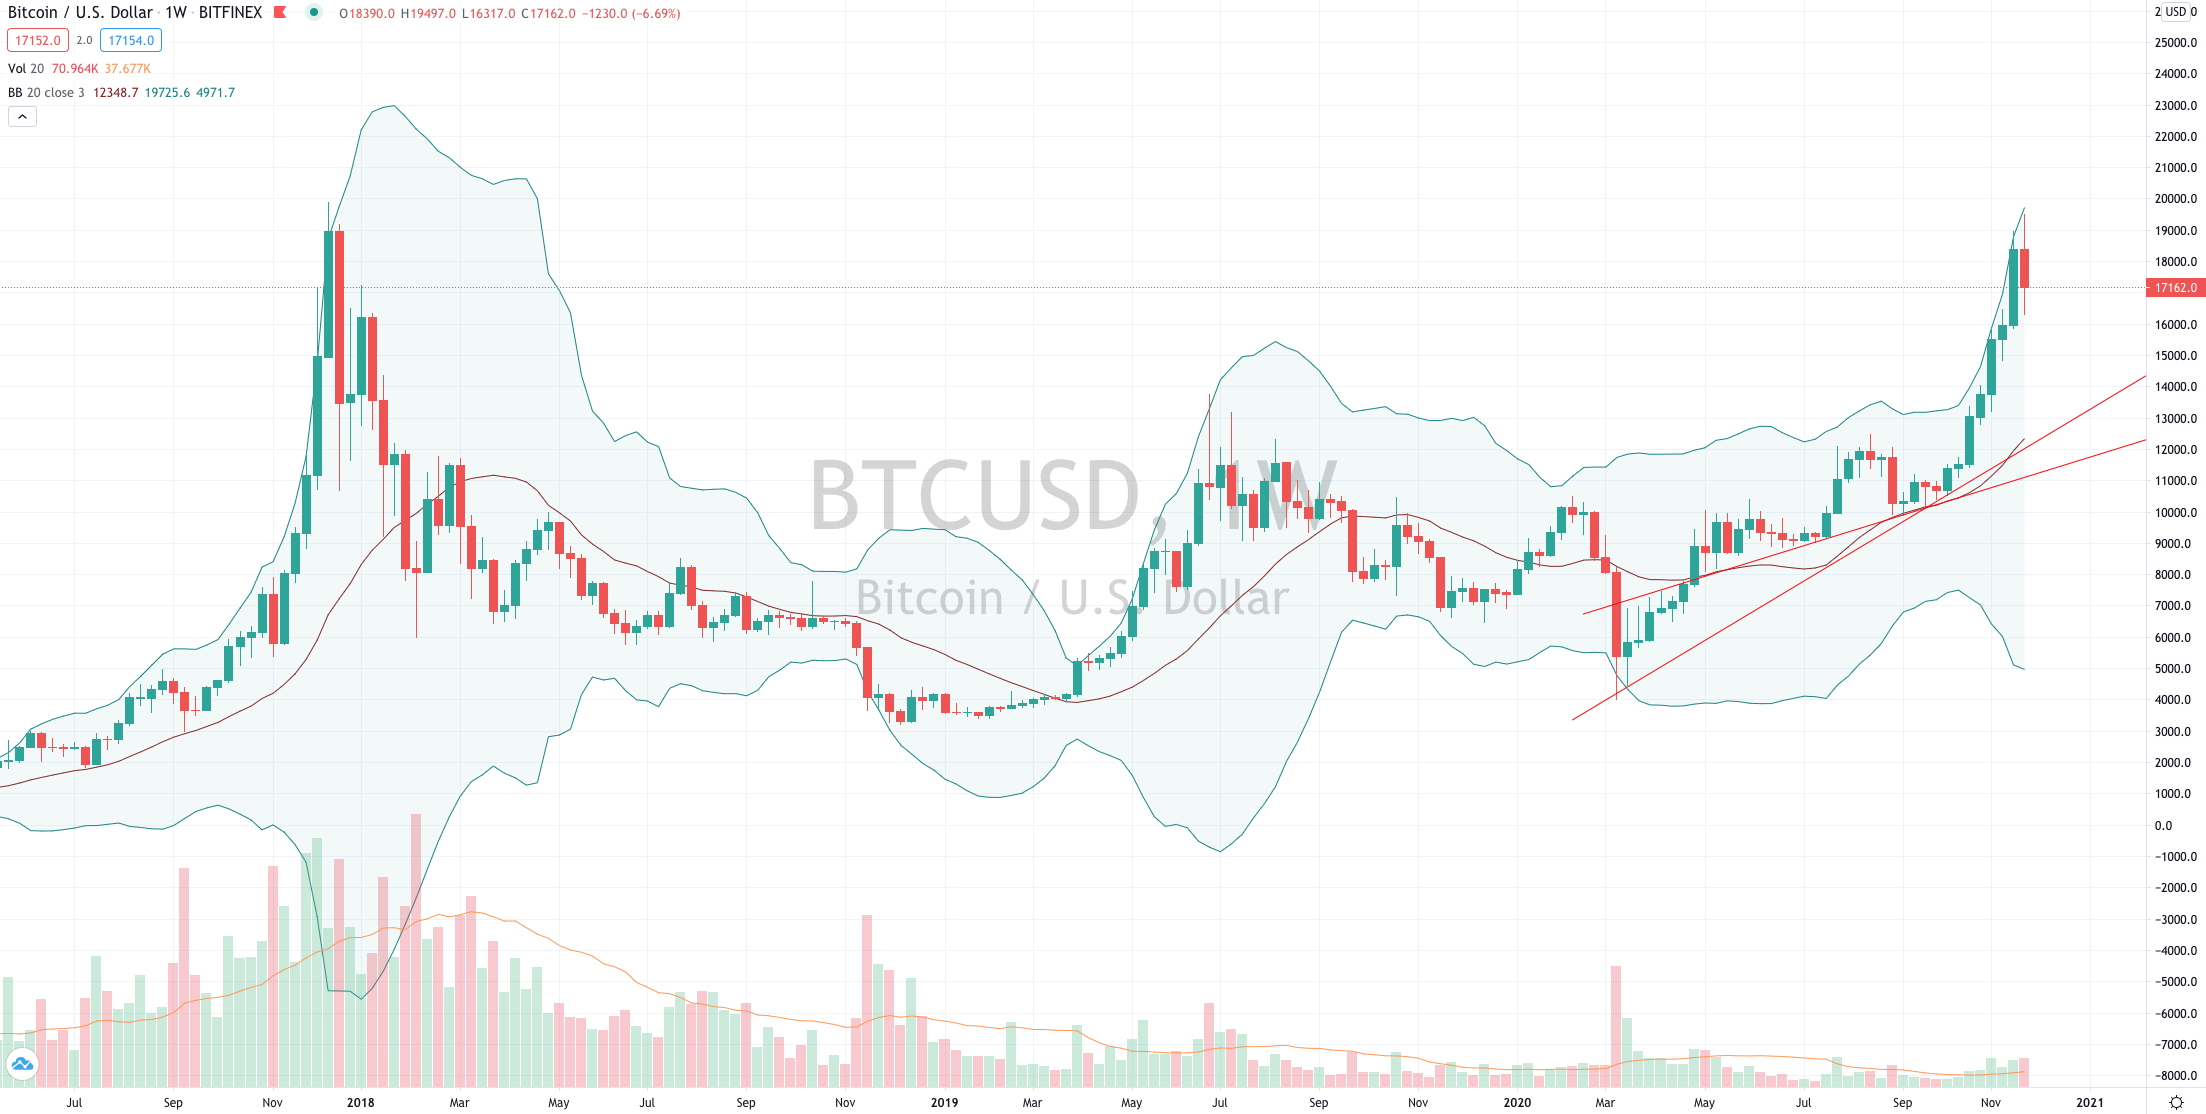
The arrival of the Bitcoin cavalry saw it trade to 3 standard deviations above its weekly mean and thus it’s logical to assume that the ‘fat part of the trade’ has been seen.
Such a 3-sigma event is expected approximately every 3 years.
Earlier this week, it lurched a $1,000 higher to reach $19,500 before falling 11% in the past 2 days.
As I write this, it’s now trading at $17,180.
Whether you consider Bitcoin a currency (which is different to a store of value) or a speculative digital asset, its underlying price volatility makes it a most fascinating asset to monitor, both mathematically and behaviourally.
Over the next couple months, I expect Bitcoin to trade back to the $13,500 level and notwithstanding any upheaval, likely to hold $12,000 as illustrated by the trend lines in the chart below.
Incidentally, over the past 2 days ,XRP and Ethereum (other cryptocurrencies) have fallen 24% and 15% respectively.
November 27, 2020
by Rob Zdravevski
rob@karriasset.com.au