Introducing the Gold/Oil Ratio
November 23, 2020 Leave a comment
Readers of my posts would realise that I am bullish Oil and am somewhat subdued about the prospects of Gold.
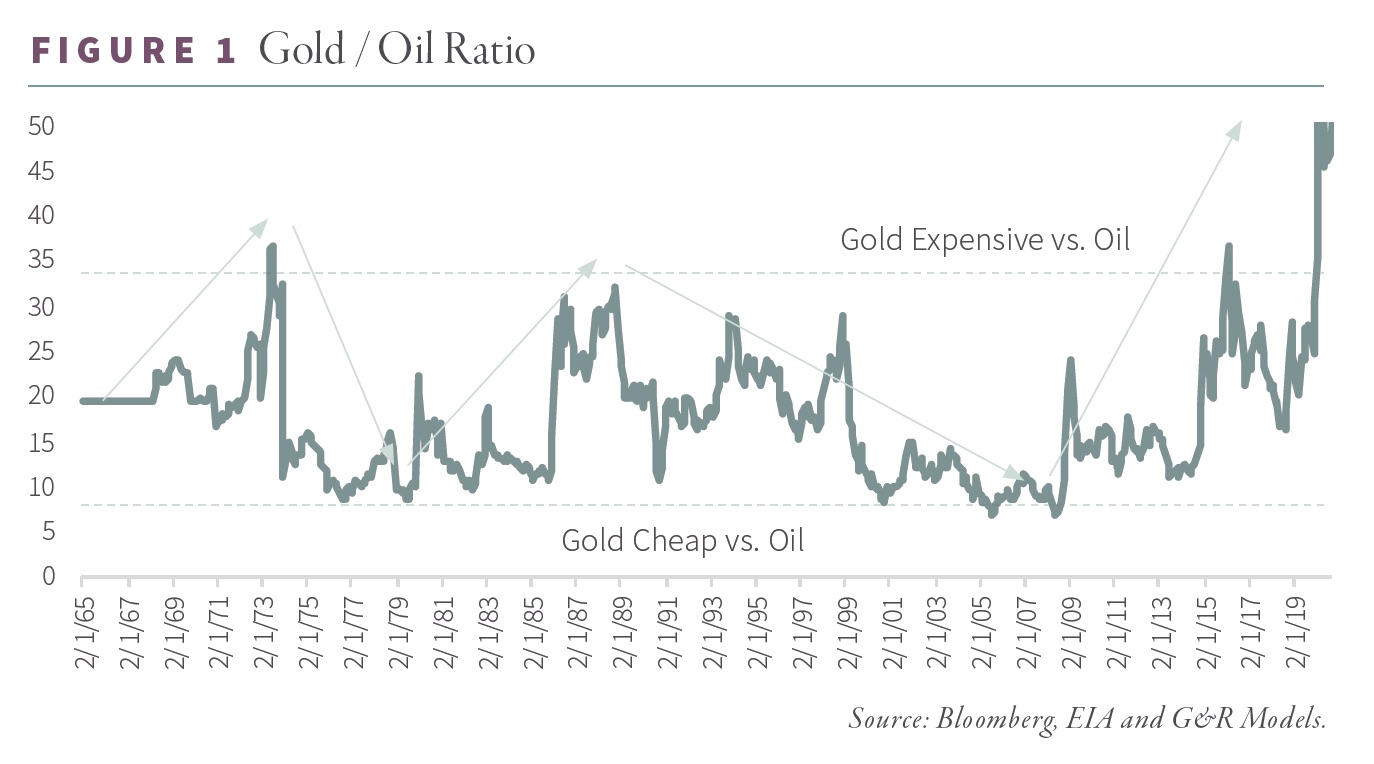
The Gold/Oil Ratio which illustrates how many barrels of oil are needed to buy an ounce of gold.
The chart below shows us a 50 year history and never has Oil traded so cheap relative to Gold. A distortion in the ratio (around April 2020) occurred recently when the price of West Texas Intermediate Oil went negative for a moment,
and thus I prefer to watch the price of Brent Crude.
While Gold bulls are calling for its price to double, I don’t see why I can’t make a similar claim for Oil especially when I present you with some historical analysis and while there is quite a deficit in supply and inventories.
Since 1900, Crude has averaged a 12-month gross return of 7% while Gold has averaged a 12-month gross return of 5%. Oil has generated a negative 12-month return 39% of the time while gold has generated a negative return 32% of time.
However, when the Gold/Oil Ratio has exceeded 30:1 (i.e., oil is cheap relative to gold), Crude has returned 32% on average over the next twelve months (over four times its long-term average), while gold has returned 4% on average. Oil was lower only 13% of the time. On average, oil outperformed gold by 28% during these periods compared with 2% normally.
And so today, the Gold/Oil Ratio is trading at 41 which is still near an all-time record.
FYI, the 50 year mean of the Gold / Oil Ratio is 16.
November 23, 2020
by Rob Zdravevski
rob@karriasset.com.au
source credit: Goehring & Rozencwajg