Preparing to increase allocation to Small Cap equities

My various signals and studies are prompting me to prepare to initiate/increase weightings towards Small Cap equities.

This will apply to Australian and U.S. small caps.

The chart below is a snippet showing the mimicry and correlation between weekly prices of the Copper/Gold Ratio and the Nasdaq Small Cap 700 Index.

Clients will separately receive supporting research, entry prices and the securities which I’ll use to express this view.

March 29, 2023

by Rob Zdravevski

Karri Asset Advisors

rob@karriasset.com.au

Oil – the bear is turning bullish

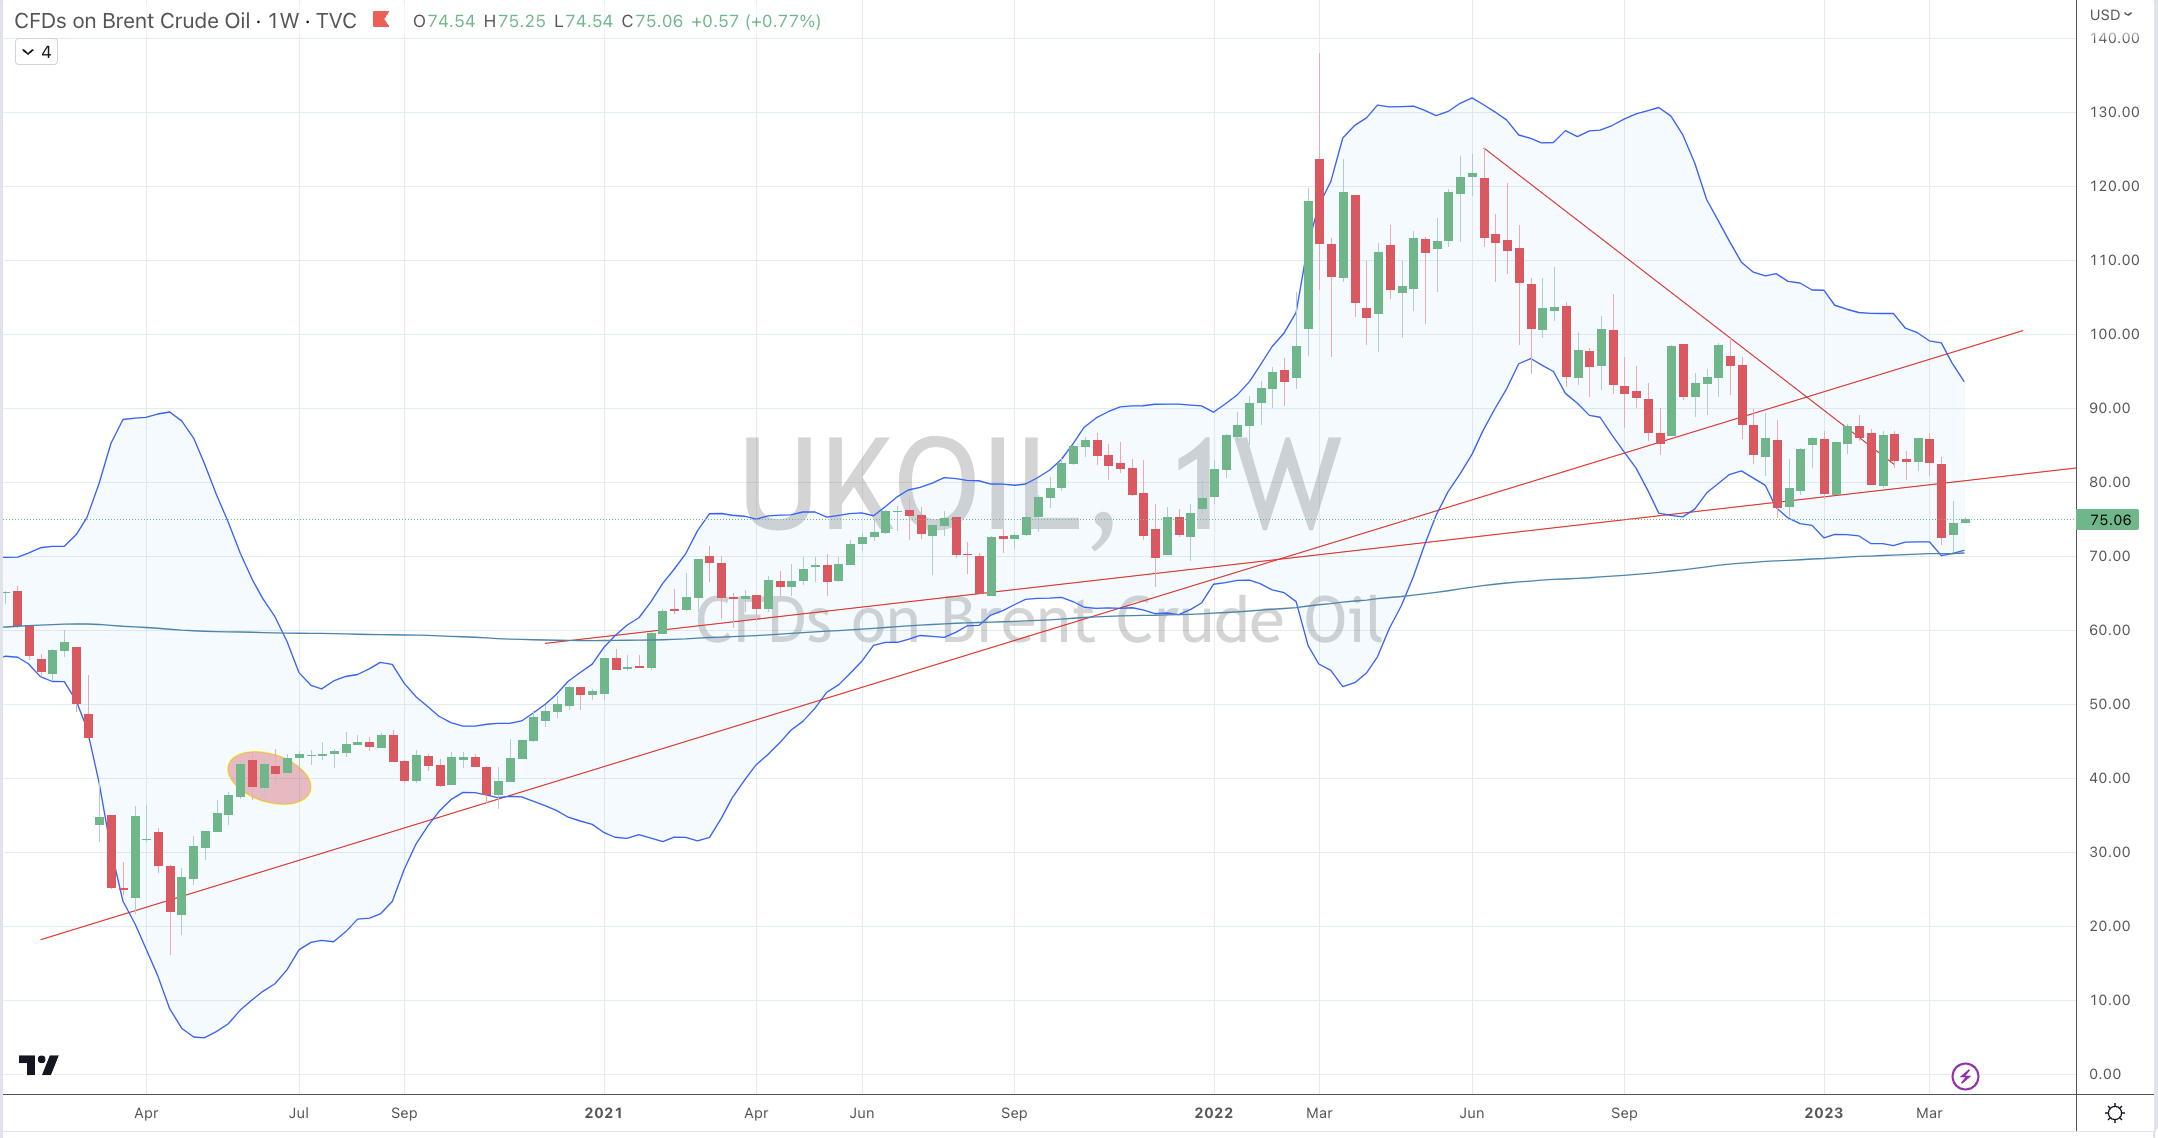
Whilst I have been bearish on the Oil price for the past year, there was a time when I was bullish.

That was way back in June 2020. The price of Brent Crude then tripled.

The circle in the chart below shows that June 2020 period.

In this article, dated June 12, 2022 I mentioned Brent Crude trading around $37 represented an attractive entry point and that it should hold the $32 level, which it did.

https://www.linkedin.com/pulse/my-current-read-oil-prices-rob-zdravevski/?trackingId=tNLrb4FgRDmZgGsOwYEOqw%3D%3D

Today, (3 years later) I am preparing for a moment to accumulate Oil or oil-related securities again.

March 27, 2023

by Rob Zdravevski

rob@karriasset.com.au

Macro Extremes (week ending March 24, 2023)

A weekly Macro, Cross Asset review of prices trading at extremes which may generate future investment ideas and opportunities.

The following assets (on a weekly timeframe) registered an Overbought or Oversold reading and/or have traded more than 2.5 standard deviations above or below its rolling mean.

Extremes “above” the Mean (at least 2.5 standard deviations)

Cocoa

U.S. 10 year minus U.S. 2 year yield spread

U.S. 10 year minus U.S. 5 year yield spread

U.S. 30 year minus U.S. 10 year yield spread

SHY

EUR/AUD

MOEX Index

Overbought (RSI > 70)

Hot Rolled Coil Steel (HRC)

Cattle

The Overbought Quinella – Both Overbought and Traded at > 2.5 standard deviations above the weekly mean)

Gold (in AUD and CAD)

Extremes “below” the Mean (at least 2.5 standard deviations)

U.S. 5 year yield minus U.S. 5 year breakeven inflation rate

Australian 3, 5 and 10 year bond yields

Copper/Gold Ratio

U.S. 5 & 7 year bond yield

S&P GSCI Index

Brent Crude Oil

WTI Crude Oil

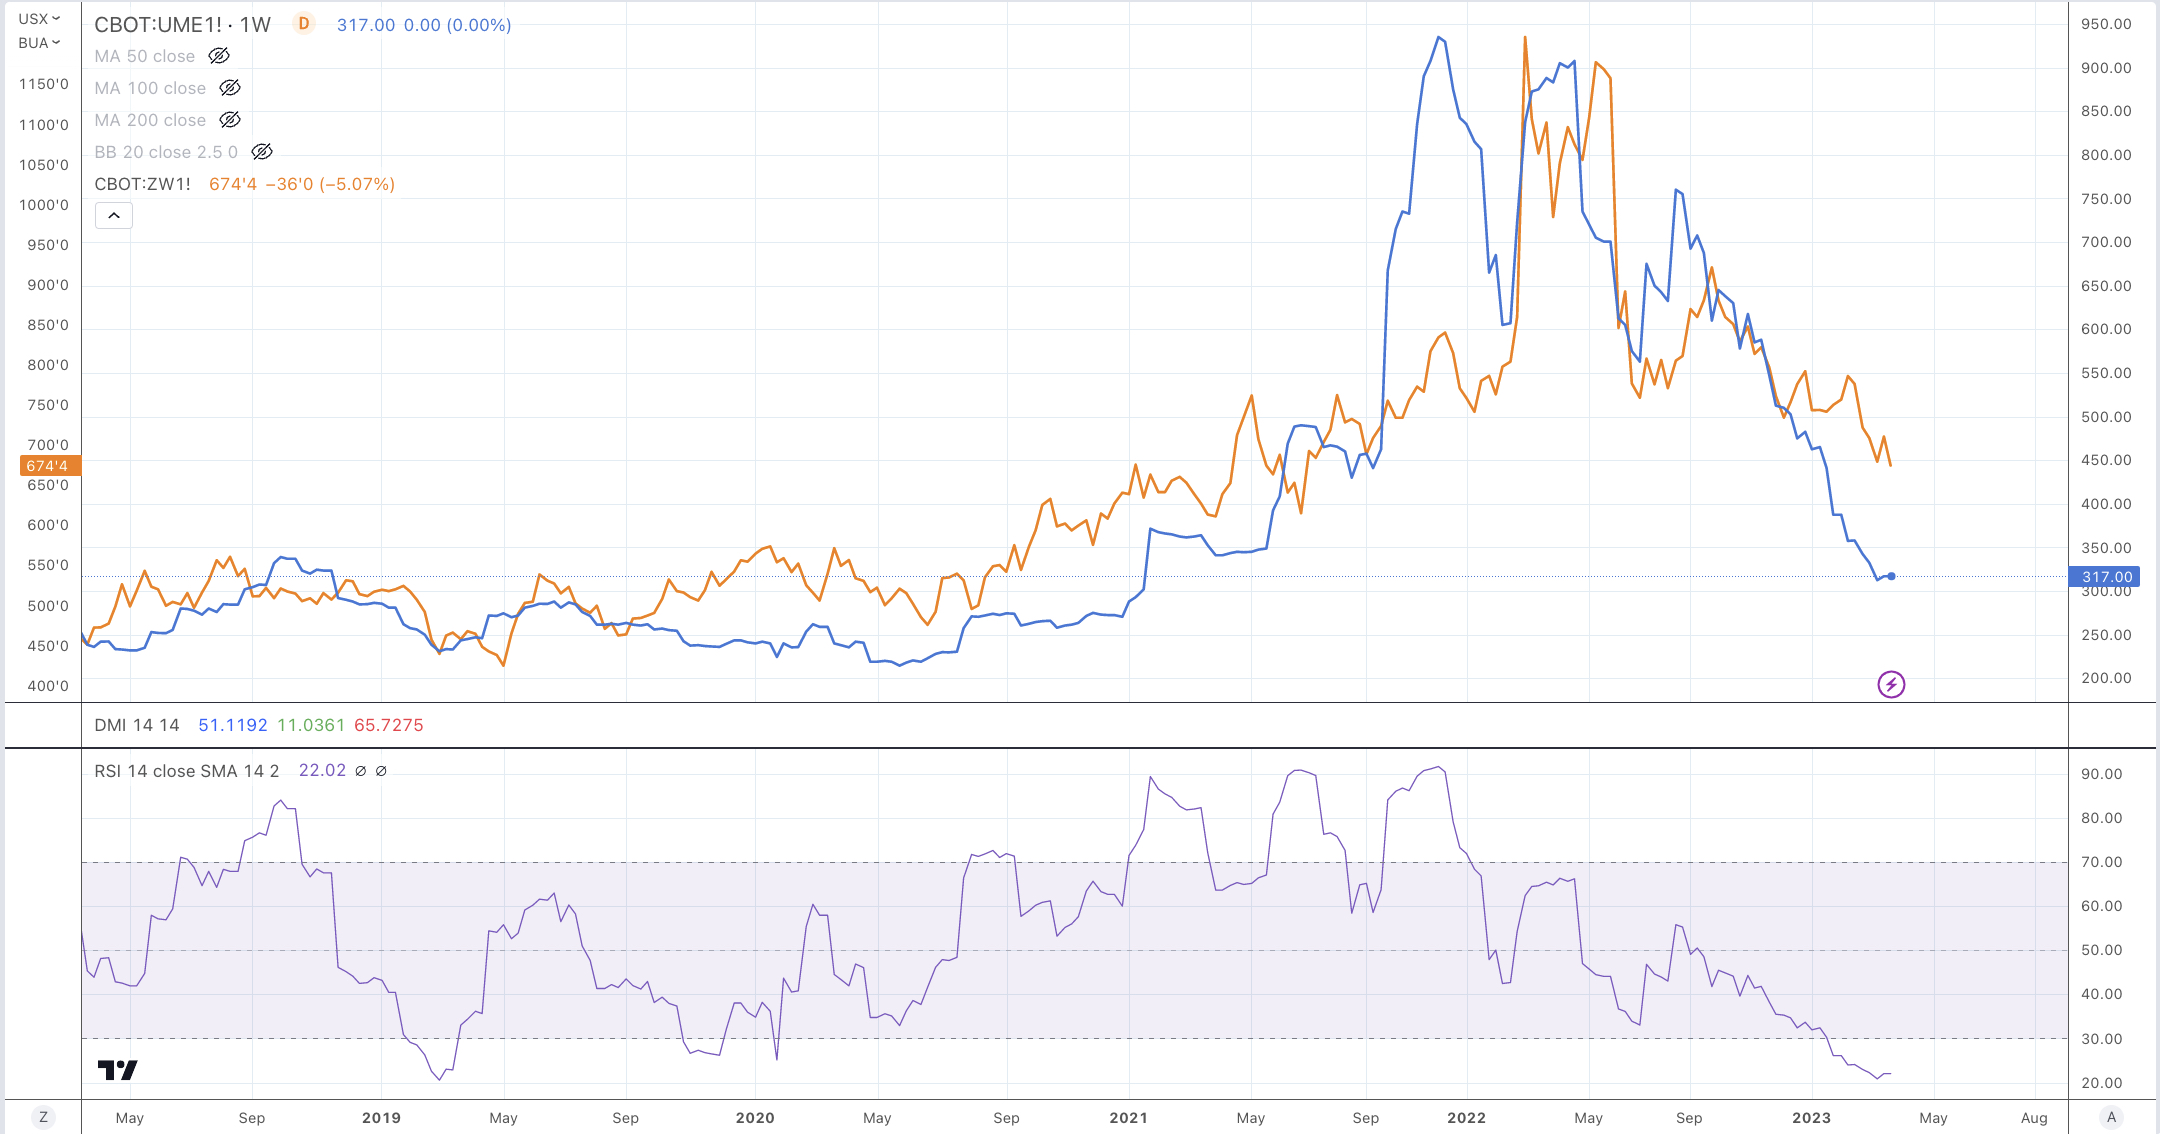
Wheat

AUD/EUR

AUD/JPY

AUD/SGD

BOVESPA

Sensex

ASX Small Caps Index

And the major equity indices in Norway, Finland, Switzerland, Singapore, Malaysia and Thailand

Oversold (RSI < 30)

U.S. 5 year minus U.S. 3 month yield spread

Urea (U.S. Gulf) 

Urea (Middle East)

KBW Banking Index

Lithium

The Oversold Quinella – Both Overbought and Traded at > 2.5 standard deviations above the weekly mean)

None

Notes & Ideas:

Equities consolidated through the week and were mostly positive for the week, with Asian bourses posting solid weekly returns.

Australian indices were amongst the few to post a negative week. 

The U.S. he KBW Bank Index only fell 0.5% for the week.

The ASX 200 fell 0.6% for the week while the ASX Small Caps index declined 1.1%. It’s worthy to note that the former has registered its 7th consecutive losing week amounting to a cumulative decline of 8.3%.

Incidentally, the Nasdaq 100 has climbed 8% over the past 2 weeks which is notable outperformance compared to the 3% decline seen in the ASX 200 over the past fortnight.

Amongst bonds, yields fell again except for the Germans.

More of those government bond yields are starting to appear on the oversold extremes list.

Last week, I commented about a most dramatic observation seen in the U.S. 10 year minus 2 year bond spread (yield curve) where it moved from a ‘negative’ 2.5 standard deviation to a ‘positive’ 2.5 standard deviation reading within 1 week.

This is its first visit to +2.5 standard deviation (SD) land since March 1st, 2021 

What’s more, other U.S. yield curves joined the same +2.5 SD club this week.

While Japanese yields closed at levels resembling where it mostly traded over the past year.

And the U.S. 5 year inflation break-even rate completed its mean reverted to its 200 week moving average.

In commodities, we saw support across the energy complex except for the Gases.

Intra-week saw both Brent and WTI Crude trade down to 2.5 standard deviations below their weekly mean. The former also mean reverted to its 200 week moving average, a week after WTI Crude did the same. 

The significance of long term mean revision is being felt across many commodity prices whose preceding parabolic price rises were connected to the cause of inflationary pressures.

Today, Aluminium, Rotterdam Coal and many others are experiencing the gravitational pull of those means.

Meanwhile, Cocoa registered an oversold extreme when it traded 2.5 standard deviations (sd) below its weekly mean in September 2022 and now its 2.5 standard deviations above that same benchmark. In between this round trip, Cocoa’s price has risen 30%.

Silver added to last week’s performance, Copper had good week while Soybeans and Wheat eased towards oversold levels.

Gold continues to be overbought in various currencies and the JKM LNG price is creeping lower towards a possible buy target.

And I’ll remind myself that the Copper/Gold Ratio is ‘oversold’.

In currencies, the AUD continues to be weak against everyone with those extreme weakness listed this week.

The larger advancers over the past week comprised of;

Aluminium 3.5%, Cocoa 5.3%, WTI Crude 3.5%, China Coal 5.7%, Copper 4.7%, Tin 4.4%, Orange Juice 4.7%,Palladium 2%,Gasoline 3.5%, Brent Crude 2.7%, Silver in AUD 3.7%, Silver 2.8%, Oats 5.9%, Rice 4%, CSI300 1.7%, HSCEI 2.7%, HSI 2%, MOEX 3%, Nasdaq Composite 1.7%, Nasdaq 100 2%, Copenhagen 1.8%, S&P 500 1.5%, TAIEX 3%, SET 1.8% and Chile rose 2.7%.

The group of decliners included;

Baltic Dry Index (3%), Lean Hogs (3.4%), JKM LNG (3.7%), Lumber (8.4%), Natural Gas (5.2%), Nickel (1.8%), Cotton (1.7%), Dutch TTF Gas (4.1%), Soybeans (3.3%), Wheat (3.1%) and Brazil’s BOVESPA fell 3.1%

March 26, 2023

by Rob Zdravevski

rob@karriasset.com.au 

Sell AUD Gold exposure

Gold in AUD is trading at ‘extreme’ highs.

It is overbought on a weekly basis and has traded to 2.5 standard deviations above its weekly mean.

Furthermore, the percentages show the amount which AUD Gold is trading above its 200 week moving average.

It makes for a difficult case to initiate new ‘long’ positions.

On another note, if you are an Australian gold explorer who has established their resources and/or reserves but you are at the stage of being pre-production plant construction……I think it may be prudent and clever to sell your project to an eager incumbent producer (seeking resource replacement) in light of the high AUD Gold prices and more so when coupled with the higher capex costs, let alone higher financing costs that you will be facing.

March 25, 2023

by Rob Zdravevski

rob@karriasset.co.au

Wheat’s 2nd and 3rd derivative relationships

I don’t think that the low in Wheat’s has been seen yet.

Here is the wheat price overlaid with Urea……

March 24, 2023

by Rob Zdravevski

rob@karriasset.com.au
Oversold Commodity Indices signal a trough in the ASX 200

This study shows a correlation that when the S&P Goldman Sachs Commodity Index (SPGSCI) which is plotted in blue, hits a weekly oversold reading and simultaneously mean reverts to its 200 week moving average, the ASX 200 (the orange line) sees a notable low.

Notwithstanding, a buy signal for the SPGSCI also appears at this time.

March 23, 2023

by Rob Zdravevski

rob@karriasset.com.au

Correlation: Oil, Inflation, GDP & Interest Rates

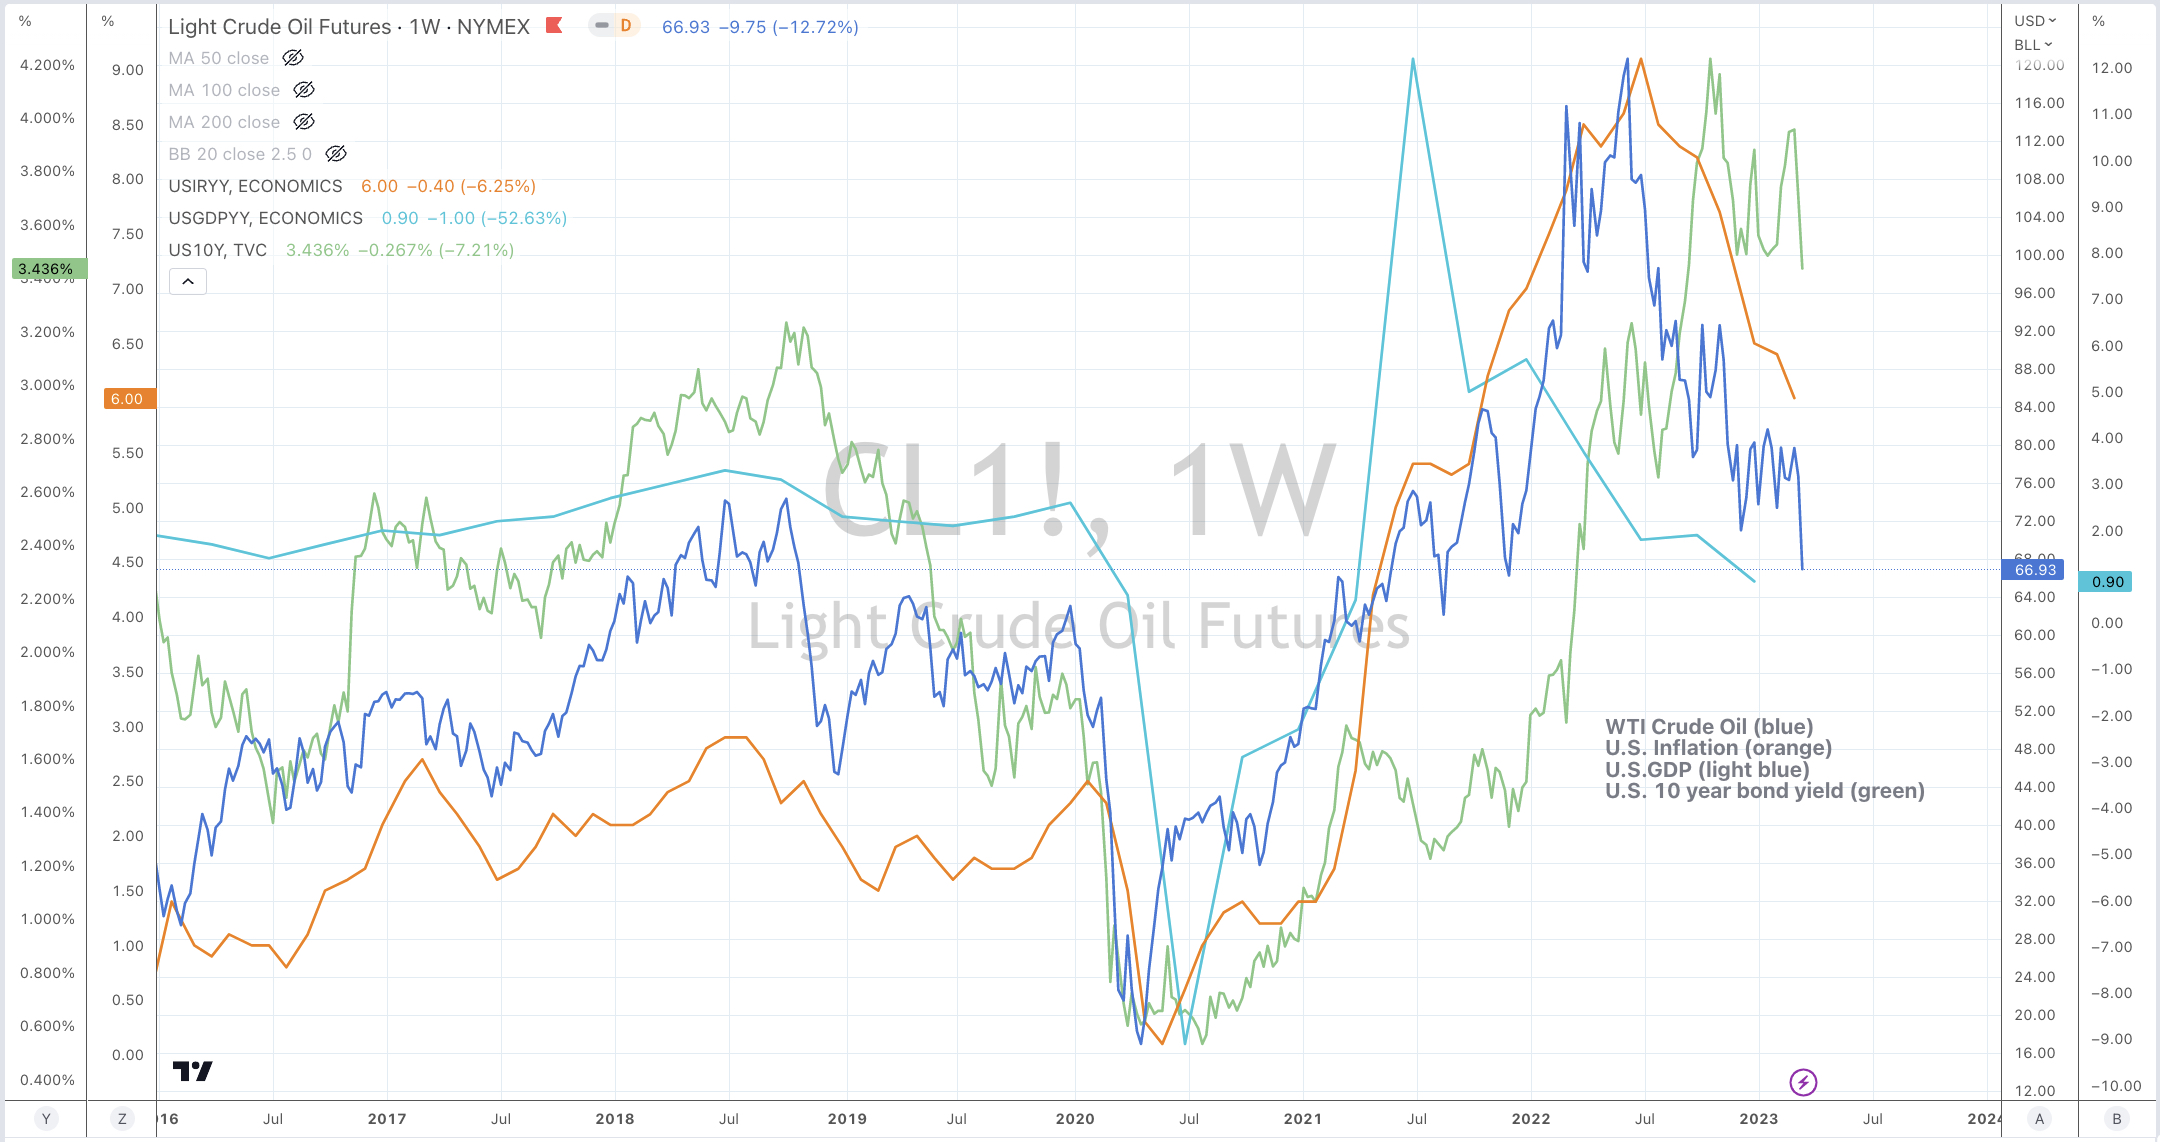
Crude Oil tends to lead inflation and interest rates.

On most occasions it also leads GDP too.

In the chart below;

WTI Crude Oil (blue)
U.S. Inflation (orange)
U.S.GDP (light blue)
U.S. 10 year bond yield (green)

March 23, 2023
by Rob Zdravevski
rob@karriasset.com.au
Understanding risk/adjusted – Australian Banks

Indeed, there are times when to sell Australian bank shares.

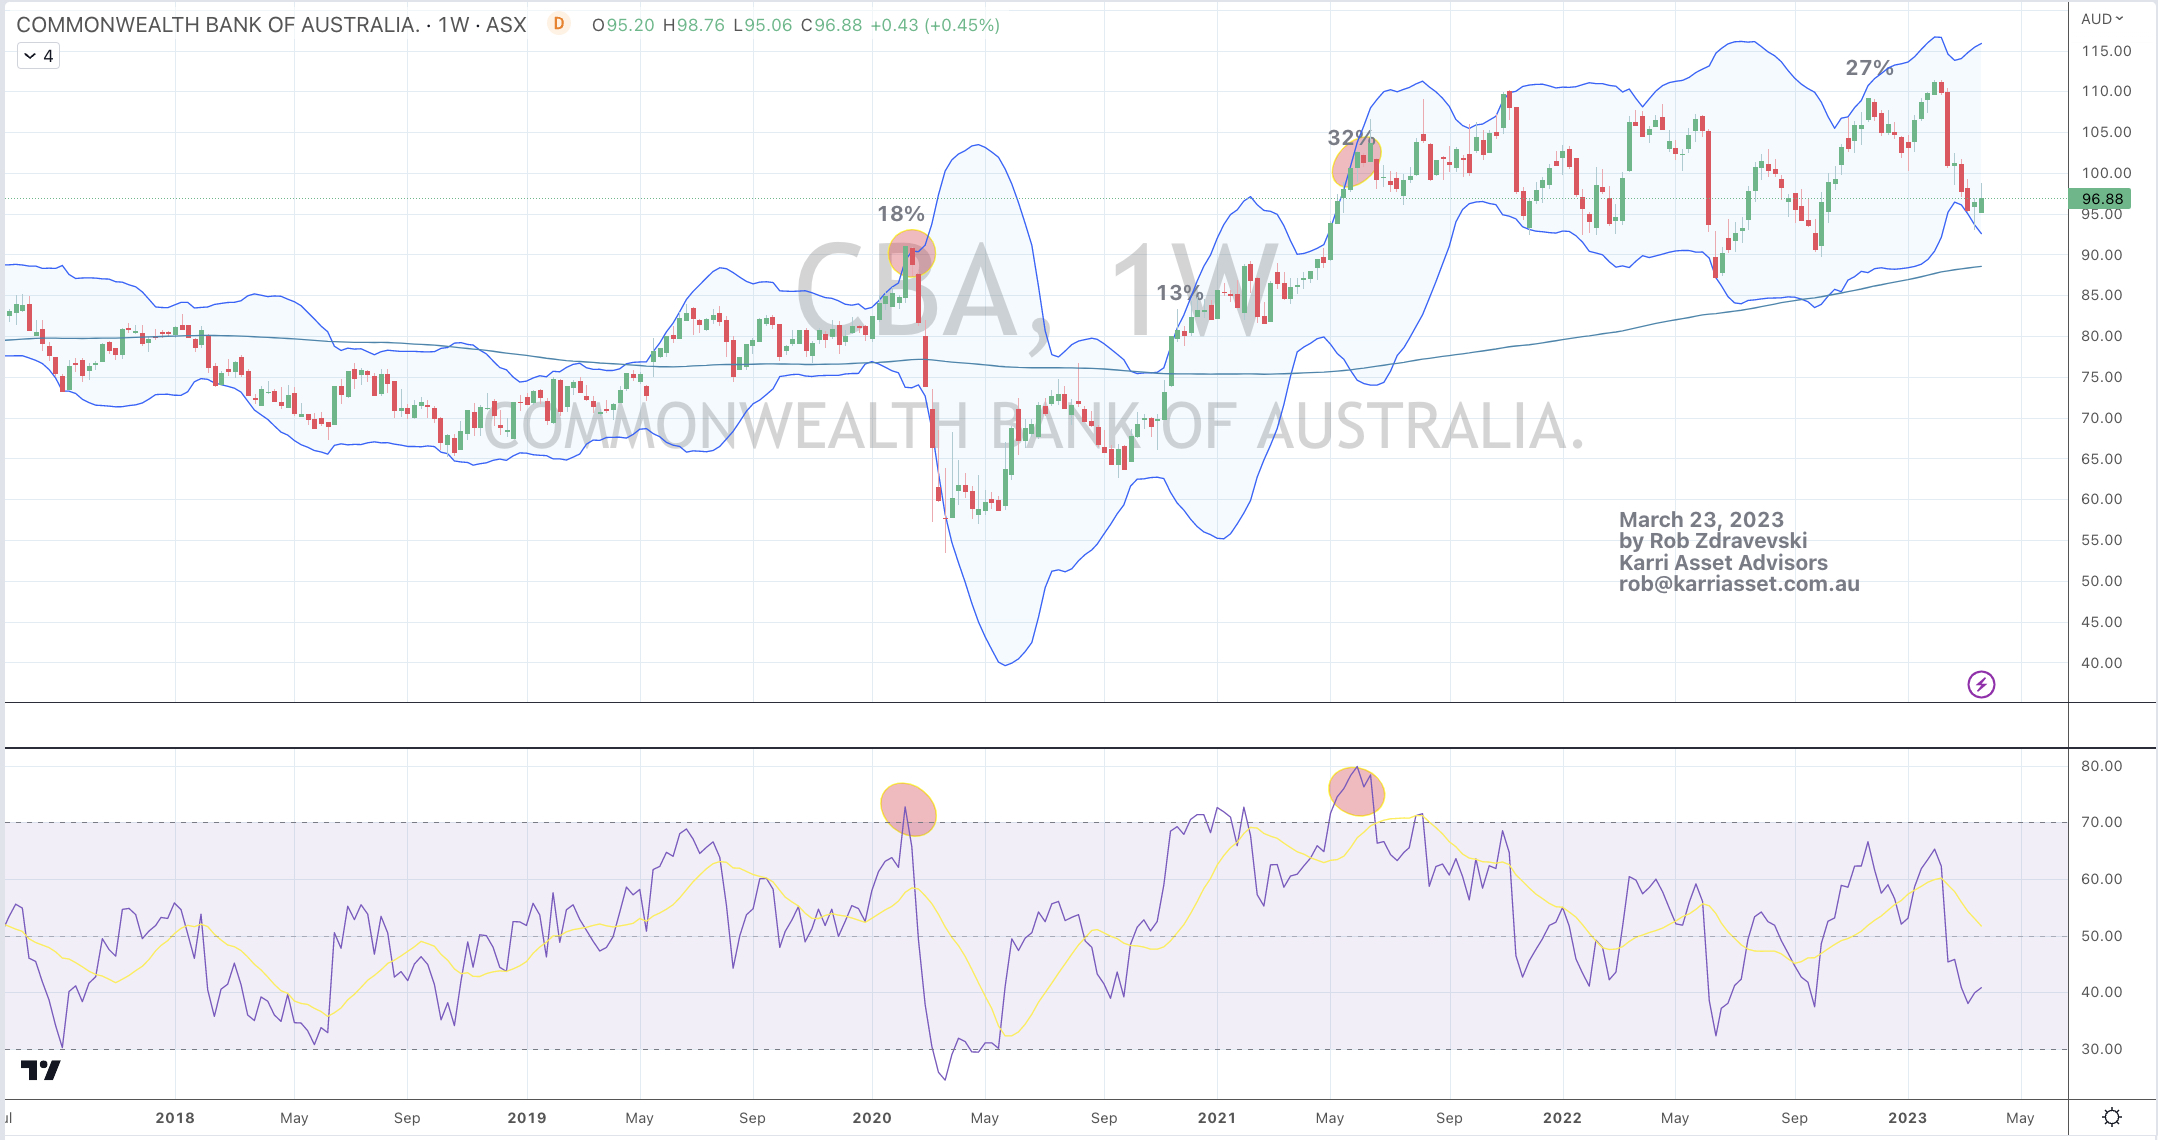
This study below shows moments when the stock price in Commonwealth Bank of Australia (CBA) was stretched.

Ignoring such signals means investors are leaving money ‘at risk’ when probability suggests valuations are full or lower prices beckon.

Irrespective that Australian banks have always traded at a premium to their global peers, resting on the mantra that ‘you can’t go wrong owning the banks’ is false.

And finding solace, that ‘at least I’m receiving my dividends’ is not addressing the risk being taken for such a return.

CBA”s stock price is now trading at the same price as March 2015 (that’s 8 years ago) while Westpac is trading at the same price as 2008, 2010 and 2012.

March 23, 2023

by Rob Zdravevski

rob@karriasset.com.au

Watching for ASX 200 buying moment

The ASX 200 is not yet in ‘buying’ territory although it may arrive soon.

Amongst my other empirical and correlation work, here is a study of the AUD/JPY versus the ASX 200.

Clients will receive the prompt when to action a shift in asset allocation.

Interested parties, individuals, family offices, pension funds and others are welcome to make contact and inquire about my investment advisory services.

March 21, 2023

by Rob Zdravevski

Karri Asset Advisors

rob@karriasset.com.au

S&P 500 – ‘caught in a trap’

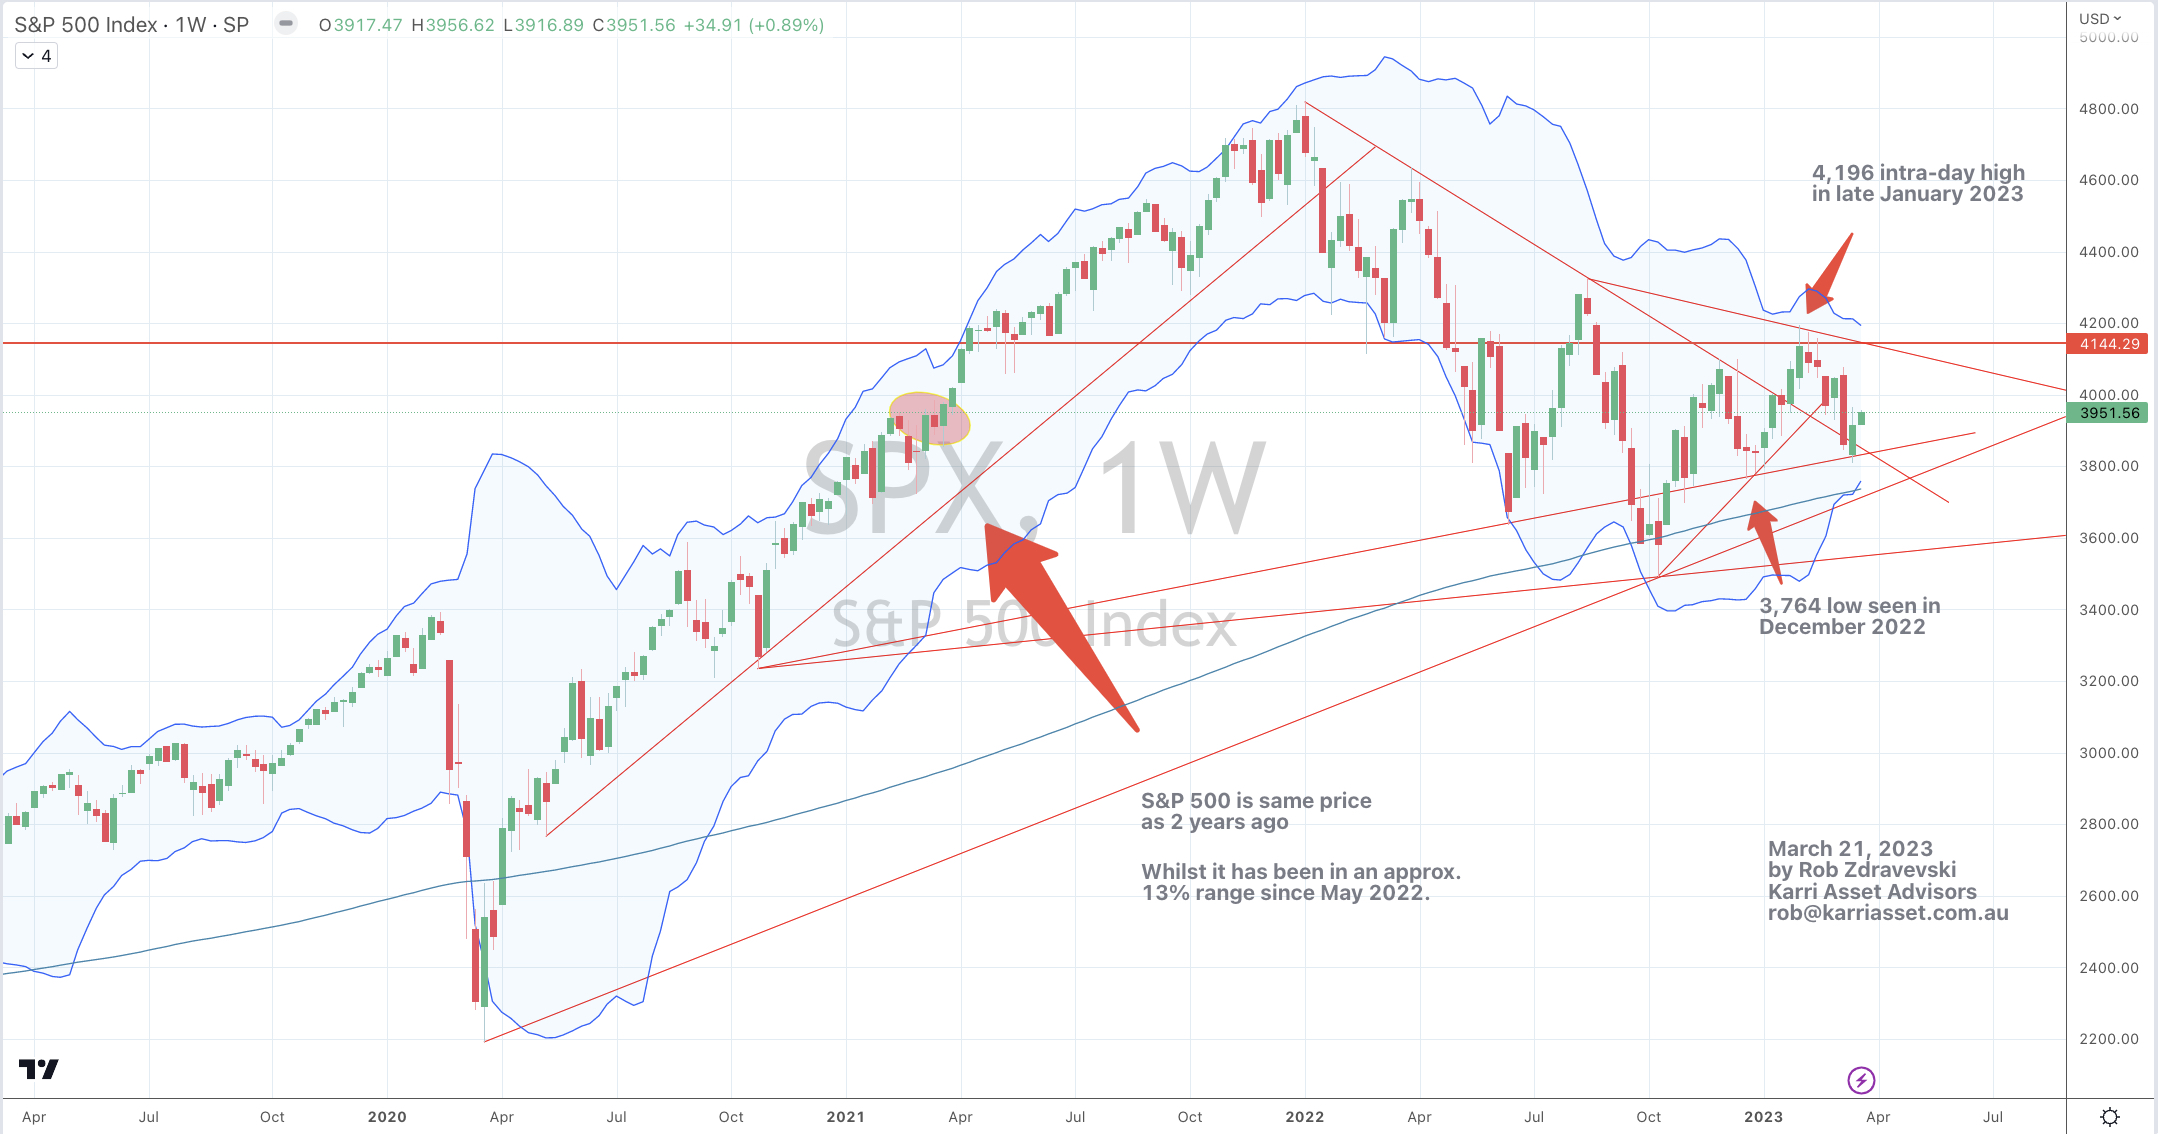
Here is my S&P 500 picture.

‘The market’ needs to either make a higher high or a lower low.

p.s. It has been range bound for the past year and today’s price is the same as 2 years ago.

This newsletter summarised my October – December 2021 calls to lighten equity exposure and raise cash.

https://mailchi.mp/karriasset/reviewing-my-calls-to-sell-and-raise-cash

“Time in the market” doesn’t work when there isn’t a bullish secular trend supported by tailwinds.

Put another way, over allocation to equities over the past year or so meant investors were placing too much money, at actual risk.

I think finding adequate investment returns over the coming years will take more work and study than simply buying an index ETF ‘at market’.

March 21, 2023

by Rob Zdravevski

rob@karriasset.com.au