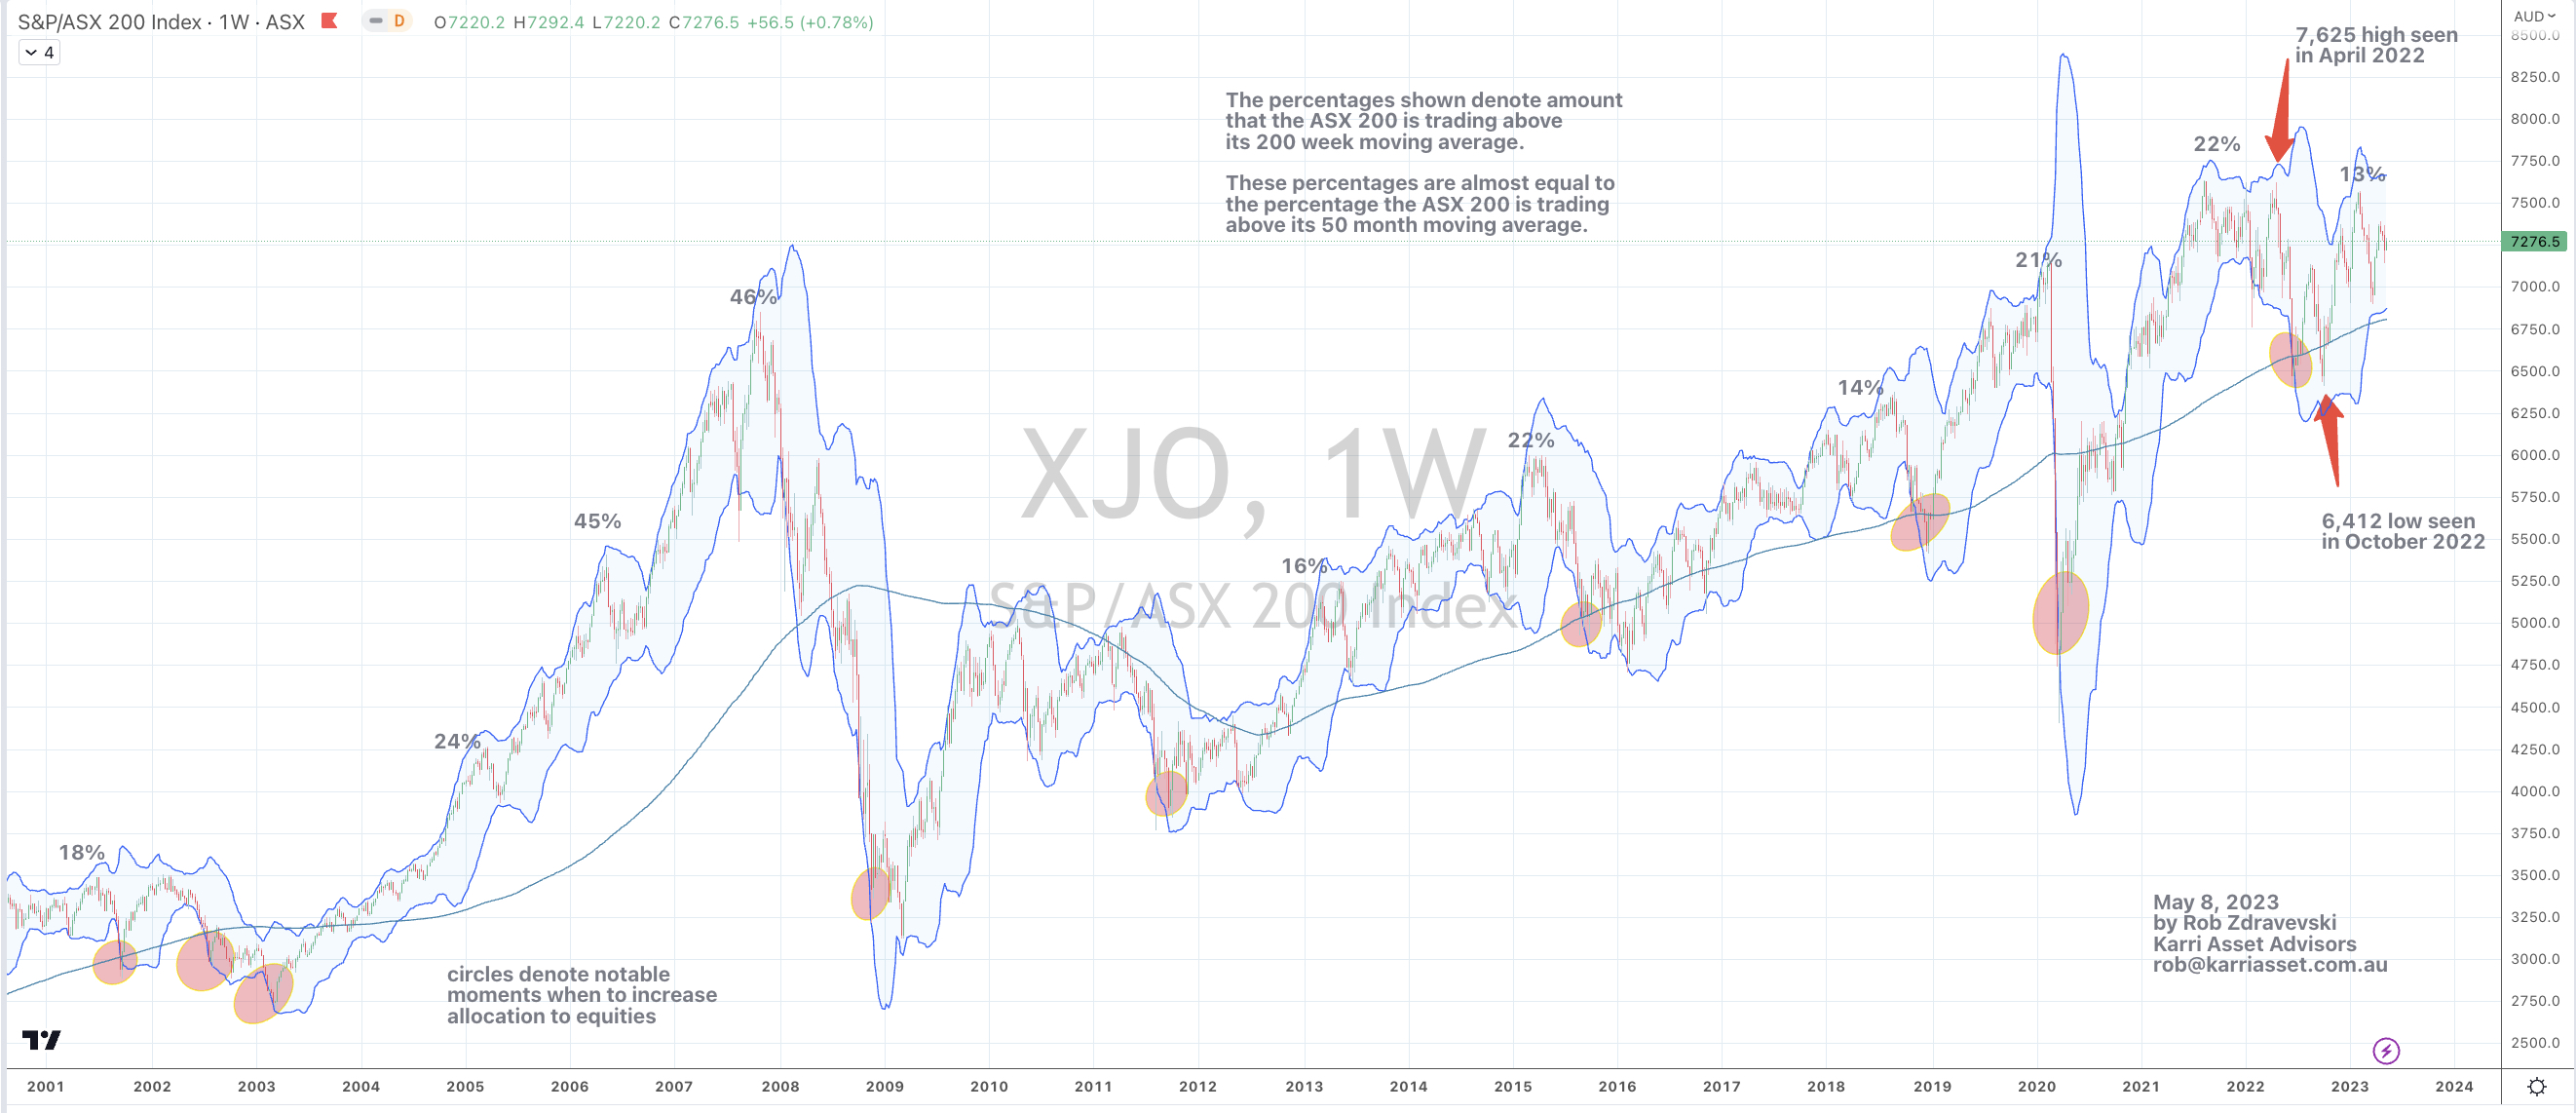
the percentages shown denote amount that the ASX 200 is trading above its 200 week moving average and…….
these percentages are almost equal to the percentage the ASX 200 is trading above its 50 month moving average.
The index remains in sideways travel for the past 2 years while investors and their capital watch for a break either side of the recent high and low marked on the chart.
This study also tells me in the absence of an obvious buy signal from an ‘extreme low moment’ along with the index unable to make a new ‘higher high’, my bias is for lower prices.
Other studies also inform me that the current upward trend is weak.
When the 10 year bond yield RSI moves above a reading of 60 on a Monthly basis coincides with yields being either 2.5 or 3 standard deviations above the rolling mean.
A weekly Macro, Cross Asset review of prices trading at extremes which may generate future investment ideas and opportunities.
The following assets (on a weekly timeframe) registered an Overbought or Oversold reading and/or have traded more than 2.5 standard deviations above or below its rolling mean.
Extremes “above” the Mean (at least 2.5 standard deviations)
U.S. 10 year bond yield minus U.S. 5 year bond yield
Overbought (RSI > 70)
Australian 3 month bank bill yield
Silver (in AUD)
Sugar
The Overbought Quinella – Both Overbought and Traded at > 2.5 standard deviations above the weekly mean)
None
Extremes “below” the Mean (at least 2.5 standard deviations)
China 10 year government bond yields
WTI Crude Oil
S&P GSCI (commodities) Index
Brent Crude Oil
Corn
Soybeans
Wheat
Oversold (RSI < 30)
JKM LNG Gas
Lithium Hydroxide
KBW Banking Index
The Oversold Quinella – Both Overbought and Traded at > 2.5 standard deviations above the weekly mean)
U.S. 5 year bond yield minus U.S. 3 month bond yield
Notes & Ideas:
This week markets were generally quiet.
Equities were muted again for another week as corporate earnings season was winding up. Most continue last week’s slight bias towards weaker prices.
For instance, the U.S. Midcaps and Smallcaps each fell 1.2% and 0.5% compounding last week’s corresponding respective declines of 0.3% and 1%.
Apart from the U.S. Bank Index exhibiting a notable loss, very few indices appear in this weeks list.
For the week, the ASX 200 fell 1.2% and the ASX Small Caps eeked out a return of 0.1%.
The story of trendless equity markets continues.
Government bond yields rose in Australia and Japan while they fell in Europe and the United States.
The U.S. 5 year bond yield minus U.S. 3 month bond yield spread (or yield curve) is still Oversold, which means something.
Commodities continue host most of the action with the S&P GSCI Index hitting an oversold extreme aided by the weighting of decline seen amongst various energy contracts.
Gasoil and Heating Oil achieved their long term mean reversion as cited in last weeks publication.
JKM LNG closed at its lowest point since June 7, 2021
Softs bounced by the week’s close with a few still registering Oversold readings.
Cattle has now fallen 7% oil the past 2 weeks.
Sugar broke its 6 week winning streak and Australian Coking Coal ended its 5 week downdraft.
Heating Oil’s losing weekly streak has extend to 6 and Lithium’s in now 11 straight.
Amongst currencies, the EUR saw weakness and the AUD firmed up from recent Oversold levels.
The currencies trading at extremes last week are no longer so.
The larger advancers over the past week comprised of;
Australian Coking Coal 4.3%, Hot Rolled Coil Steel 3%, Lumber 2%, Tin 4.5%, Nickel 4.1%, Cotton 3.8%, Uranium 2.3%, Silver in AUD 2.4%, Corn 2%, Oats 5.5%, Rice 5.2%, Wheat 4.2%, HSCEI 1.4% and the Nasdaq Biotech Index rose 1.8%.
The group of decliners included;
Rotterdam Coal (6.8%), WTI Crude Oil (7.1%), Gasohol (3.5%), Lean Hogs (5.2%), Heating Oil (2.6%), JKM LNG (2%), Cattle (2.2%), Natural Gas (11.3%), Platinum (2%), Gasoline (6%), S&P GSCI (3.4%), Rubber (1.7%), CRB Index (2.4%), Dutch TTF Gas (5.1%), Urea (U.S. Gulf (2%), Brent Crude Oil (6.2%), KBW Banking Index (7.4%), Oslo (1.8%) and Russia’s MOEX fell 3.7%.
The Comex Copper price (current forward month is $3.86) is giving me an embryonic sell signal.
This means its early and the trend is lacking strength….because it’s early.
It’s not a ‘grand daddy’ of sell signals but one that needs to be watched, possibly to washout the participatory and meandering players before longer term bulls get set.
However, lower copper prices also have a hand in preceding lower bond yields, weaker GDP readings, lower commodity sensitive currencies and a decline in stock prices.
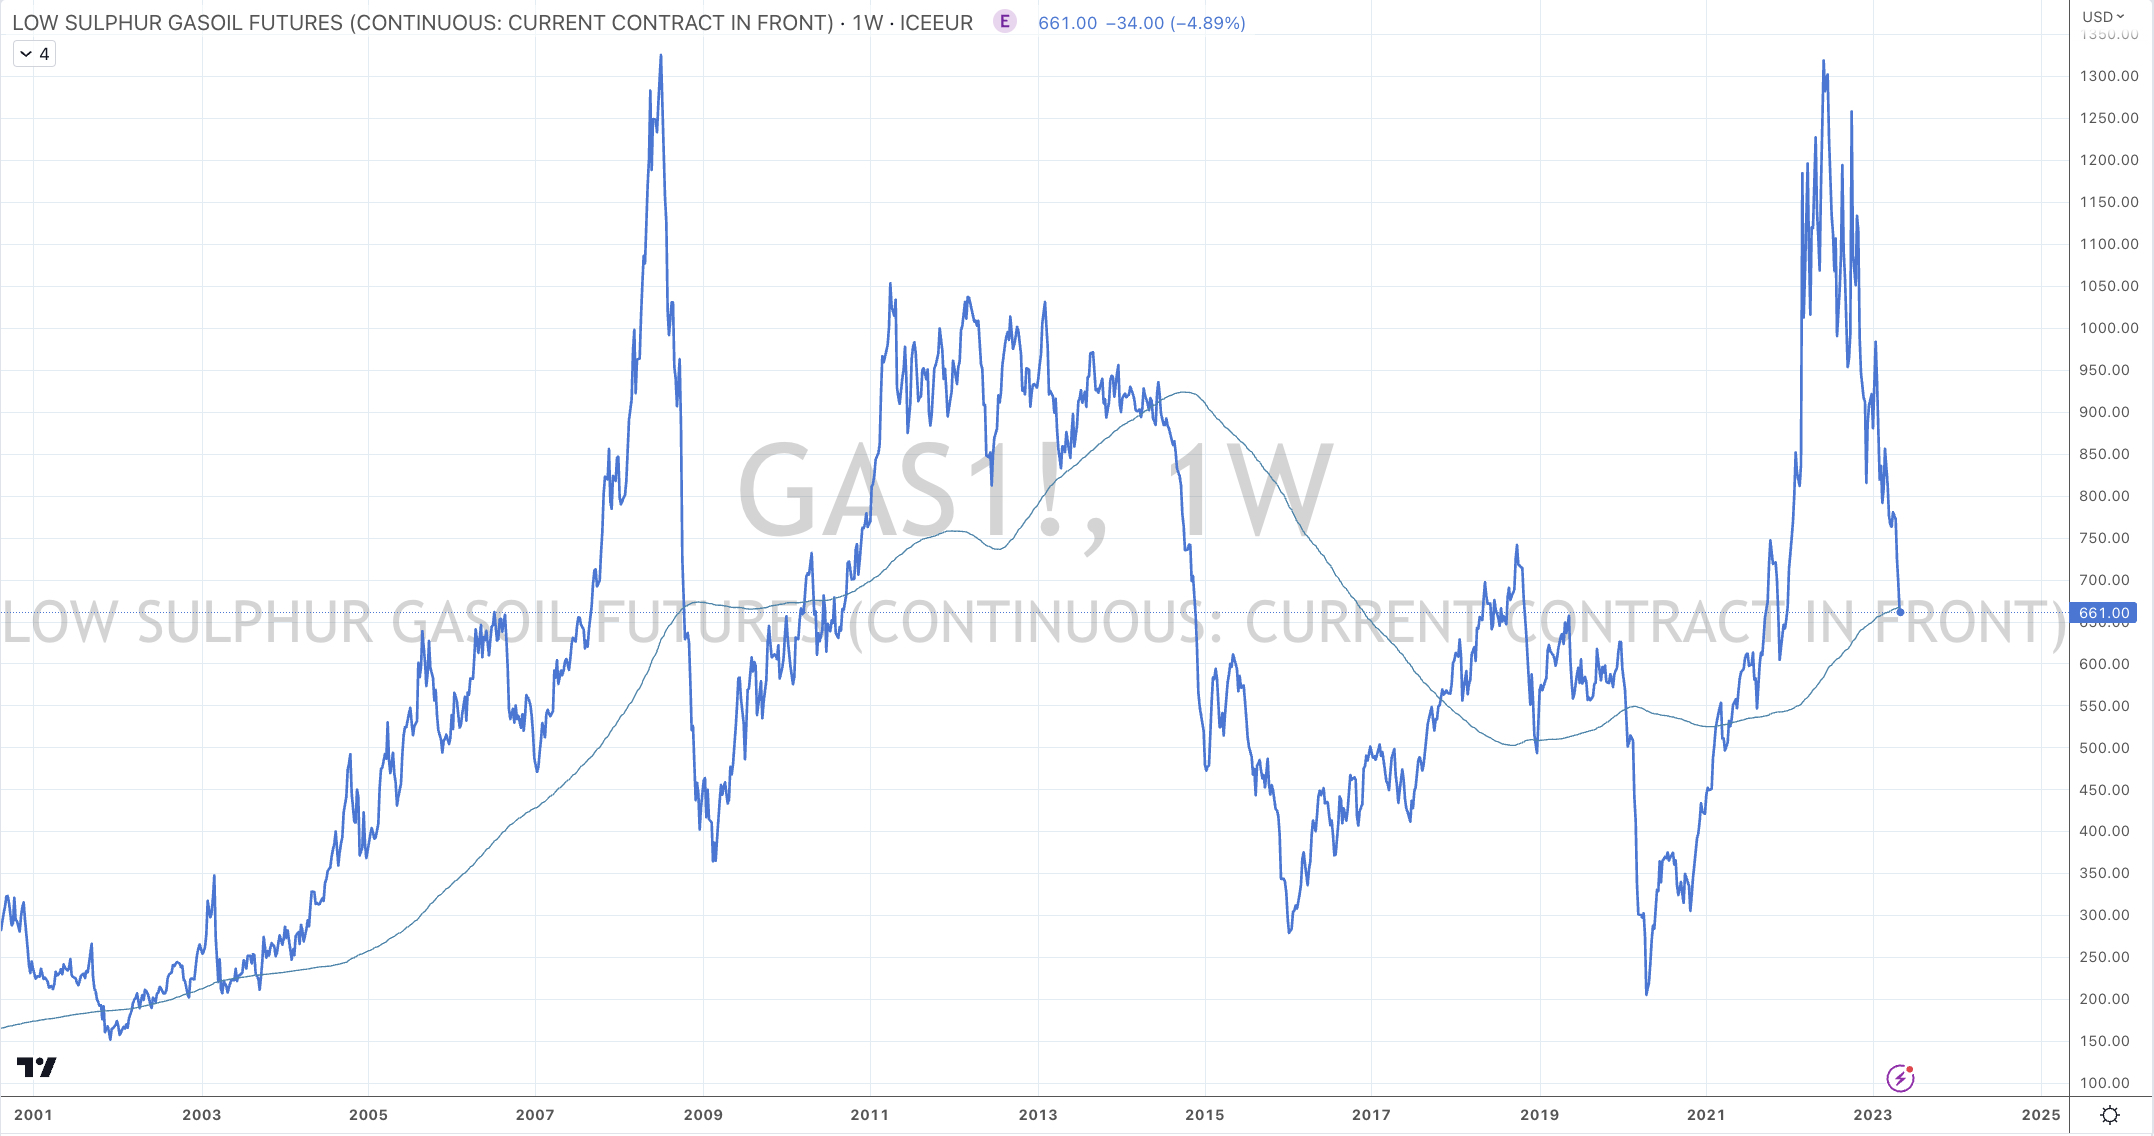
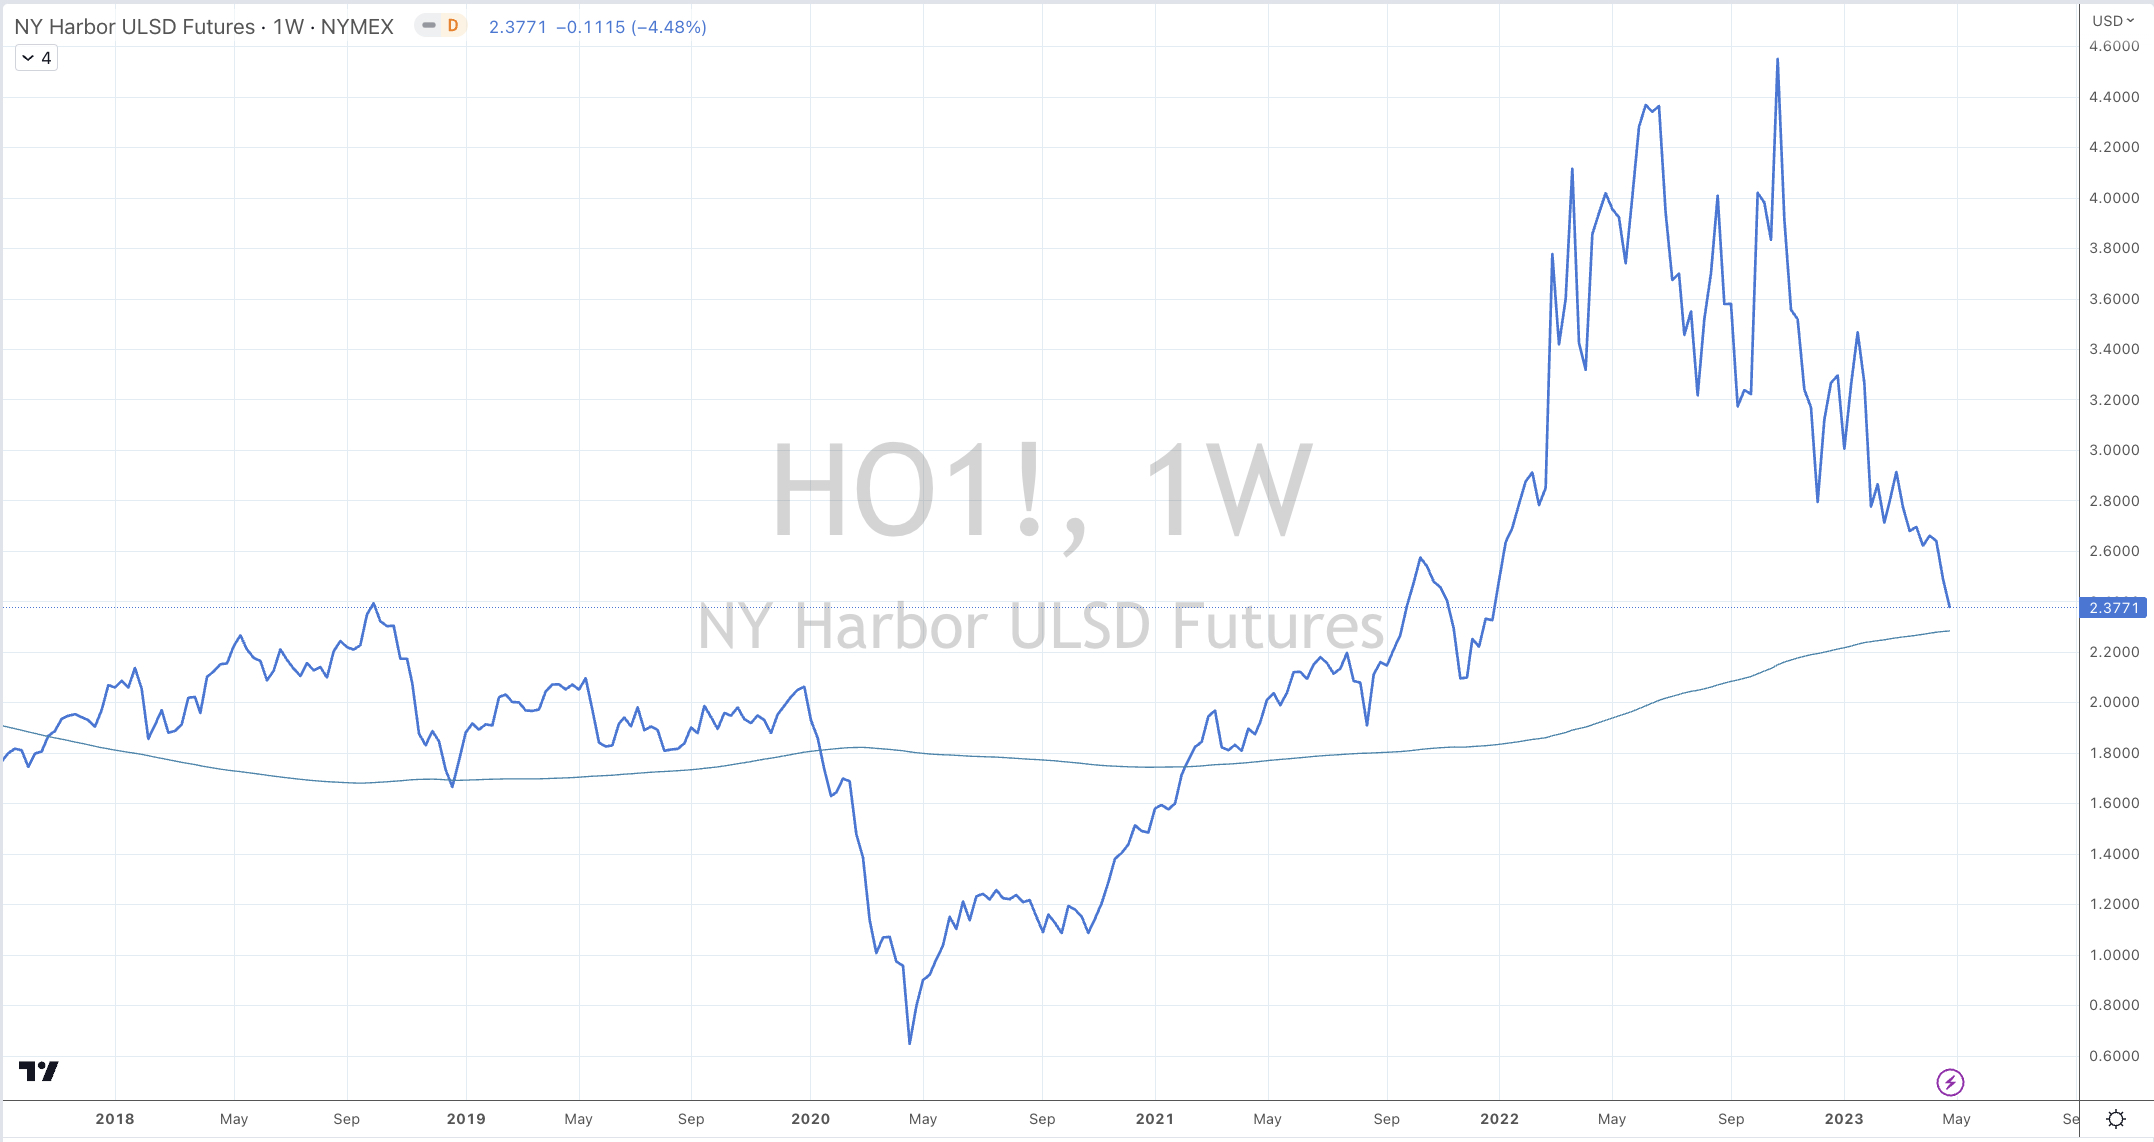
Today, Gasoil (diesel) and Heating Oil completed their mean reversion back to their 200 week moving average. This was prompted in this weekends edition of Macro Extremes.
They join Crude Oil and Natural Gas who achieved this milestone a couple months earlier.
However, ‘achieving’ mean reversion doesn’t translate to a ‘Buy’ signal.
This observation is a reminder to not have chased prices higher, especially at the stratospheric levels seen at the onset of the Russian-Ukraine war.
You would think lower fuel costs should be good for truckers and courier services, however there is a perverse trend that diesel prices lead the stock prices of ‘transporters’ lower.
This is a result of their fuel forward purchases, hedges and a lag in working off inventories.
This is terrific for today’s spot buyers.
Gasoil has halved since that high.
Although, falling Gasoil prices translates into predicting weakness in the Dow Jones Transports Index,
and a lower transports index usually mimics a decline in the S&P 500,
which coincides with weakness in the U.S. Dollar and broadly lower commodity prices,
which portends lower interest rates (perhaps the 2 year) yields,
which might be a positive for technology stocks.
But amongst this story telling, Gasoil, Heating Oil and Crude Oil will find a floor before it becomes mainstream news.
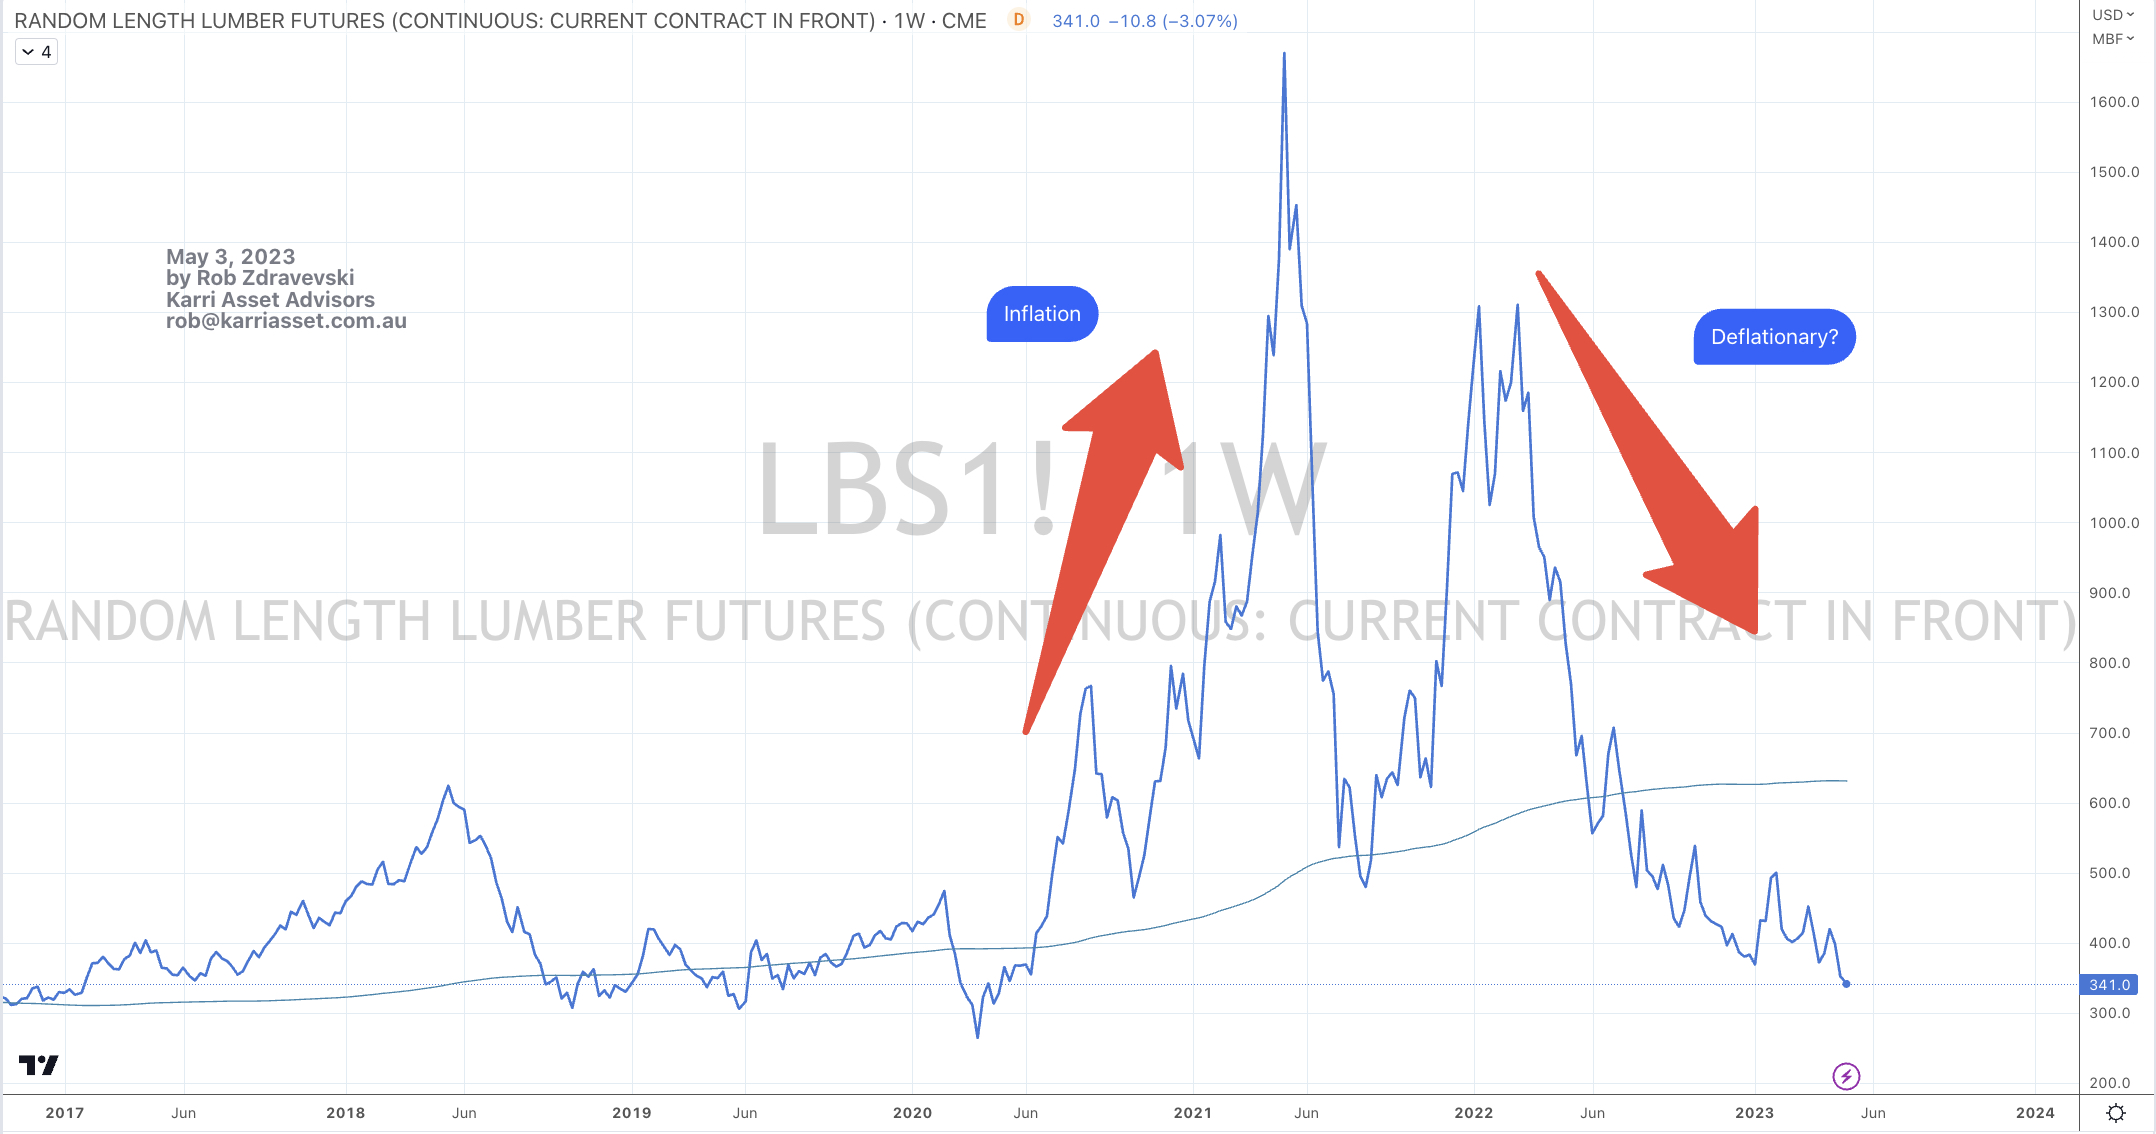
The last time Lumber saw a closing price this low was 3 years ago.
But it’s not telling me to buy it yet.
Following the buying frenzy to secure supply, this savage washout and mean reversion will have a deflationary effect but also create discounting pressures on those whom are holding inventory and insisting on charging last years prices.
There will be a lag for these ‘market’ prices to flow through to your lumber yards and suppliers (why drop prices when you can maintain a story about scarcity and supply blockages) but at least you’ll know that lower prices will filter through.
Furthermore, those who have delayed construction projects should be rewarded.
Whilst, it’s relevant to note that the price of Lumber also has a correlation with the share prices of listed homebuilders.
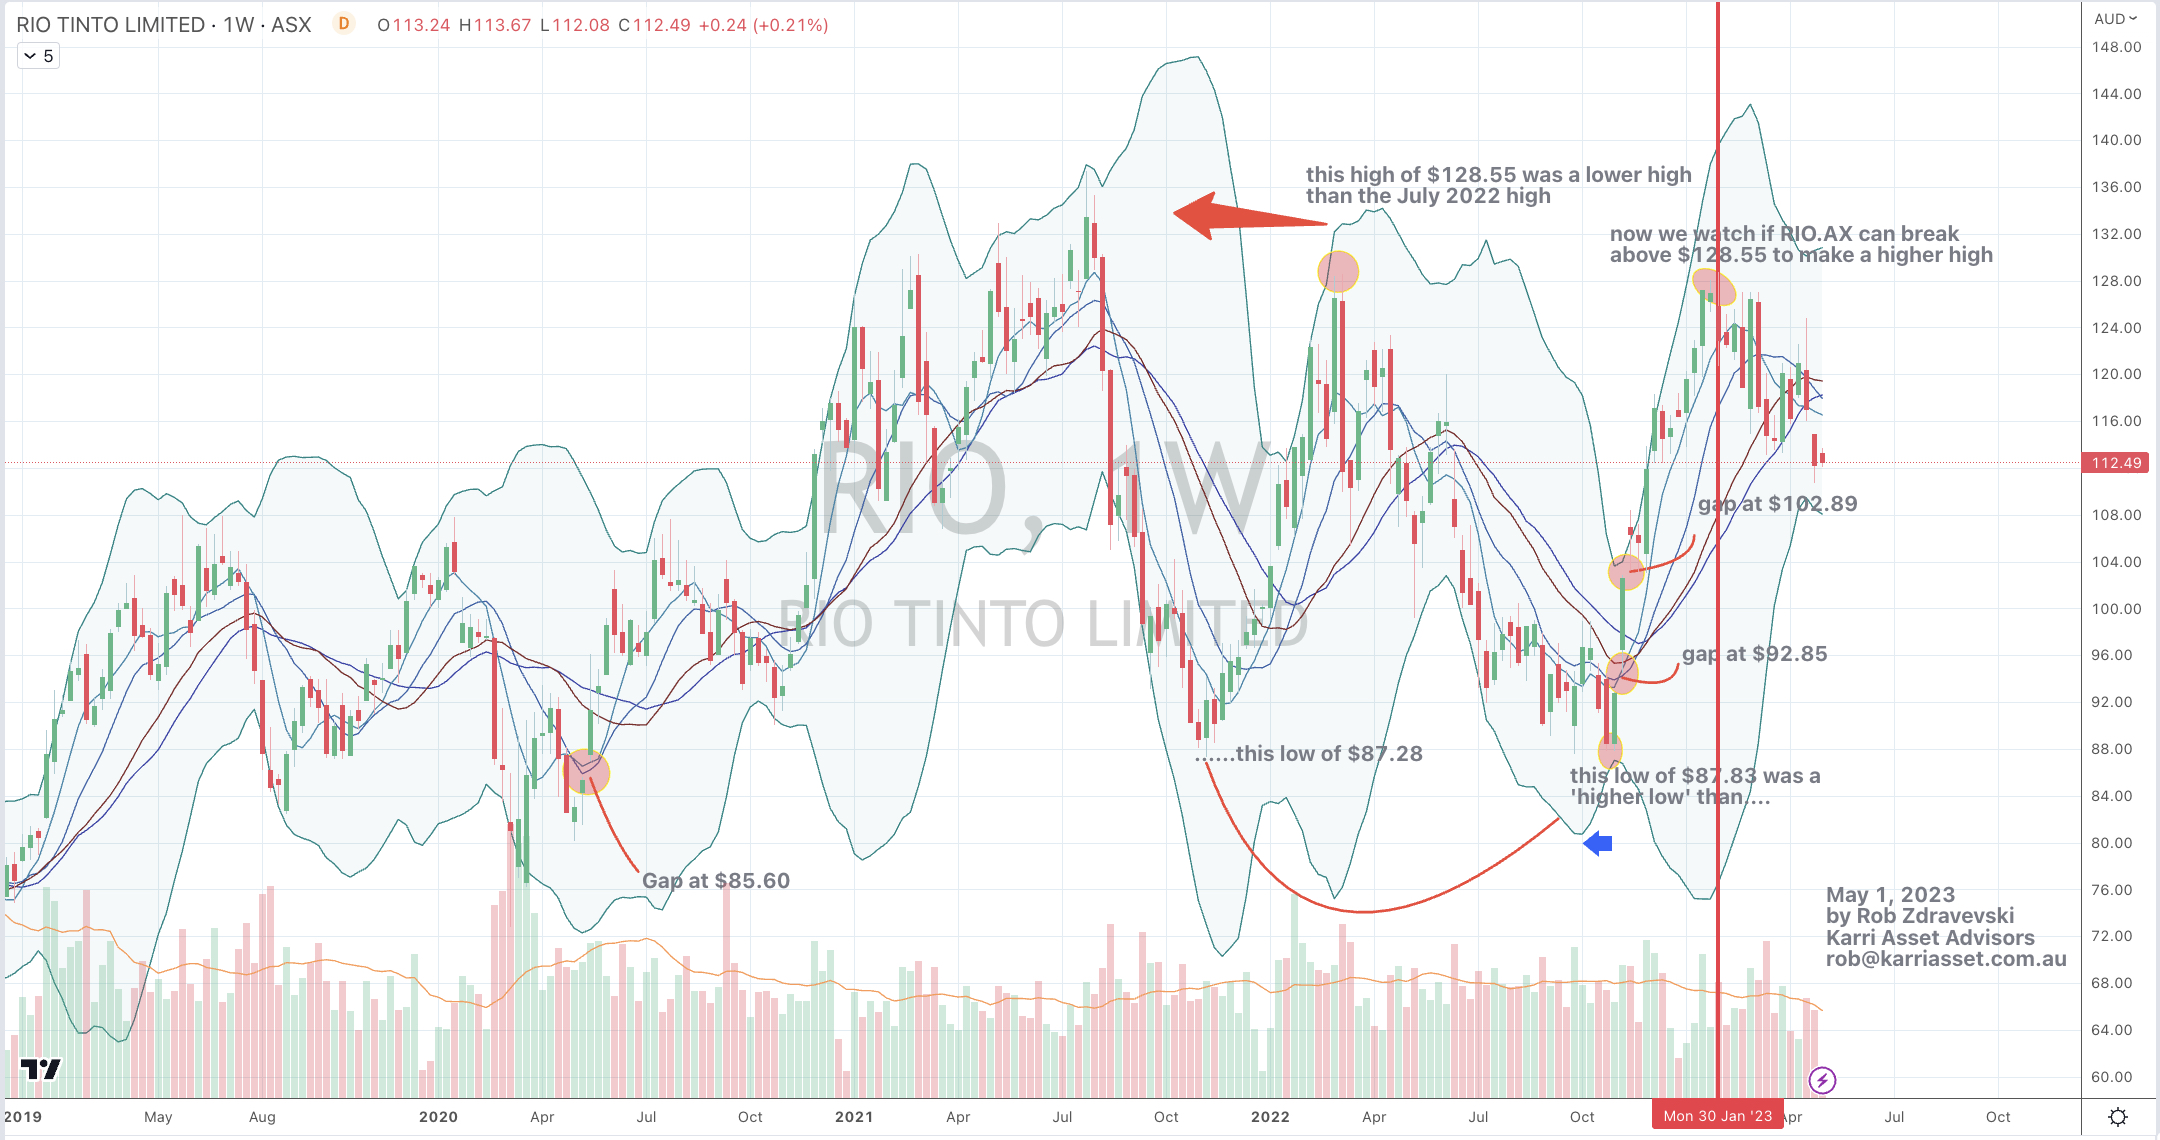
Those going long around the recent $128 price level may have been deked into thinking new highs were pending.
Beyond some underlying thoughts that Iron ore prices were temporarily “full” around the $125 mark, my lack of conviction for the Rio Tinto’s share price is sympathetic with my view where I think broader commodity prices and the Australian Dollar are headed.
Furthermore, it has risen 50% from a low seen on November 1st, 2022.
The chart below shows an empirical study of the percentage that the price of sugar has traded above its 200 week moving average.
Ordinarily, such rising inputs would normally affect the margins of chocolatiers, confectioners and soft drink manufacturers, however it seems these companies have managed to pass on higher costs under the story of wide spread inflation.
Many of their stock prices are performing very well.
The rising price of sugar is also a boon to sugar cane growers (with Brazil and India being the world’s two largest producers) and those around Mackay, Queensland.
Today, the price of sugar is trading in rarified air.
It is also registering overbought tendencies.
And when my analysis incorporates the outsized ‘long’ positions in the Commitments of Traders then I will recognise it as the momentum trade that it is.
In other words, the probability of higher prices diminishes under the current conditions and any unwinding of those non-commercial ‘trading longs’, can see a sharp drop and test of that 200 week moving average.
A weekly Macro, Cross Asset review of prices trading at extremes which may generate future investment ideas and opportunities.
The following assets (on a weekly timeframe) registered an Overbought or Oversold reading and/or have traded more than 2.5 standard deviations above or below its rolling mean.
Extremes “above” the Mean (at least 2.5 standard deviations)
EUR/USD
DKK/USD
AUD/IDR
Overbought (RSI > 70)
Silver (in AUD)
Gold (in AUD)
Russia’s MOEX Index
The Overbought Quinella – Both Overbought and Traded at > 2.5 standard deviations above the weekly mean)
Sugar
EUR/AUD
Extremes “below” the Mean (at least 2.5 standard deviations)
China 10 year government bond yields
U.S. 10 year bond yield minus German 10 year bond yield
Iron Ore
Corn
Oats
Soybeans
Oversold (RSI < 30)
U.S. 5 year bond yield minus U.S. 3 month bond yield
Australian Coking Coal
JKM LNG Gas
Lithium Hydroxide
AUD/GBP
The Oversold Quinella – Both Overbought and Traded at > 2.5 standard deviations above the weekly mean)
None
Notes & Ideas:
Equities generally had quiet week, again, with a slight bias towards weaker prices.
For instance, the S&P 500 rose 0.9%, while Midcaps and Smallcaps fell 0.3% and 1% respectively.
The SOX, FTSE and ASX smallcaps fell between 0.3% and 0.9% for the week, while the ASX 200 rose 0.2%.
Trend less equity markets remains the trend, for now.
Government bond yields fell. While my trend analysis favours lower yields, pattern recognition work tells me it’s prudent to identify the sideways and ‘holding’ pattern seen of late and wait for new ‘higher high’ or ‘lower low’ to be recorded.
The Japanese 10 year bond yield recorded the most notable drop from 0.46% to 0.38%.
The most action was seen in Commodities as it had the active week in some time.
Coffee, Cocoa, Cattle, Middle East Urea and Hot Rolled Coil Steel are no longer sporting overbought tendencies.
Sugar’s 6 week rally has now amounted to a 27.5% return.
In fact, the streaks amongst commodity prices have returned. Heating Oil has declined for 5 consecutive 5 weeks, Lithium has sunken for 9 weeks, Australian Coking Coal is in a 5 week downward streak (9 of its past 10 have been negative) while the EUR/USD is in its 9th rising week.
We saw a continuation of last week’s weakness in energy, copper and soybeans with more agricultural (corn and wheat) joining the declines.
Other observations include, Gasoil (diesel) and Heating Oil are 3% from reaching a long awaited men reversion to its 200 week moving average and Copper broke below a support line.
The run in the PGM’s (platinum and palladium) took a breath this past week with the former breaking its 6 week rising streak.
Australian Coking Coal joined the oversold ranks having now seen a 39% decline over the past 5 weeks whilst also mean reverting back to its 200 week moving average.
Corn’s nearest contract fell 12% this past week while the next contract month fell 14%. The pertinent reason for mentioning the subsequent month’s contract this week, is that it registered quinella of oversold readings and it also mean reverted to its 200 week moving average.
And Lumber has closed at its lowest level since mid-May 2020.
Remember all those stories about rising timber prices affecting homebuilding costs?
Euro strength dominated action amongst currencies.
The AUD was weak against most and many currencies which prompts me to say Australian assets are on sale against the GBP and EUR.
While the BRL/USD takes break from trading at an extreme, it continued to strengthen and we also saw the Danish Krone trade into overbought territory against the USD.
The larger advancers over the past week comprised of;
Baltic Dry Index 4.8%, Lean Hogs 3.4%, Natural Gas 7.9%, Sugar 6.1%, Urea (U.S. Gulf) 3.2%, Urea (Middle East) 9%, Gold in AUD 1.5%, Nasdaq 100 1.9%, Sensex 2.4%, Mexico 1.8%, Chile’s Santiago equity index rose 3.6%.
The group of decliners included;
Australian Coking Coal (13.7%), Rotterdam Coal (2.1%), Brent Crude (1.4%), Copper (2.3%), Heating Oil (4.5%), Hot Rolled Coil Steel (9.3%), JKM LNG Gas (2.8%), Coffee (2.9%), Lumber (11.6%), Cattle (4.9%), Lithium (6.6%), Tin (5.7%), Nikkei (5%), Palladium (6.1%), Platinum (4.3%), Gasoline (2.8%), S&P GSCI (1.6%), Dutch TTF Gas (4.1%), Corn (11.8%), Oats (6.5%), Soybeans (2.1%), Wheat (5.8%), KBW Bank Index (2%), DJ Transports (2.7%), MIB (2.4%), IBEX (1.9%), KOSPI (1.7%), Nasdaq Biotech Index (2%) and Thailand’s SET Index fell 1.9%.