A weekly Macro, Cross Asset review of prices trading at extremes which may generate future investment ideas and opportunities.
The following assets (on a weekly timeframe) registered an Overbought or Oversold reading and/or have traded more than 2.5 standard deviations above or below its rolling mean.
Extremes “above” the Mean (at least 2.5 standard deviations)
Copper
CNH/USD
Overbought (RSI > 70)
German 2 year government bond yields
Gold (in Canadian Dollars)
Cattle
Istanbul’s BIST Index
SGD/USD
The Overbought Quinella – Both Overbought and Traded at > 2.5 standard deviations above the weekly mean)
Japanese 10 year bond yield
Extremes “below” the Mean (at least 2.5 standard deviations)
Turkish 10 year government bond yields
Oversold (RSI < 30)
U.S. 5 year yield minus U.S. 3 month bill yield spread
Chile 10 year bond yield
Urea (U.S. Gulf)
The Oversold Quinella – Both Overbought and Traded at > 2.5 standard deviations above the weekly mean)
None
Notes & Ideas:
This week’s biggest news was the continuing rally in equities in Europe.
Over the past 2 weeks, the AEX and the DAX are both up 8.3%.
Other parts of the world rallied, breaking multi-week losing streaks.
And the 1.9% weekly advance in the U.K.’s FTSE 100 saw it close at an all-time high.
Who would’ve thought!
while Australia’s ASX Small Caps index has risen 6% in the past 2 weeks.
Bond yields fell once again.
We are seeing the simultaneous buying of bonds and equities.
For example, since October 17th, 2022, (when many bonds were hitting ‘weekly’ Oversold Extremes and equities were not) the IEI bond ETF has risen from a price of $112.30 to $117.13, which is an advance of 4.3%.
The IEF bond ETF has risen 7% over the same time frame…..the S&P 500 has climbed 6.6% since that same date.
Inversely, Canadian 10’s are now 2.90% and no longer 3.75%. U.S. 10’s are 3.51% and not 4.33%.
A host of commodity prices rose this week with the recently depressed Aluminium and Lumber posting the largest gains.
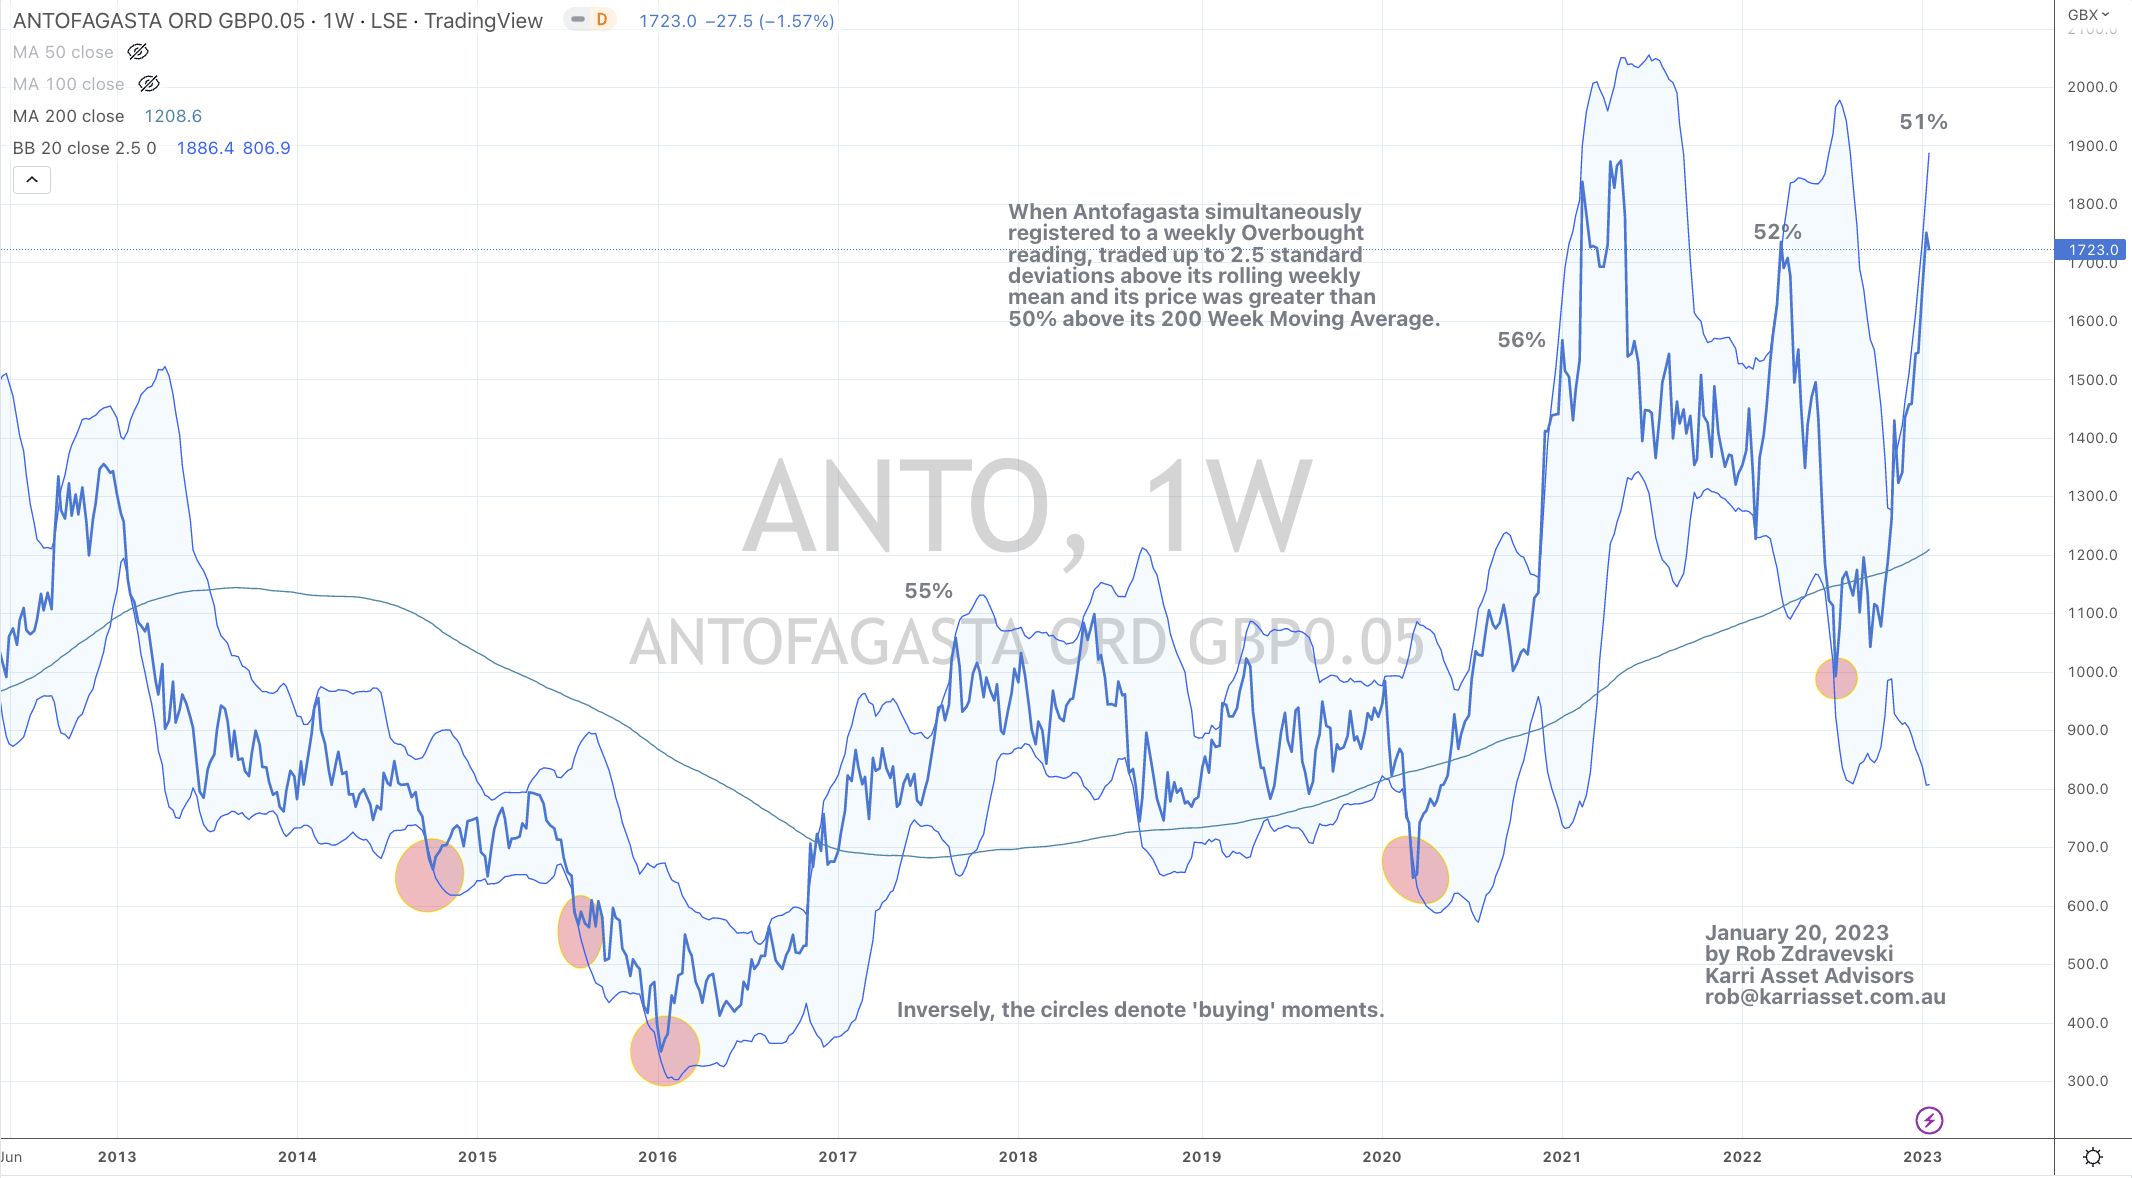
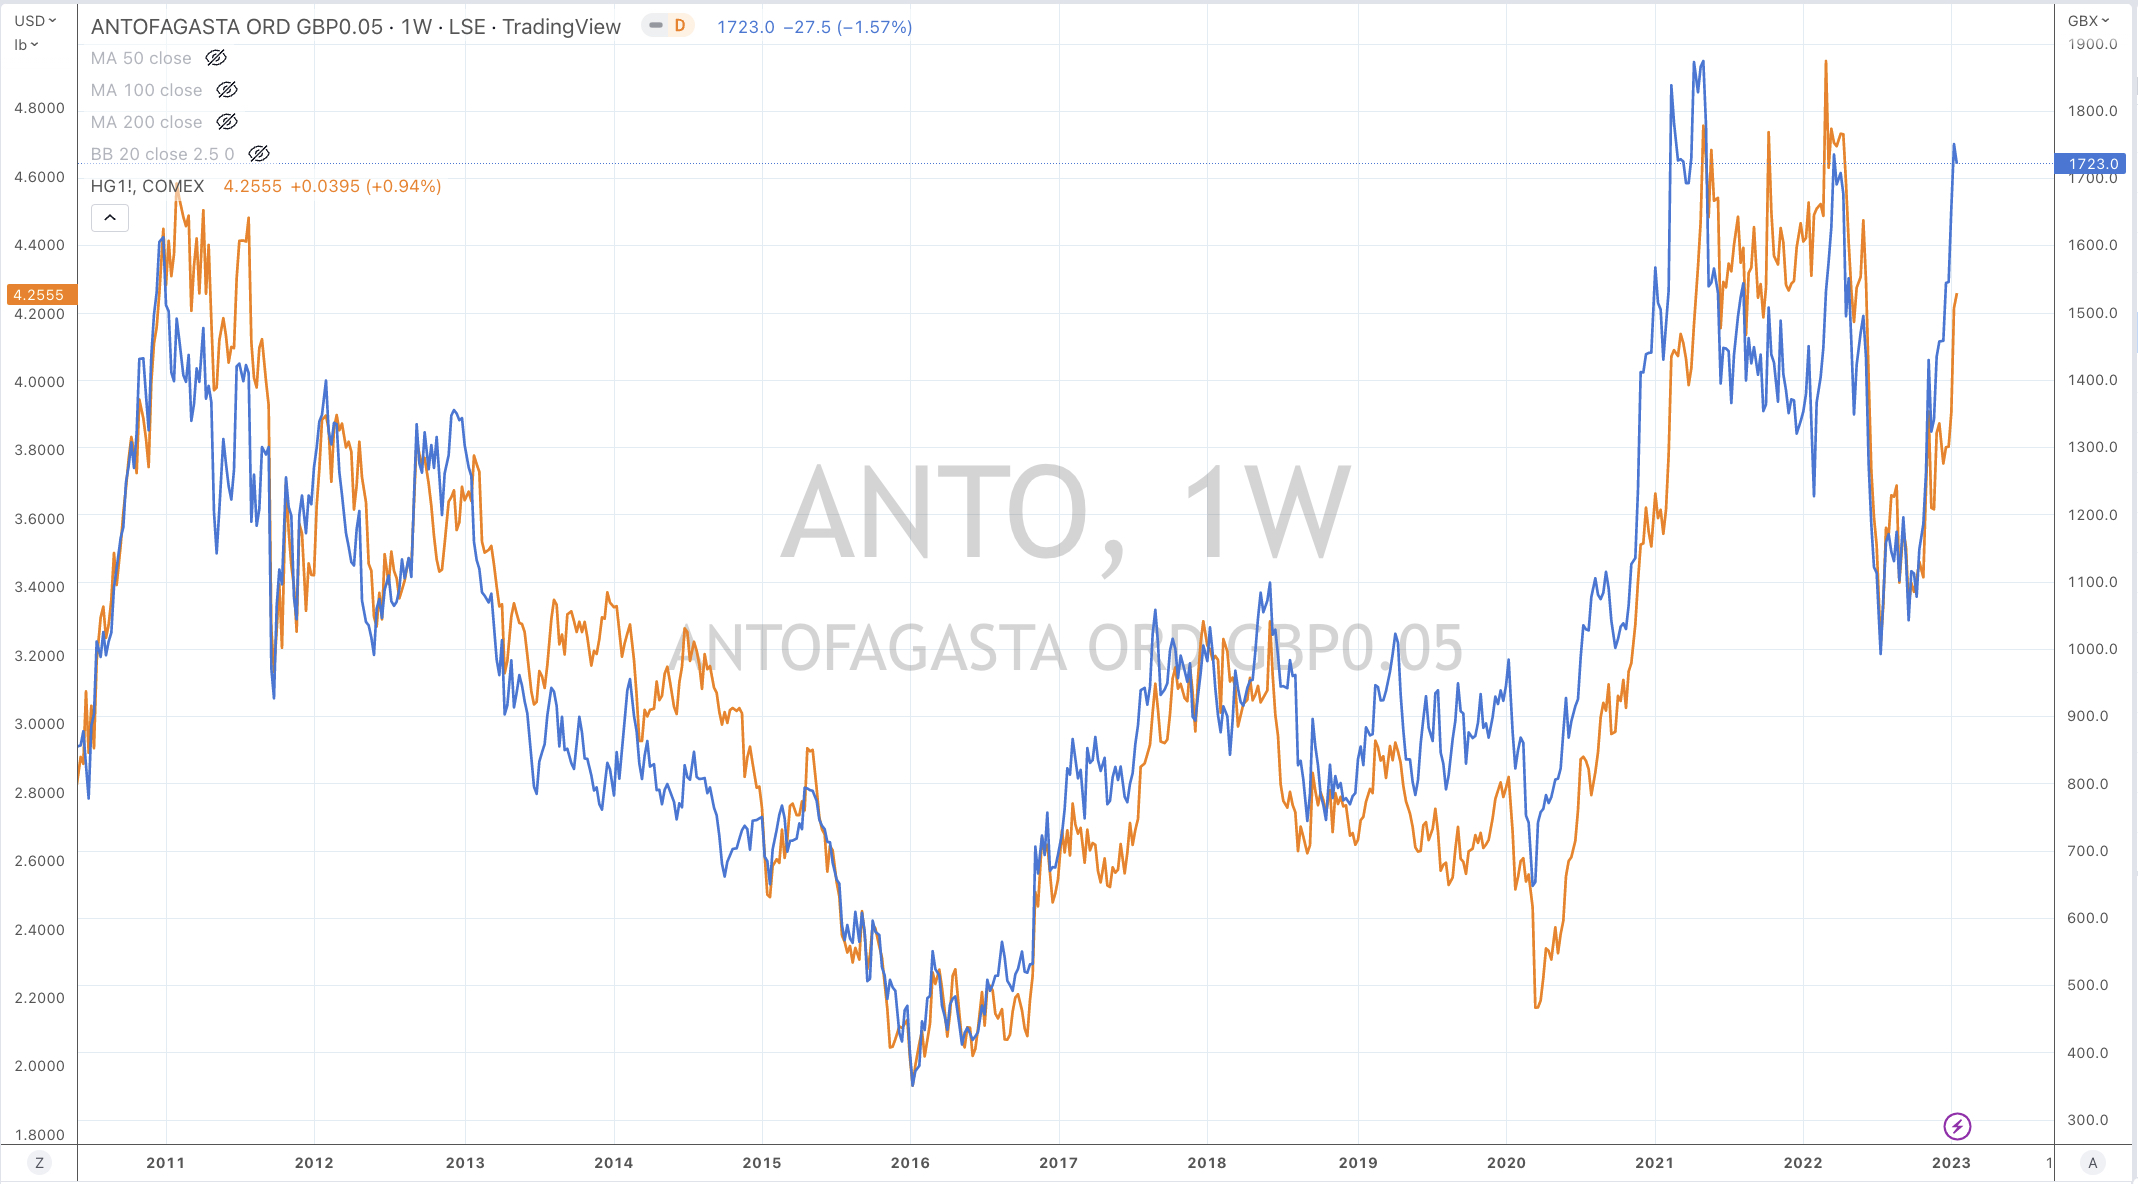
Copper made a new visit to an Overbought criteria.
While most of the energy complex rallied, I’m not convinced in a change of trend as Crude, Gasoil and Heating Oil had ‘inside week’s’.
In the negative category were the various Gas contracts with the Japan Korea LNG Marker (JKM) and Dutch TTF Gas prices closing at their lowest levels in 15 months.
JKM is now $20 as opposed to its $68 only 5 months ago
And Dutch TTF Gas is $65 and no longer the $320 we saw in August 2022.
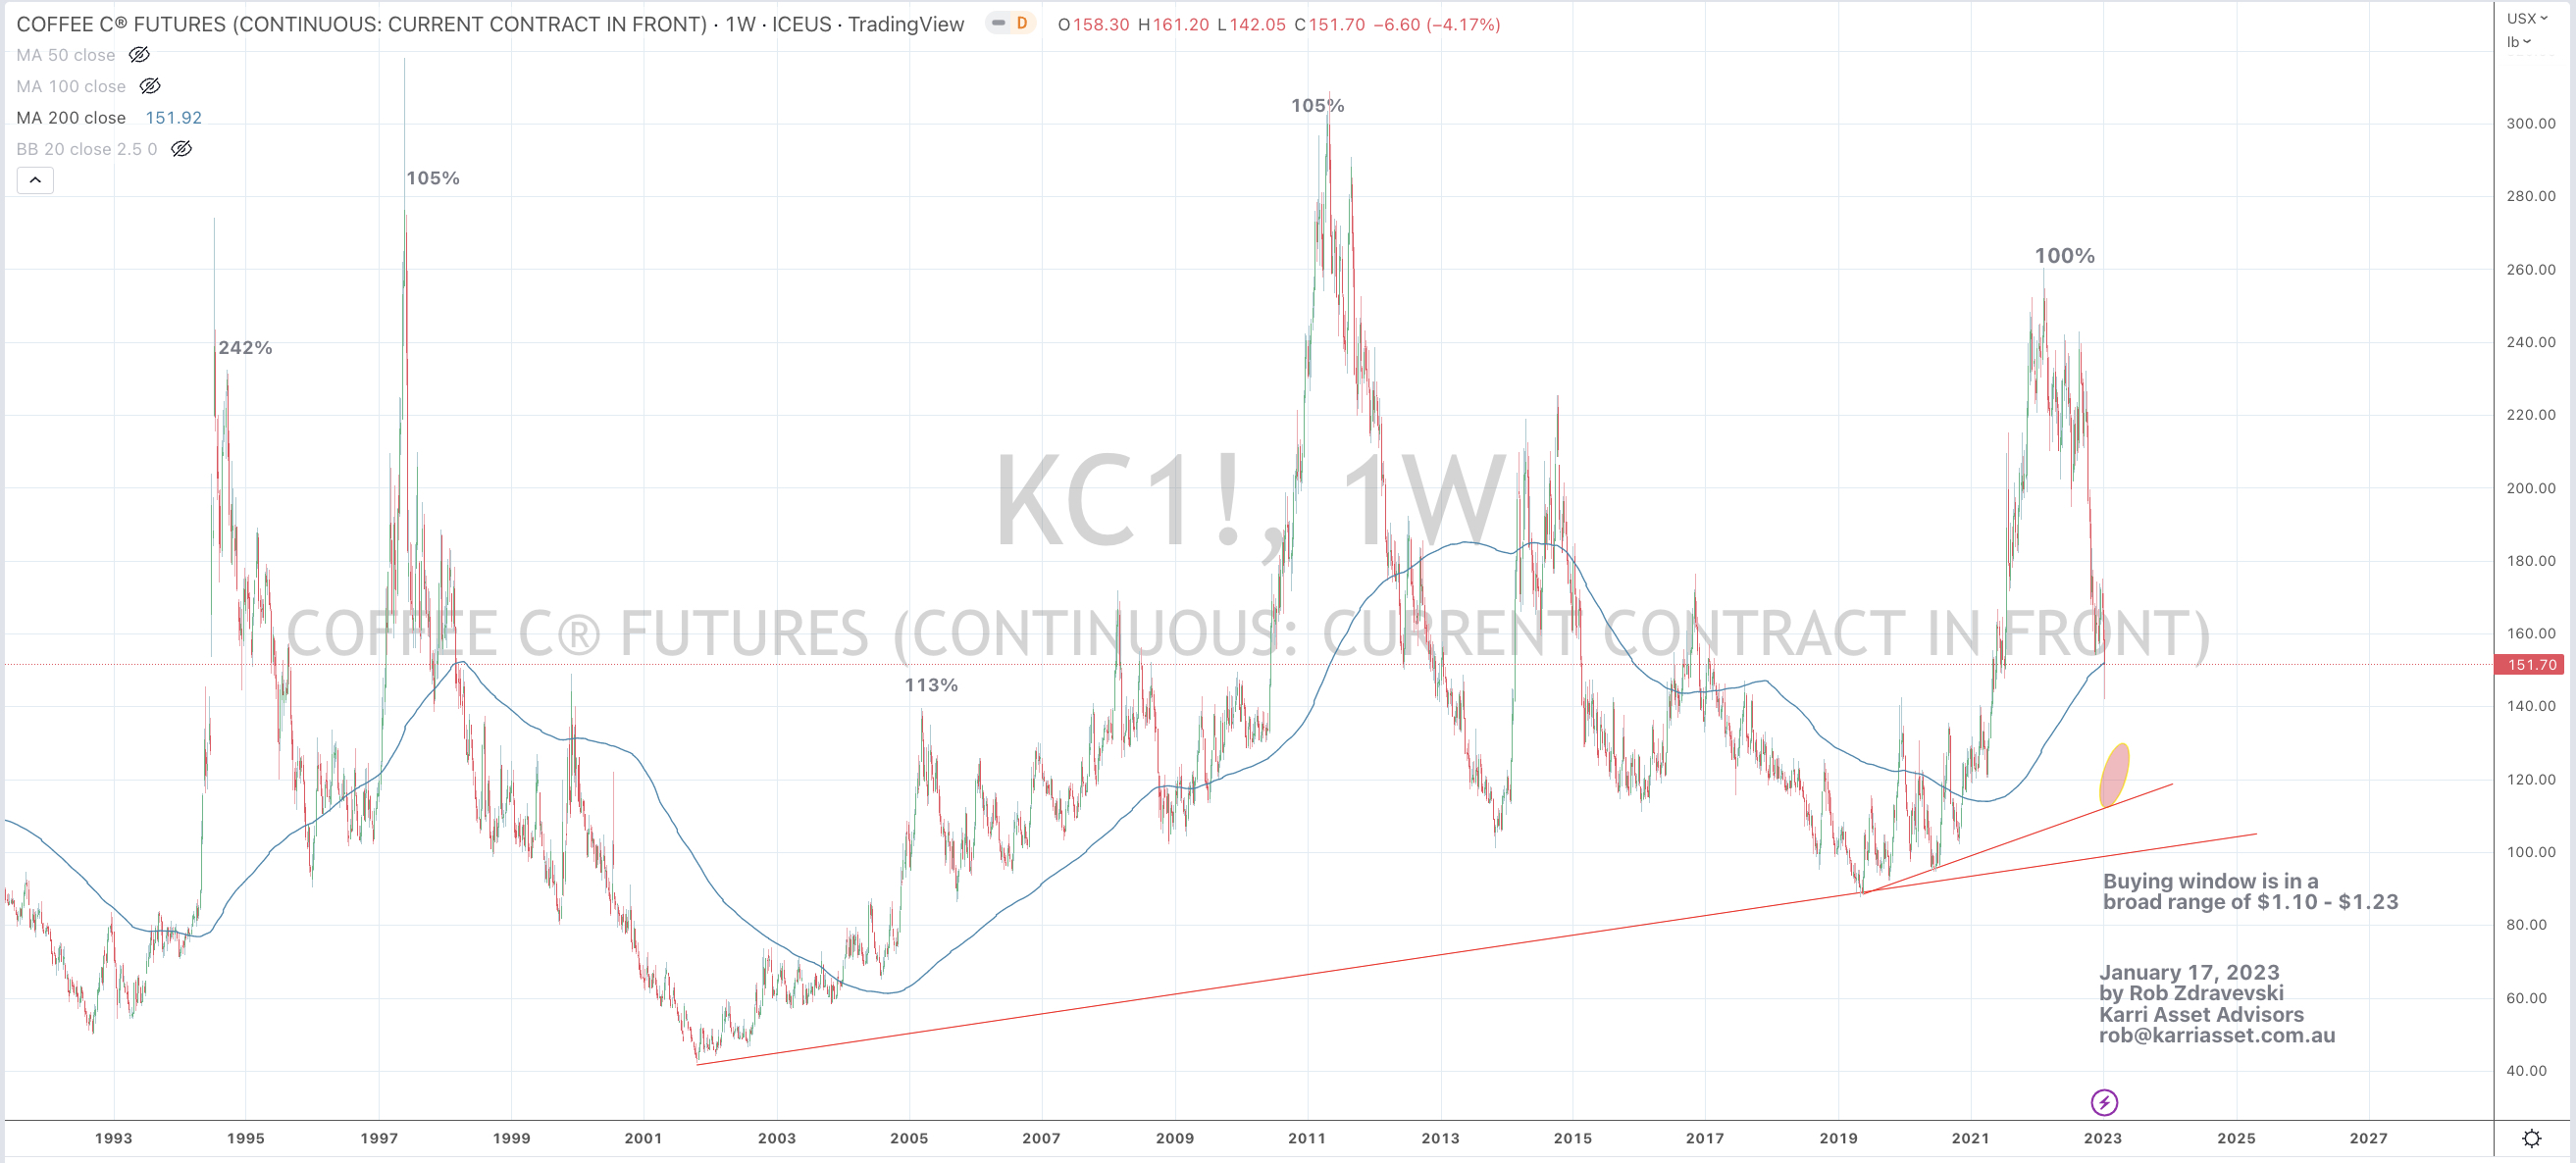
Furthermore, Henry Hub Natural Gas has tanked 64% in the past 5 weeks, Rotterdam delivered Coal has slumped 42% in 6 weeks, Coffee has declined 11% in only 3 weeks and Nickel has fallen 11% in the past 2 weeks.
On a jolly note, Orange Juice and Cattle are flirting with all-time highs.
I’m talking about prices higher than the pre-Billy Ray Valentine years.
The larger advancers over the past week comprised of;
Aluminium 13.9%, Bloomberg Commodity Index 3.2%, Cocoa 1.8%, China Coal 5.1%, WTI Crude Copper 7.8%, Heating Oil 8.4%, Lumber 17.2%, Tin 6.5%, Gasoline 12.8%, Sugar 4.1%, CRB Index 4.2%, Brent Crude 8.8%, Uranium 2.1%, Silver 1.8%, Gold 2.9%, Gold in CAD 2.5%, Corn 3.2%, Oats 5.7%, Rice 2.2%, Soybeans 2.4%, S&P GSCI 5.7%, CSI 300 2.4%, AEX 3.3% KBW Banking Index 2.2%, CAXC 2.4%, DAX 3.3%, DJ Industrials 2%, DJ Transports 3.5%, MIB 2.4%, Nasdaq 100 4.5%, Stockholm 3.7%, Russell 2000 5.4%, S&P SmallCall 600 4.4%, SOX 6.2%, S&P 500 2.7%, TAEIX 3.1%, TSX 2.8%, FTSE 100 1.9%, Australia’s ASX 200 rose 3.1% while the Small Cap Index rallied 2.8%.
The group of decliners included;
Aluminium (5.2%), Rotterdam Coal (1.9%), Baltic Dry Index (16.3%), Lean Hogs (2%), JKM LNG (29.1%), Coffee (4.2%), Natural Gas (7.8%), Nickel (8.3%), Platinum (2.9%), Cotton (4%), Dutch TTF Gas (6.8%), Urea U.S. Gulf (2.9%) and Turkey’s Istanbul BIST Index fell 8.6%.
While I try to include commentary about cumulative and consecutive weekly performances such as the Baltic Dry Index falling 42% over the past 2 weeks or the AUD/GBP continued rally from its bullish outside reversal week (a few weeks back), I recommend that readers reference the preceding weekly editions to help track the continuity of previously mentioned prompts.
January 15, 2023
by Rob Zdravevski
rob@karriasset.com.au