Illusions still apparent

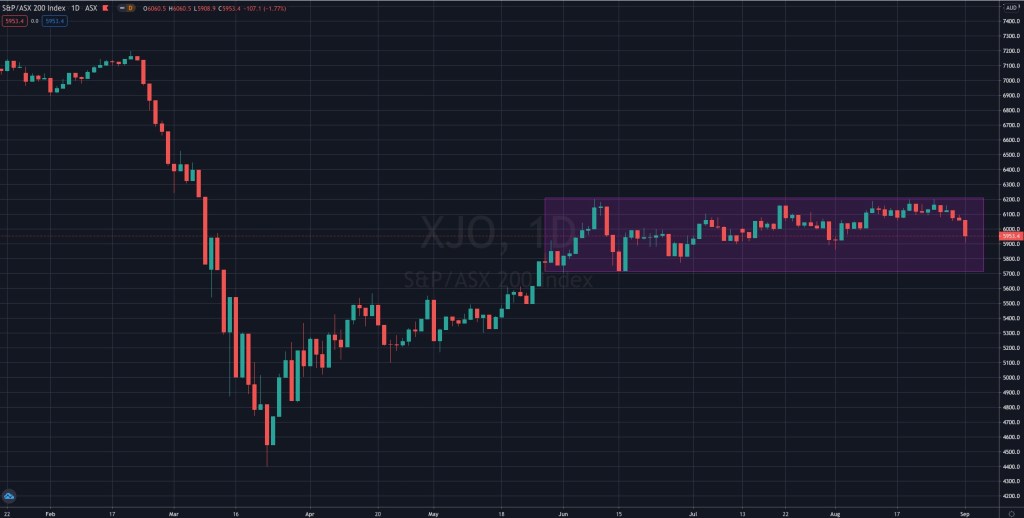
Below is a continuing chart I’ve been posting for a while to disprove the illusion that the Aussie equity market is NOT screaming to new highs.

For the past 3 months, the ASX 200 has been trading sideways and today’s headlines from the Australian Financial Review following todays close of business was…..

“ASX wipes out most of August gains in single session.
The S&P/ASX 200 dropped 1.8 per cent on the first day of September, falling back to where it traded on August 3″

It’s a bit sad that the first day of September’s trading erased the WHOLE month of August’s efforts.

In fact, the ASX 200 is trading back to where it was on June 3rd, 2020.

The age of the stock picker is back….

#asx#asx200#indexing

September 1, 2020
by Rob Zdravevski
rob@karriasset.com.au
AUD – now Overbought at a Weekly Extreme

I feel markets are at another acute point.
It’s not about doom but rather to position for the opportunity.

In this note, I’ll start with the AUD and USD.

Since Buying AUD in the depths of March 2020, I’ve been advising clients to sell AUD against the USD in a tiered fashion at 0.66, 0.69 and 0.71.

With a weaker USD, we have also seen a commensurate advance in commodity prices. Note the link ?

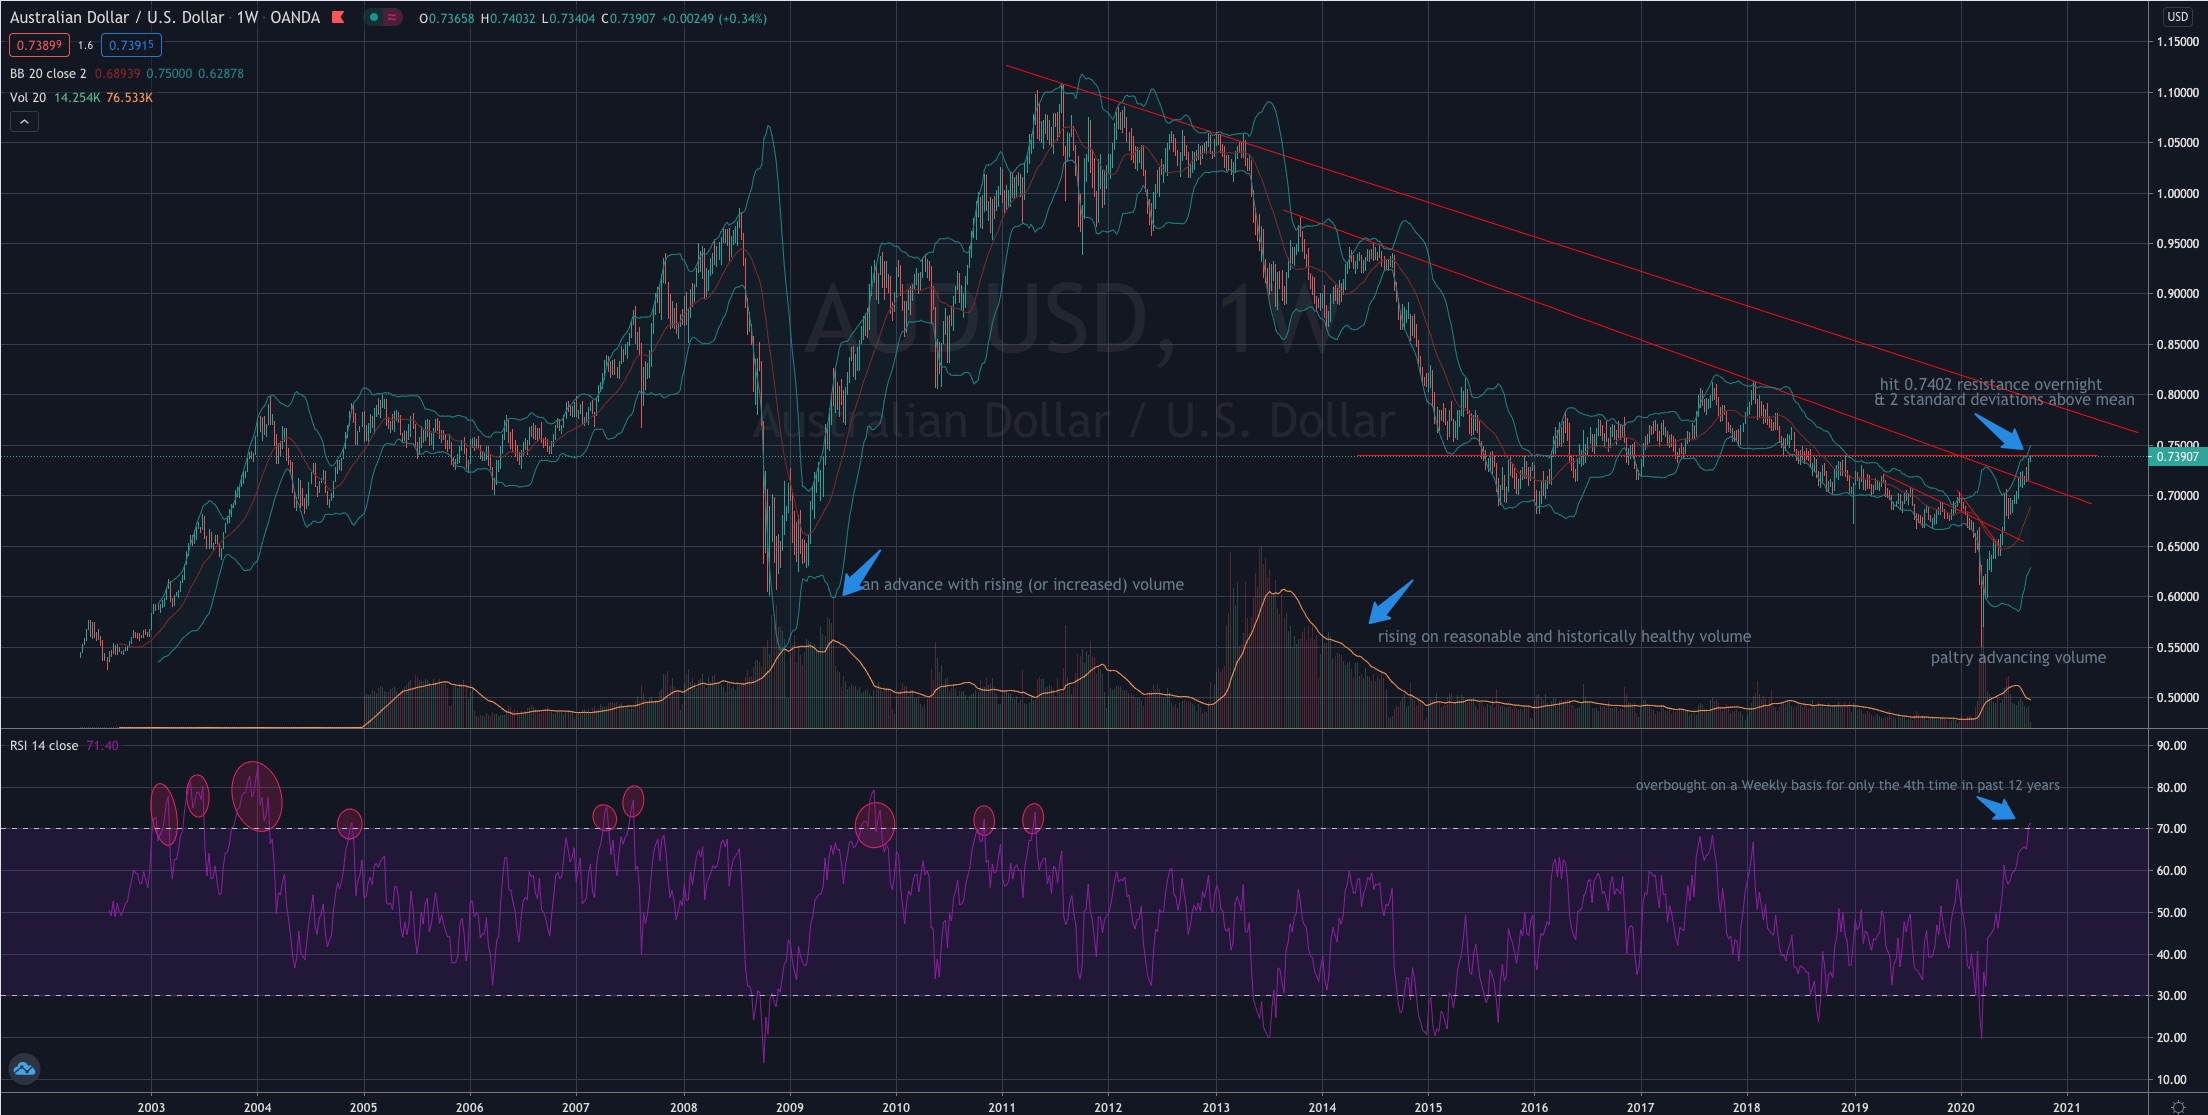
I’ve been banging on about overbought readings recently each time they were registered on the “daily” charts, BUT now, significantly, we are seeing “Weekly” extremes.

Please take a look at the AUD/USD chart below and my annotations within it.

It’s only the 10th time in past 18 years that we have seen this and it’s the first time in 9 years.

I’m not calling a crash and of course and 0.7750 is entirely possible but I want to identify that such extremes are not common. Buying AUD at this end of the pendulums arc warrants thought to the probability of mean reversion.

September 1, 2020
by Rob Zdravevski
rob@karriasset.com.auAUD Weekly

A Bull in China….

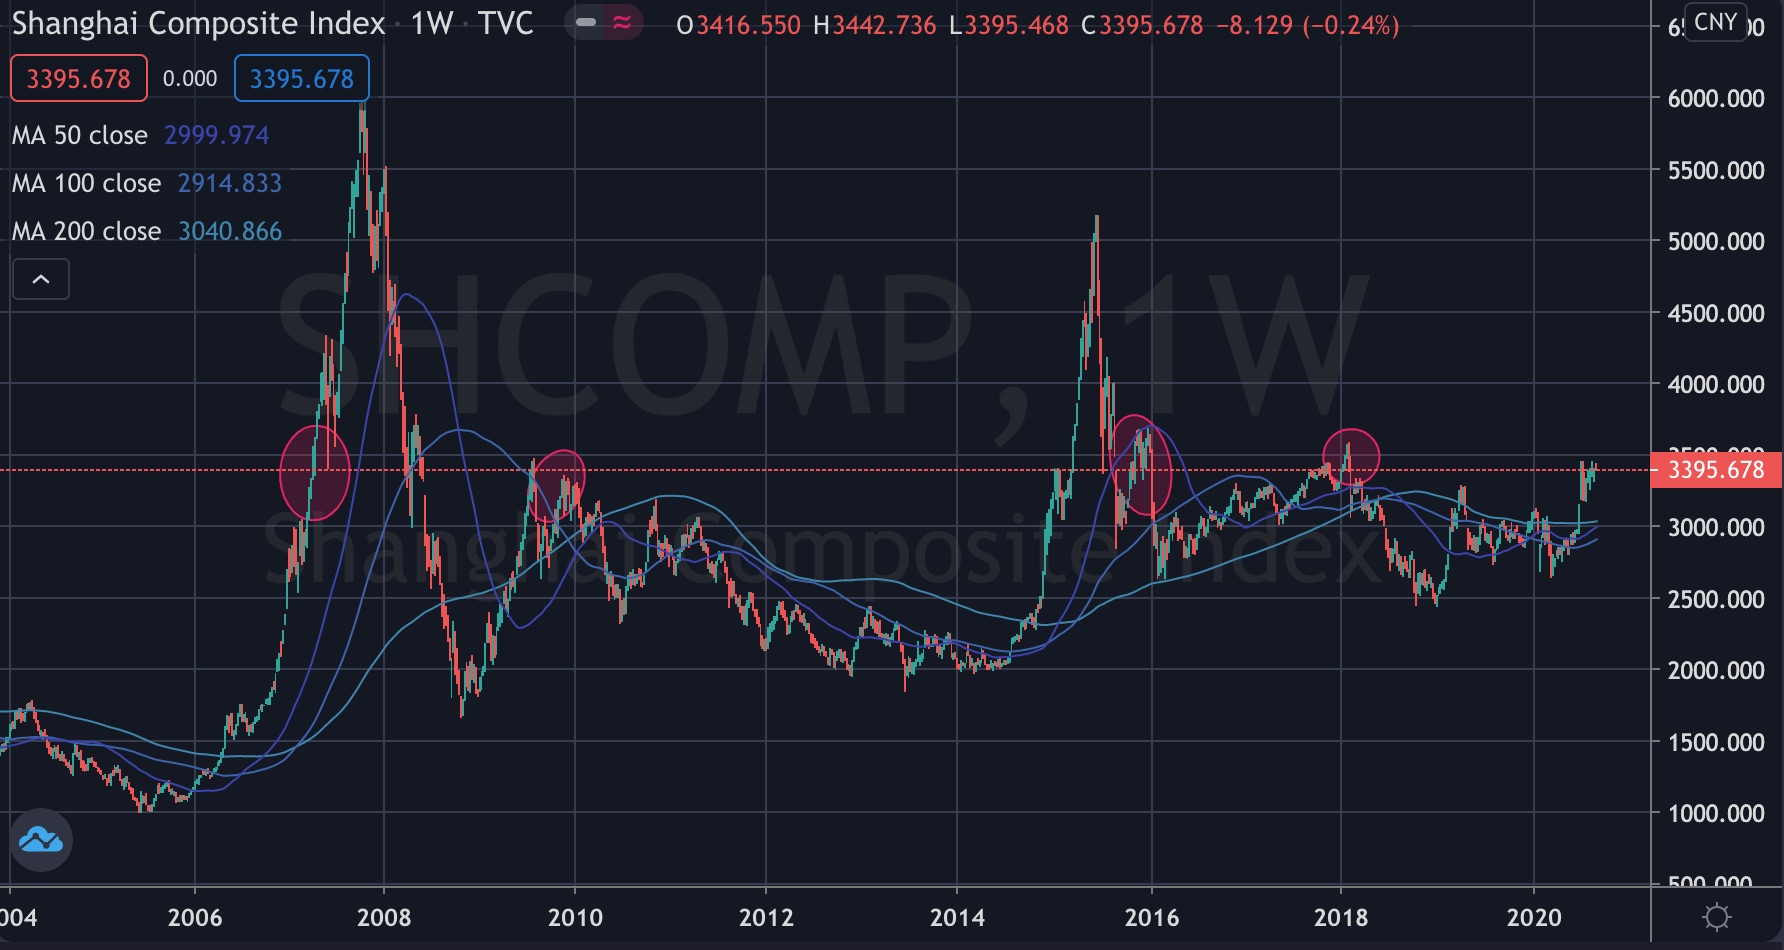
The chart below shows the Shanghai Composite today is trading at the same price it was in 2018, 2015, 2010, 2009 & 2007.

More so, it has been a flat market for the past 4 years,

In the interim, I expect that market to come back a little, perhaps to 3,100 (about 10% decline), while my indicators are confirming the longer trend is higher.

August 31, 2020

by Rob Zdravevski

rob@karriasset.com.au
 

Shanghai Weekly

Buy Scarcity

Re-posting this one…


The De-equitisation theme is still intact.

In the 2000’s, there were approx. 8,000 listed companies on U.S. exchanges.

Now, that number is about 4,000.

More and more capital being deployed into fewer and fewer available listed equities.

August 15, 2020
by Rob Zdravevski
rob@karriasset.com.au
Little reason to own abundance

The USA has four times more retail real estate per capita than Europe and with online shopping taking more market share for at least, the last 10 years, it’s difficult to make an investment case for bricks and mortar retail and the corporations exposed to it in the U.S.

Inversely, there is an increasing demand for warehousing and distribution facilities.

I’m yet to form a view on commercial office real estate.

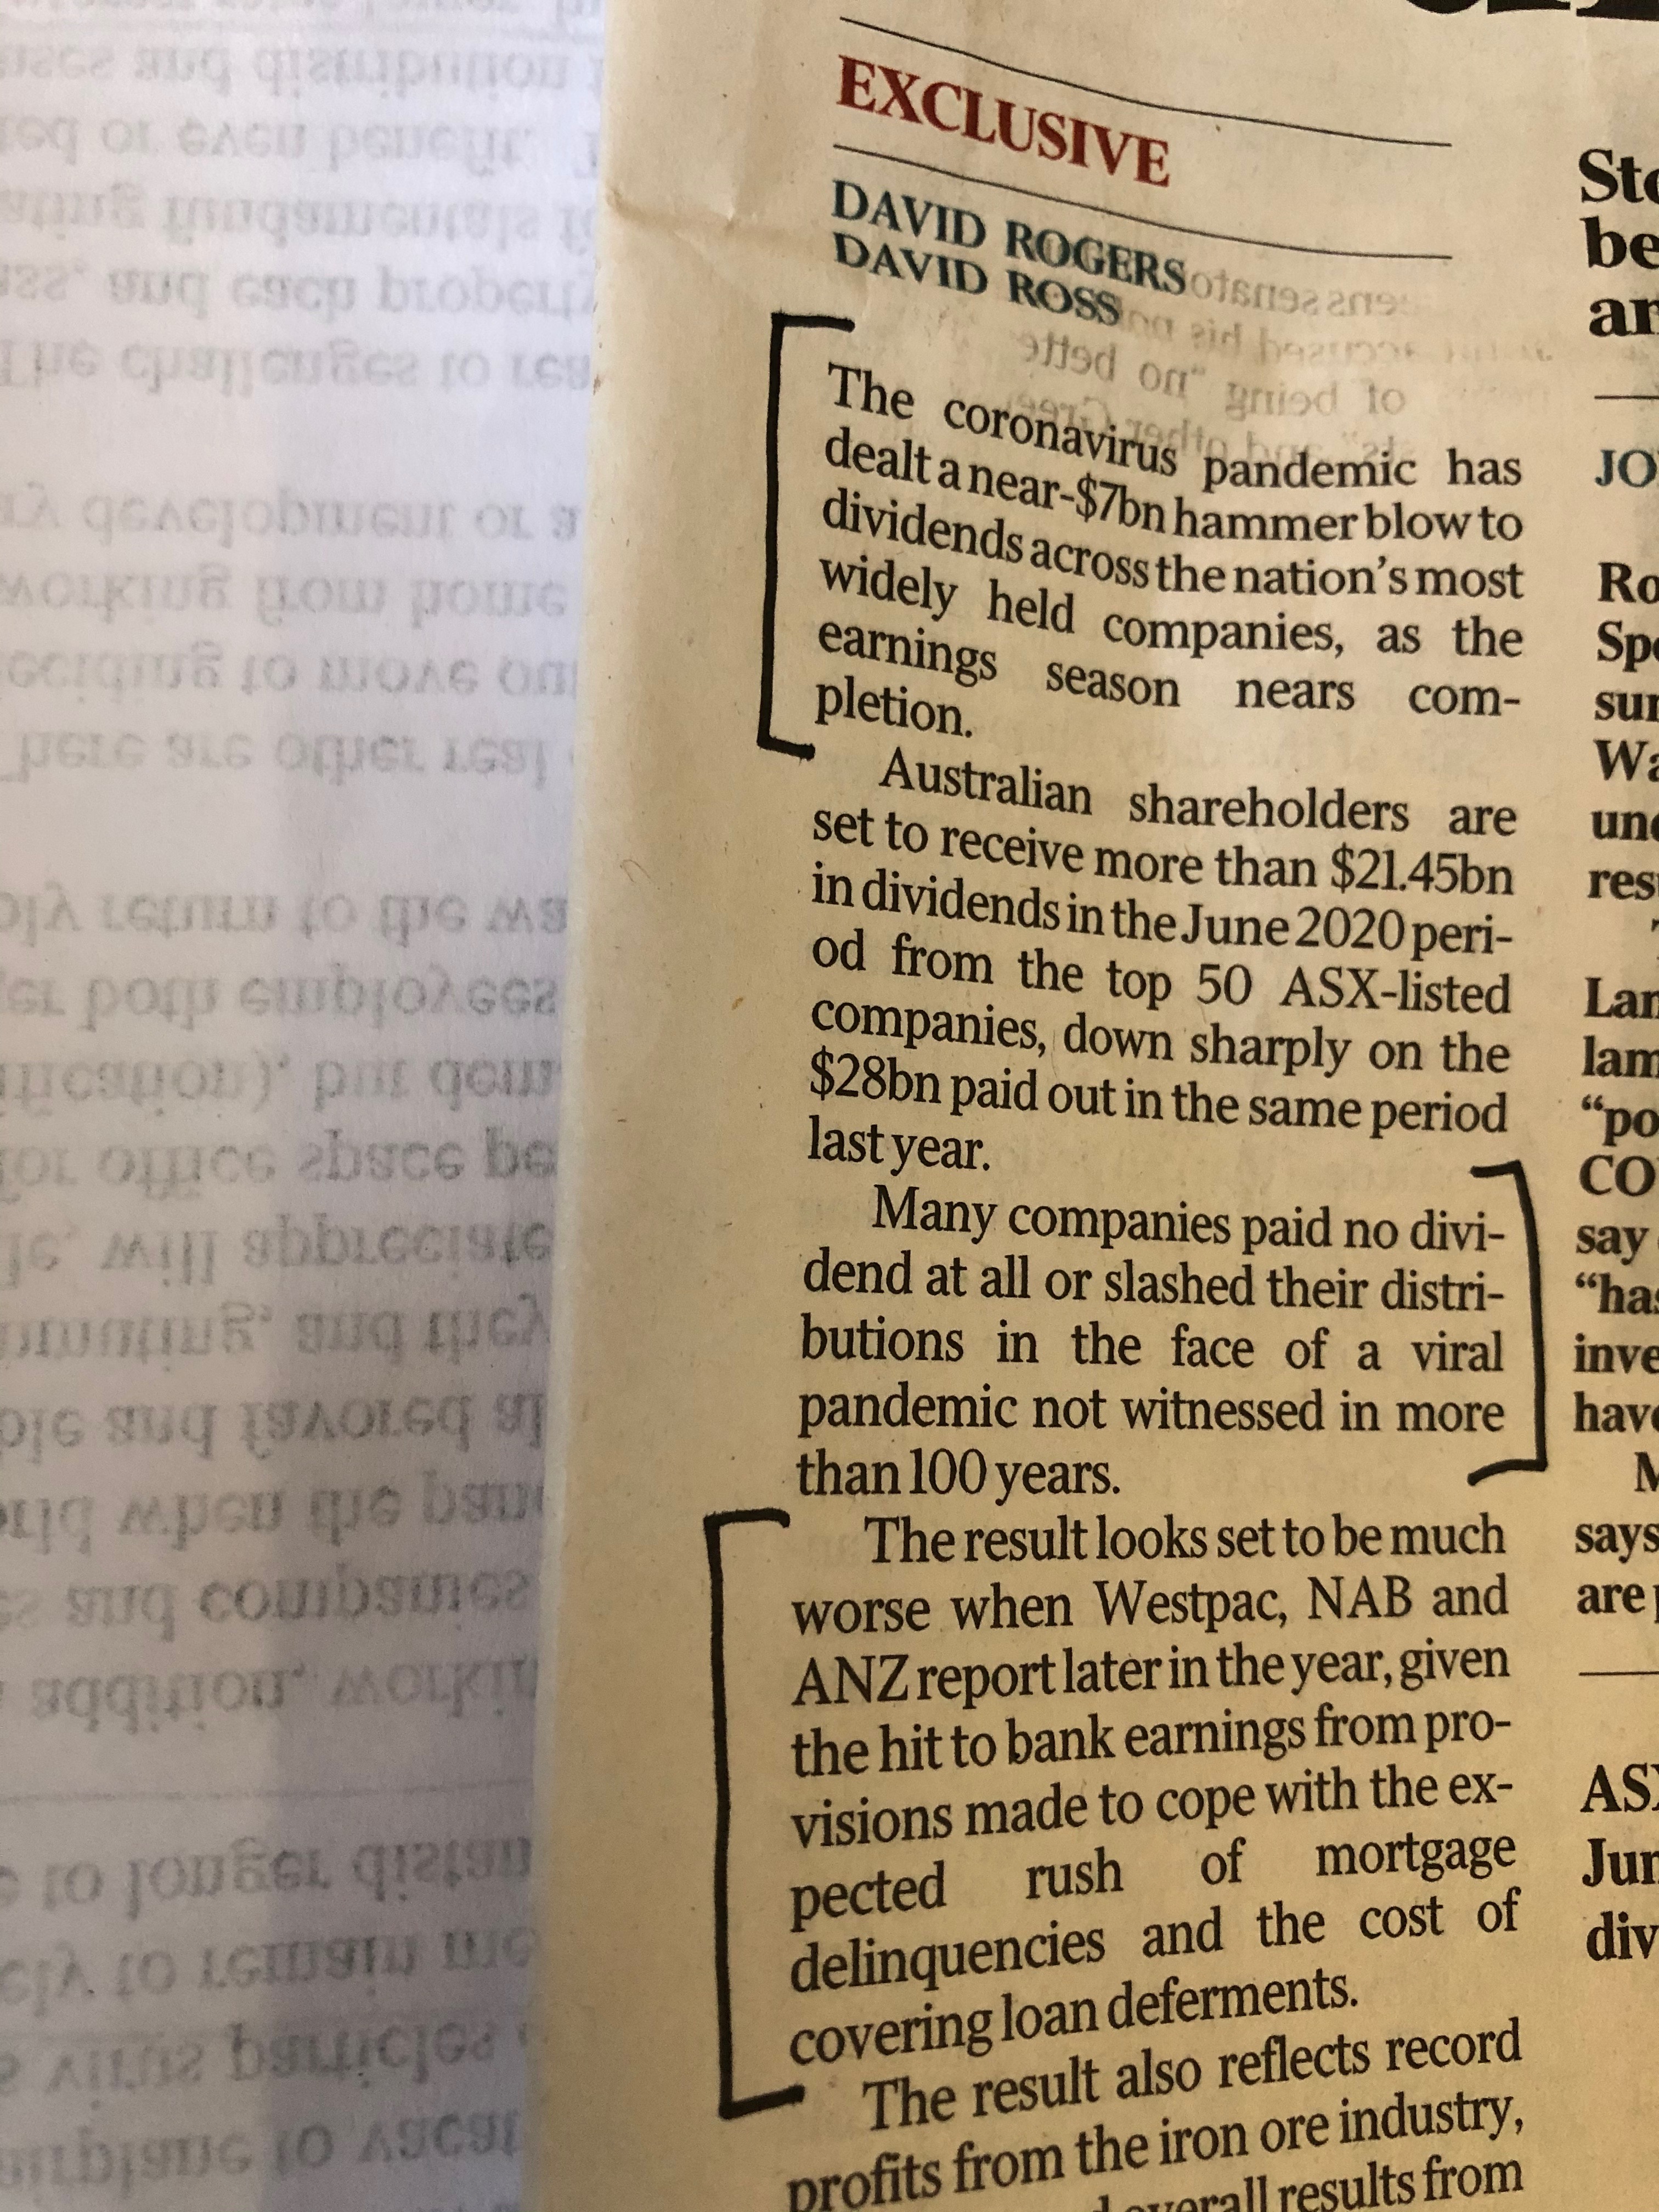
“Total Return” – what a concept !

From this weekend’s The Australian newspaper, this story outlines the facts but behind it is the lament of retail shareholders ire that they’re income is being crimped.

It’s high time those investors learned and their advisors teach them about the notion of “total return”.

IMG_3201

They’re swallowing the world

The market capitalisation of U.S. tech stocks is now greater than the value of the entire European stock market, according to Bank of America.

On Thursday August 27th, 2020, these tech stocks reached a combined market cap of $9.1 trillion compared to the $8.9 trillion sum of European stocks.

Gold stocks have fallen 20% from recent highs

My cautious views about chasing the gold price had merit and today (albeit my timing was off by a month) are justified as the reward didn’t out-stack the risk being taken of being long Gold and gold stocks following what I viewed as the “fat part of the trade” was already had and the tail was wagging during a euphoric move driven my media and the herd.

In other words, my work suggested that initiating a long position in May, June or July was a marginal proposition.

Now, ASX listed gold stocks are 20% below their recent highs, but more interestingly some are trading at the same price seen in January, February or March of 2020.

If you are a “trader” and you managed to “pick the eyes” out of the peaks and trough, I’m certainly pleased for you but as an investor, that’s not my bag.

As prices in gold securities continue to make weekly lower highs and lower lows, over the weekend, clients will be receiving my entry price suggestions for selected stocks at the lower end of this mean reversion and trend correction.

I’ll continue to post notes on various assets and securities when I see extremes (at either end) of price action or sentiment.

August 28, 2020

by Rob Zdravevski

rob@karriasset.com.au
 

The mood of retail investors – the contrary indicator

On February 27th, 2020, the weekly AAII Investor Sentiment Bull/Bear survey showed us that more individual (retail) investing respondents became bears.

By that day, the S&P 500 had already fallen 400 points (12%) over the previous week.

In the next 5 days, the market then bounced 6% but then savagely declined 30% over the next 3 weeks.

The majority of respondents remained bearish through that “whip-saw” and the memory of that sudden damage has seen that majority maintain their bearishness since that March 23, 2020 low, all while the S&P 500 soared 58% over the next 5 months.

It’s not an exact science, but this survey is a handy tool to gauge the antithesis of the market…..being, the stance of the retail investor.

Today, the spread is narrowing. I’m looking forward to next Thursday weekly release.

In the meantime, the S&P 500 and Nasdaq are the most overbought since their February 18th, 2020 peaks.

August 28, 2020
by Rob Zdravevski
rob@karriasset.com.au

Sell EUR / Buy USD and Sell AUD/ Buy GBP

Recently, the US Dollar was registering oversold readings.

Inversely, the Euro and British Pound were overbought.

Pundits are citing improving prospects for the EUR and GBP, while the strength in these currencies is ONLY due to the weaker USD.

Specifically, the EUR has “no business” trading at around the 1.18 mark (against the USD) respectively.

In actual fact, neither currency is exhibiting “strength”.

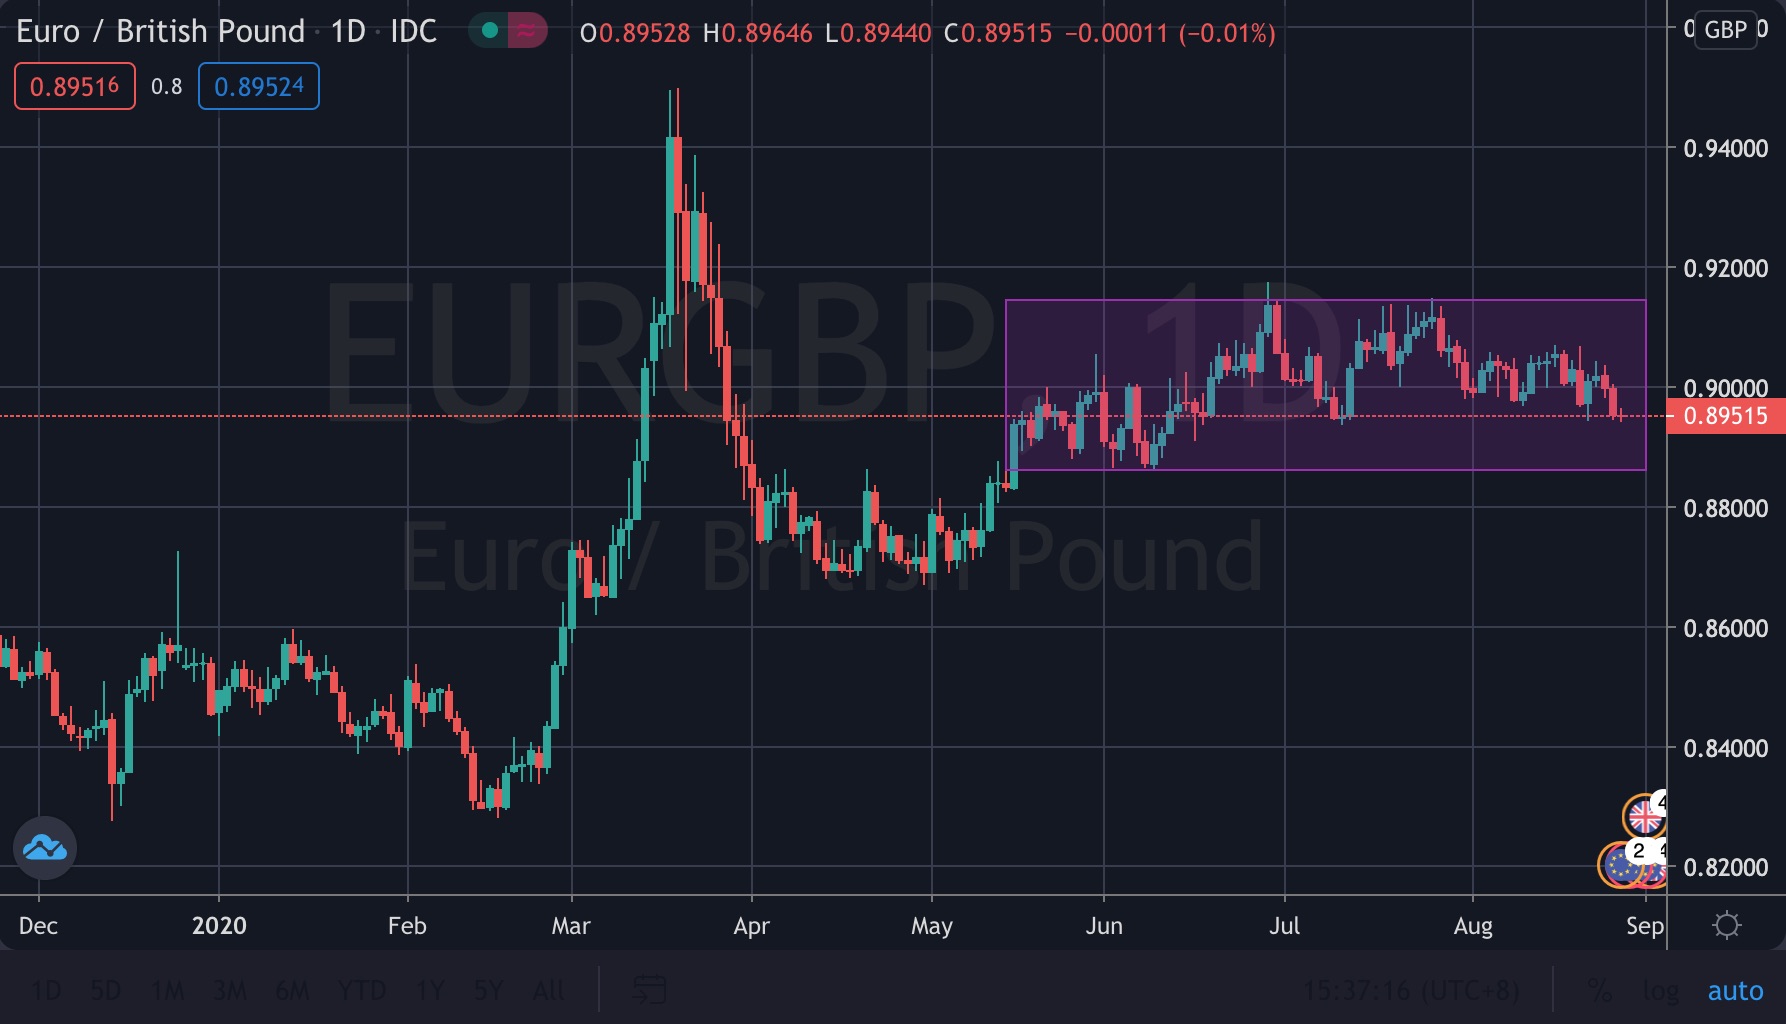
The chart below shows they EUR/GBP cross has been trading sideways for months.

If you have EUR, it’s prudent to Sell some of your “temporarily” strong currency and Buy some USD.

My best FX trade however is, sell AUD / buy GBP at 0.5485.

Target is 0.5090


This are general thoughts, see my disclaimer

August 27, 2020

by Rob Zdravevski

rob@karriasset.com.au


sideways EUR:GBP