Overbought S&P 500

The S&P 500 Index (at 3,478) and the Nasdaq 100 Index (at 11,972) are the most overbought since the Feb 18, 2020 highs….

it’s time to hedge out some market (index) risk.

August 27, 2020
by Rob Zdravevski
rob@karriasset.com.au

Gold Price Action Update – August 27, 2020

Short term, gold is in an early downtrend,

trend is not strong,

thus we rely on whether immediate support levels will hold,

if they don’t and they are broken, then we look at velocity of the move to determine if this embryonic down trend has strength (and perhaps more longevity)

In this interim or this current short term view,

My email to clients on Monday August 24th, suggested support levels for USD Gold where $1,907 – $1,882,

Yesterday Gold traded to $1,902 on that support line and has bounced $40,

see two charts below (one is the “bigger timeframe, the other is a close up on yesterdays low kissing the support line)

I expect Gold to test that support line again in the next day or so and watch if it holds before making the next call.

August 27, 2020

by Rob Zdravevski

rob@karriasset.com.au


What’s catching my eye

What’s catching my eye.
A list of markets which are at points of extreme, a change in direction or developing a new trend.

Short Term (daily) Extremes:
Overbought – the Nasdaq, S&P 500 and Dow Jones Industrials

New Short Term Trends:

Lower…..
Gold (in USD)
AUDJPY (i.e. risk-off)
Brent Crude
Platinum
Russell 2000
Cattle

Higher….
Nikkei 225
DAX 30
SOX Index
Hang Seng China Enterprises Index (HSCEI)

very close – new Higher trend;
DXY (USD Index)
FTSE 100
CAC 40
Italy’s MIB

very close – new Lower trend;
Silver
Shanghai Composite

And Iron Ore (3 days ago) and Lumber had bearish outside reversal days

August 25, 2020
by Rob Zdravevski
rob@karriasset.com.au
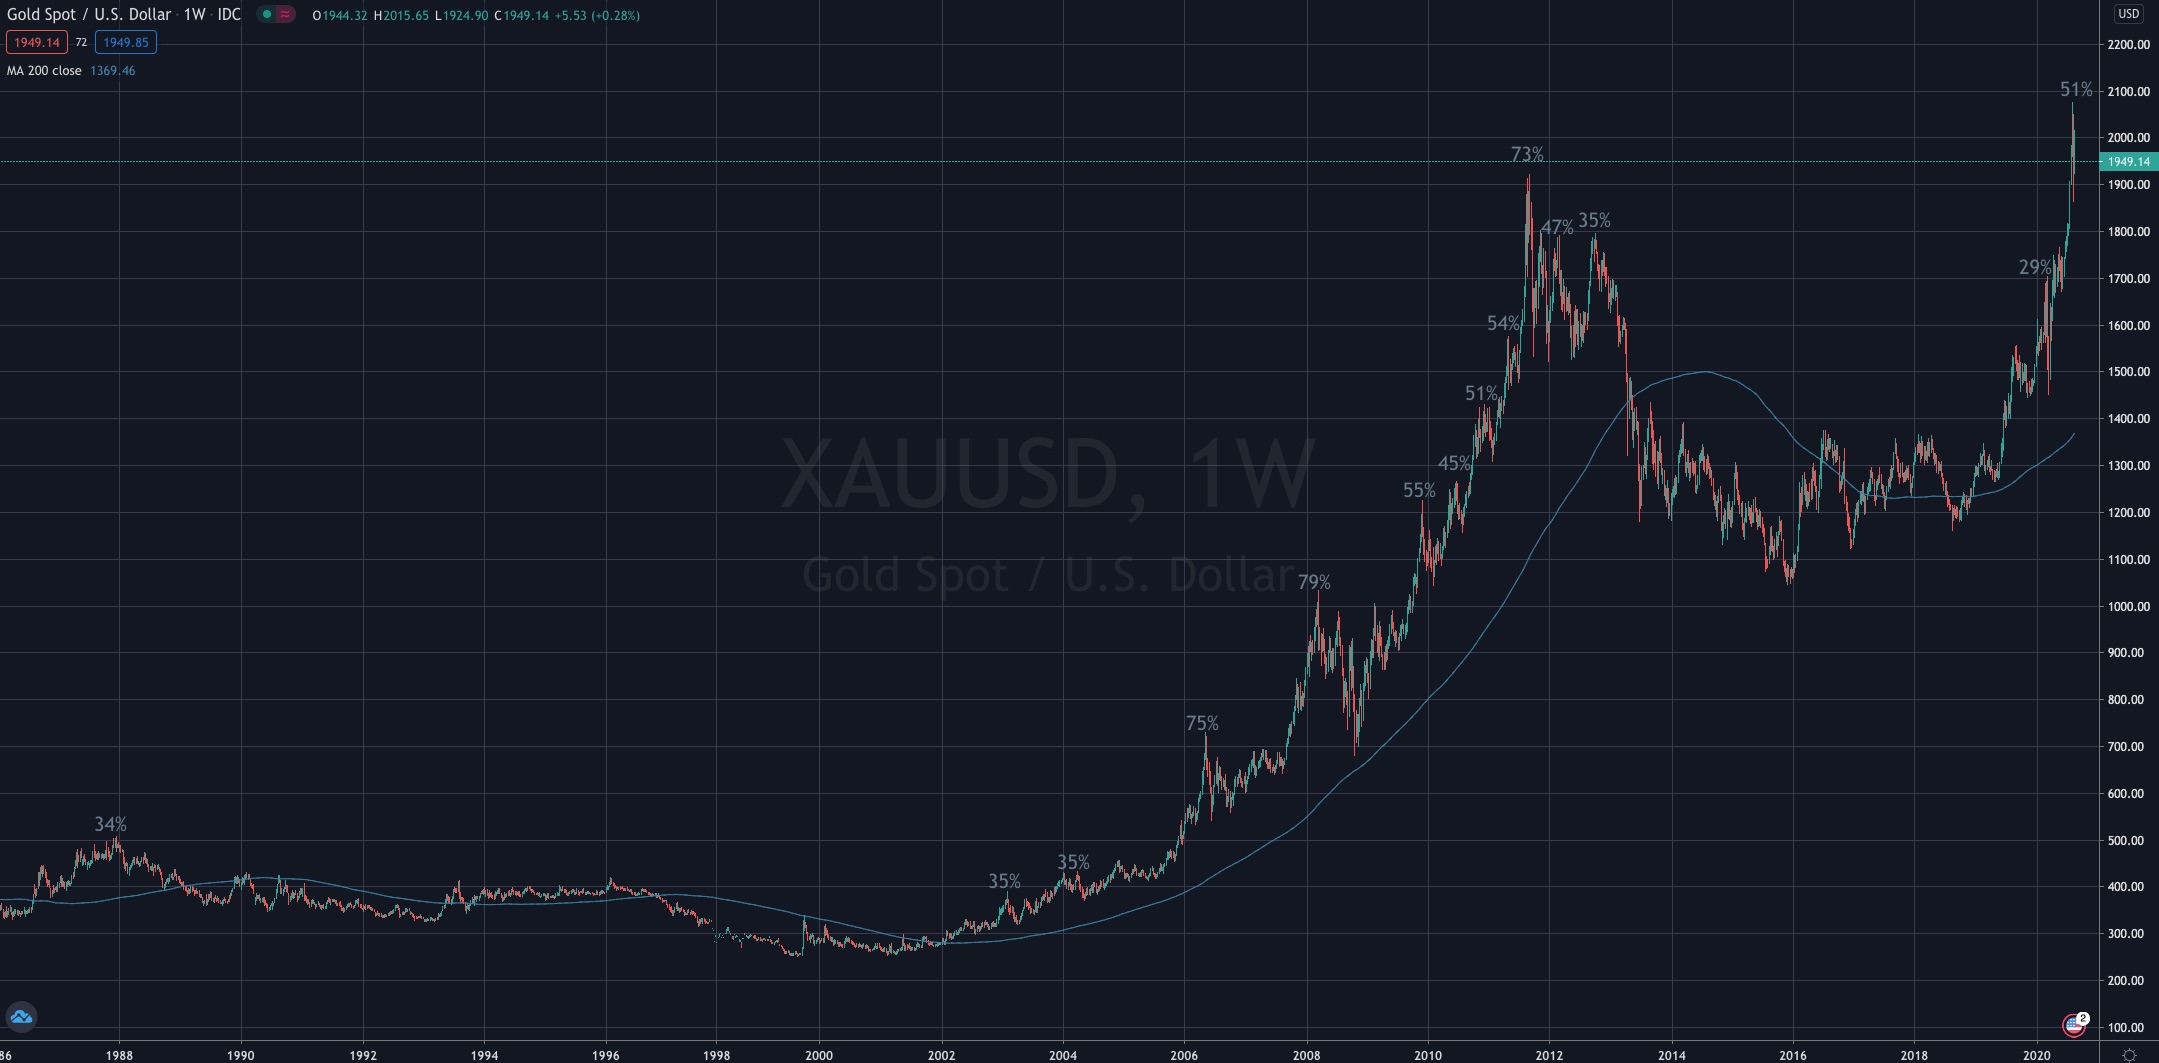
Gold and percentage extremes above its 200 day moving average

Below is a “weekly” 35 year chart of Gold and its rolling 200 day moving average.

At selected peaks, I have added the percentage that the Gold price was trading above its “weekly” 200 day moving average.

Incidentally, each move where percentages are listed coincided with a 3 standard deviation above its mean.

Today it makes for a marginal “even money” bet.

Let’s say that Gold extends itself to 80% above the 200 dma, thus taking it to $2,466 OR it decides to move lower to visit the “weekly” 200 dma of $1,370…..

So from today’s price, it’s either $530 per ounce upwards or $570 per to the downside.

Mean reversion does have its own gravitational pull.

August 20, 2020

by Rob Zdravevski
rob@karriasset.com.au


My Oil Juxtaposition

I am (long term) bullish on the price of Brent crude oil, which will be another note for another day…..

but I am bearish on the equity prices of large oil companies, especially those listed in the U.S. due to their declining oil reserves, poor exploration and production cost management, awful capital allocation towards acquisitions, debt laden balance sheets while insisting on maintaining historical dividend distributions at any cost.

Furthermore, a recent brainstorm with a client (and friend) confirms the industry is operating with technology and a mentality that hasn’t changed for 50 years which has resulted in a dearth of innovation and lack of efficiencies being sought.

Shareholders of Exxon Mobil, Chevron, ConocoPhillips, Occidental, Apache and the like, should allocate ample time to assess their holdings, hedging and strategy,

while shareholders of oil field service companies…….

August 20, 2020
by Rob Zdravevski
rob@karriasset.com.au

Explaining the Federal Reserve’s actions

As extracted from Seth Klarman’s 2nd quarter 2020 investor letter;
“Fed policy has been magnificently successful in achieving its objectives not only of lifting securities prices but also of altering investor behaviour. The Fed wanted to influence buyers of securities to be bolder in their pursuit of return. The head of a major pension fund recently authored a piece describing how the fund had responded to lofty markets and low yields on safe debt instruments. Their reaction was not to lower the fund’s currently aggressive 7% risk-adjusted return objective to a more realistic threshold, but instead to direct more assets into “lower volatility” private investments while leveraging the portfolio. Private investments, of course, have the same underlying risk and inherent volatility as public investments – though because they are not publicly traded, their intermittent and privately determined appraisals may make them appear to be less volatile. And as for the choice to leverage up, we can only note that leverage is a double-edged sword that enhances returns in good times while sinking them in down markets. If markets falter, this fund will have not solved its problems but rather have multiplied them.
Central banks, led by the Fed, continue to be the predominant driver of financial markets. By holding down interest rates, they influence investors to bid up the prices of securities, irrespective of the economic backdrop. By maintaining these seemingly never-ending policies and wilfully ignoring developing bubbles, the Fed has engineered a strong market recovery even as the unemployment rate tests Great Depression levels. The Fed balance sheet grows larger and larger, and the annual U.S. budget deficit approaches a level triple its previous ignominious record high. Investors are being infantilised by the relentless Federal Reserve activity. It’s as if the Fed considers them foolish children, unable to rationally set the prices of securities so it must intervene. When the market has a tantrum, the benevolent Fed has a soothing yet enabling response. As with the 30-year-olds still living in their parents’ basements, we can only wonder whether the markets will ever be expected to make it on their own.”

How will Sydney Airport pay its bond interest

If airlines aren’t flying and Qantas (QAN.AX) announces extended grounding of its fleet, you cant be surprised that the stock price of debt laden Sydney Airport (SYD.AX) is falling.

In fact, I’d be a nervous debt holder.

How will SYD.AX service the interest coupons ?

Don’t worry, they’ll borrow more AGAIN to pay the interest (which it recently did in mid-April 2020 – see quote below) and the government will always stand to save such an important, strategic and unique asset.

Actually, come to think of it, it’s the equity holders which should be nervous as they rank below the holders of debt.

“Sydney Airport’s $850 million in new two- and three-year bank debt brings its liquidity to $2.8 billion which it said would “comfortably” cover the $1.3 billion in loan repayments it has to make in the next 12 months and up to $200 million of expected capital expenditure”

– quote source, Sydney Morning Herald, April 20, 2020

June 29, 2020
by Rob Zdravevski

rob@karriasset.com.au

Owning Scarcity

The De-equitisation theme is still intact.

In the 2000’s, there were approx. 8,000 listed companies on U.S. exchanges.

Now, that number is about 4,000.

More and more capital being deployed into fewer and fewer available listed equities.

August 15, 2020
by Rob Zdravevski
rob@karriasset.com.au

?? Telstra ??

Telstra has generally been a terrible equity investment over the past 20 years and yet an article such as this still tries to laude the stock as being an attractive “yield play”.

https://lnkd.in/g8BHr3X

It doesn’t matter if you receive a 5% dividend and the stock loses 50% of its capital.

Australian retail equity investors still pine for dividends at any cost AND the cost happens to result in losing capital.

More on the concept of “total return” in an upcoming post.

Following today’s earnings result, Telstra’s stock plummeted 8.2%.

This is 2 years worth of dividends, gone, in a single day of trading.

As a respected peer once told me, “Telstra is a stock that will keep paying a dividend, until it can’t anymore”.

August 13, 2020
by Rob Zdravevski
rob@karriasset.com.au

Not feeling “golden” this week

This is not a celebratory post but intended to highlight the practice of observing prices and moods when they reach an extreme.

There are times when experience tells you that things are stretched, feeling “dangerous” or perhaps resembling mania, frenzy or euphoria.
(see my recent posts warning of such)

I still wonder what makes people chase assets at “stretched” prices.

Are they trying to “eek” out the last 10% of a move?

Are they oblivious that the “fat part” of the trade has been seen and had?

Do they understand what their risk/reward ratio looks like?

Today’s example is the price action in Gold.

Yesterday (overnight) Gold fells $130 per ounce of ~ 6.3%. It’s trading at $1,915 as I write this. Incidentally, Silver plummeted 17%.

It’s difficult (impossible, even) to pinpoint the timing of such a move, but it should be easier to understand when not to chase something at perpetually higher prices without having a sound reasoning for doing so.

Today, prices of Aussie gold companies are 7% lower and the poor sod who bought Saracen Minerals (SAR:ASX) 2 weeks ago at $6.75 is wearing 20% worth of pain.

Furthermore, these stocks are now trading at the same prices seen 6 weeks ago.

Wasn’t gold hitting new highs only 4 days ago?

August 12, 2020
by Rob Zdravevski
rob@karriasset.com.au