Another 3-sigma move in Corn
April 30, 2021 Leave a comment
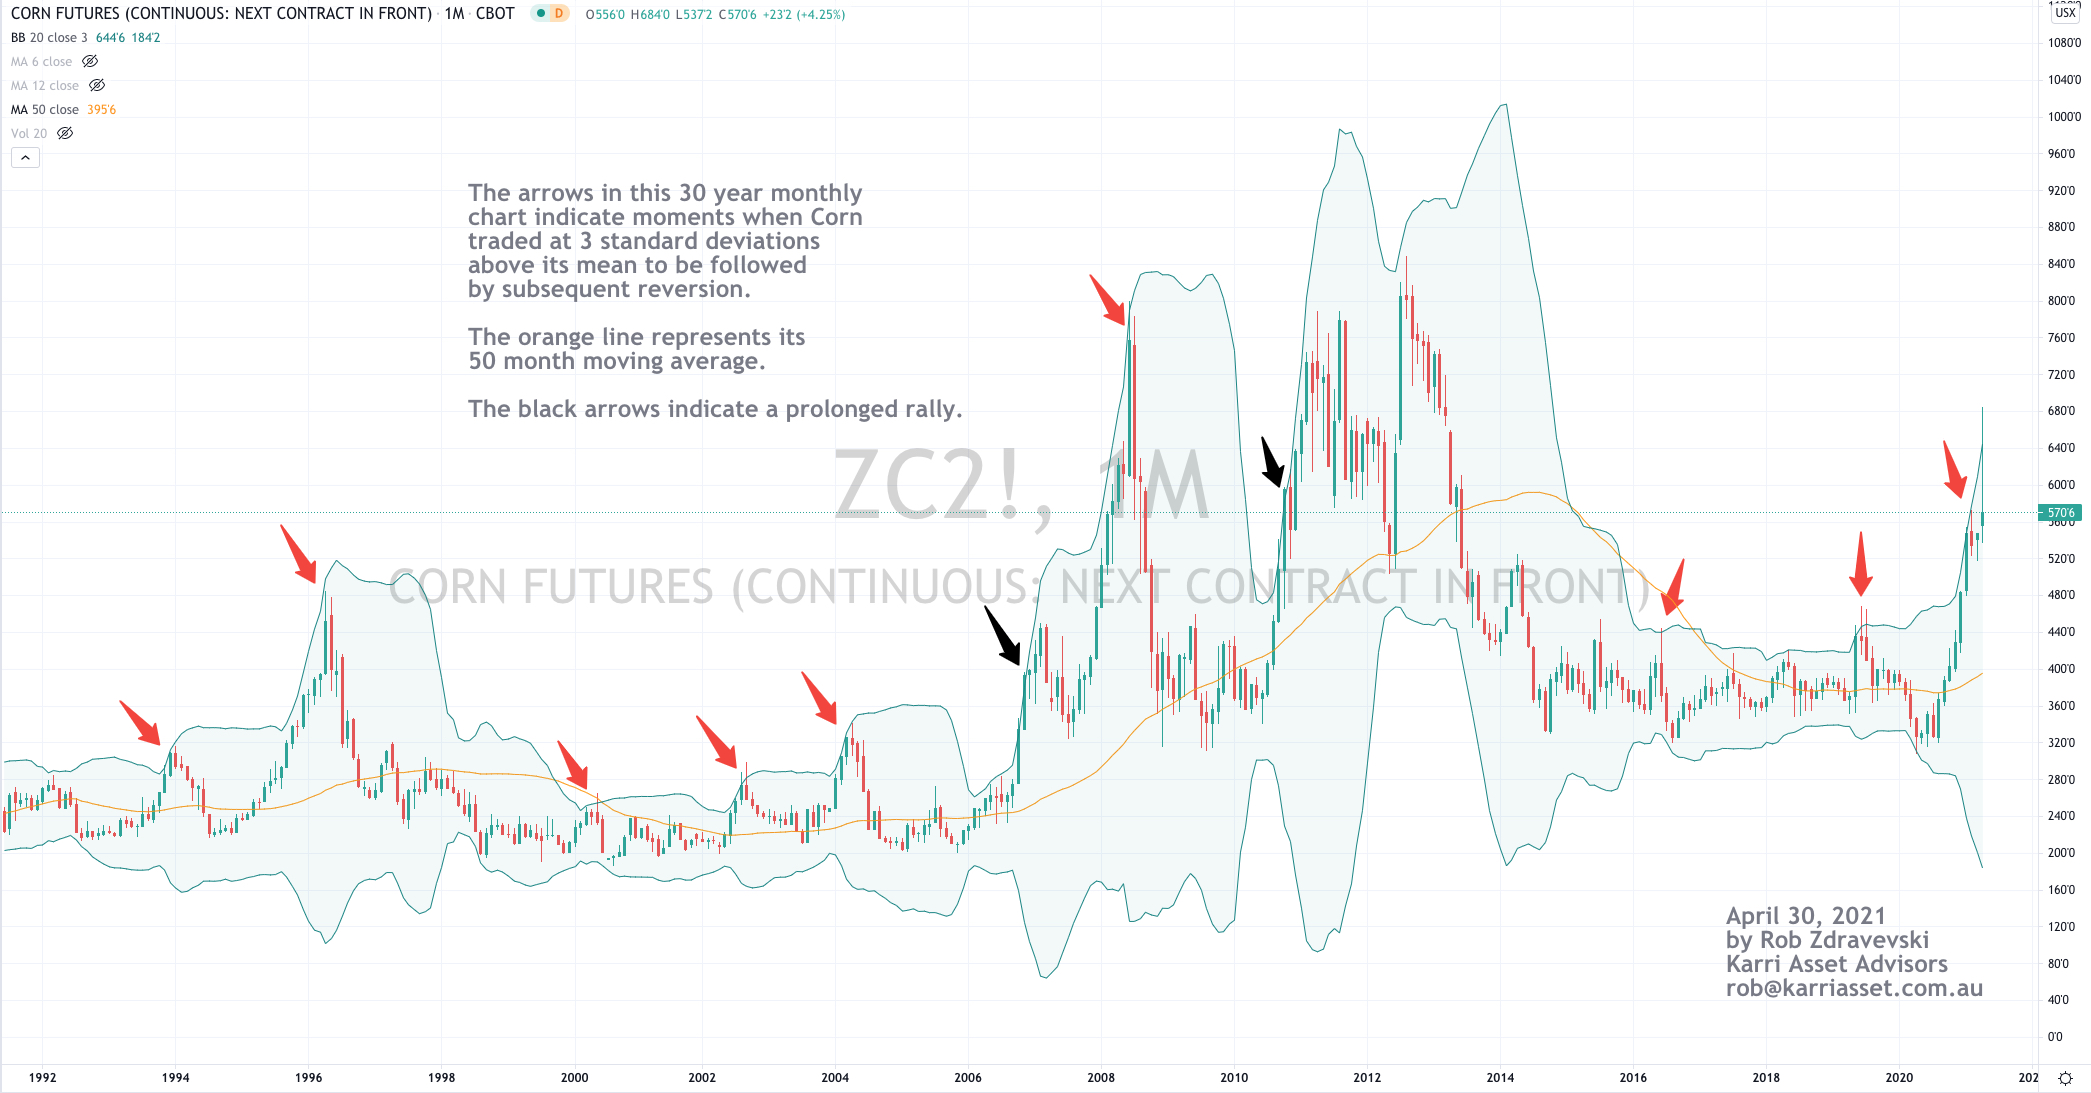
The arrows in the 30 year chart below (plotted on a monthly basis) shows Corn’s various moments when it has traded 3 standard deviations above its mean.
Such extremes are more interesting and mean reversion is more relevant when a commodity is seasonal and replenishes.
April 30, 2021
by Rob Zdravevski
rob@karriasset.com.au
