Reading the tape: META US
September 29, 2026 Leave a comment
My work says that the META share price eventually sees $400.
It’s $719 today.
September 29, 2026
rob@karriasset.com.au

Trying to hear what's not being said
September 29, 2026 Leave a comment
My work says that the META share price eventually sees $400.
It’s $719 today.
September 29, 2026
rob@karriasset.com.au

September 27, 2026 Leave a comment
A weekly Macro, Cross Asset review of prices trading at extremes which may generate future investment ideas and opportunities.
The following assets (on a weekly timeframe) either registered an Overbought or Oversold reading and/or have traded more than 2.5 standard deviations above or below its rolling mean.
n.b. pricing of (commodity) futures contracts is only considering the immediate front month.
* denotes multiple week inclusion
Extremes above the Mean (at least 2.5 standard deviations)
Australian 3-year bond yield
Swiss, Czech and Norwegian 10-year government bond yields *
British 5-year bond yield
Japanese 30-year bond yield
TBT
U.S. 5-year bond yield minus U.S. 3-month bill yield
U.S. 10 year minus Australian 10-year bond yield spread
U.S. 10 year minus Eurozone 10-year bond yield spread
U.S. 10 year divided by Australian 10-year bond yield
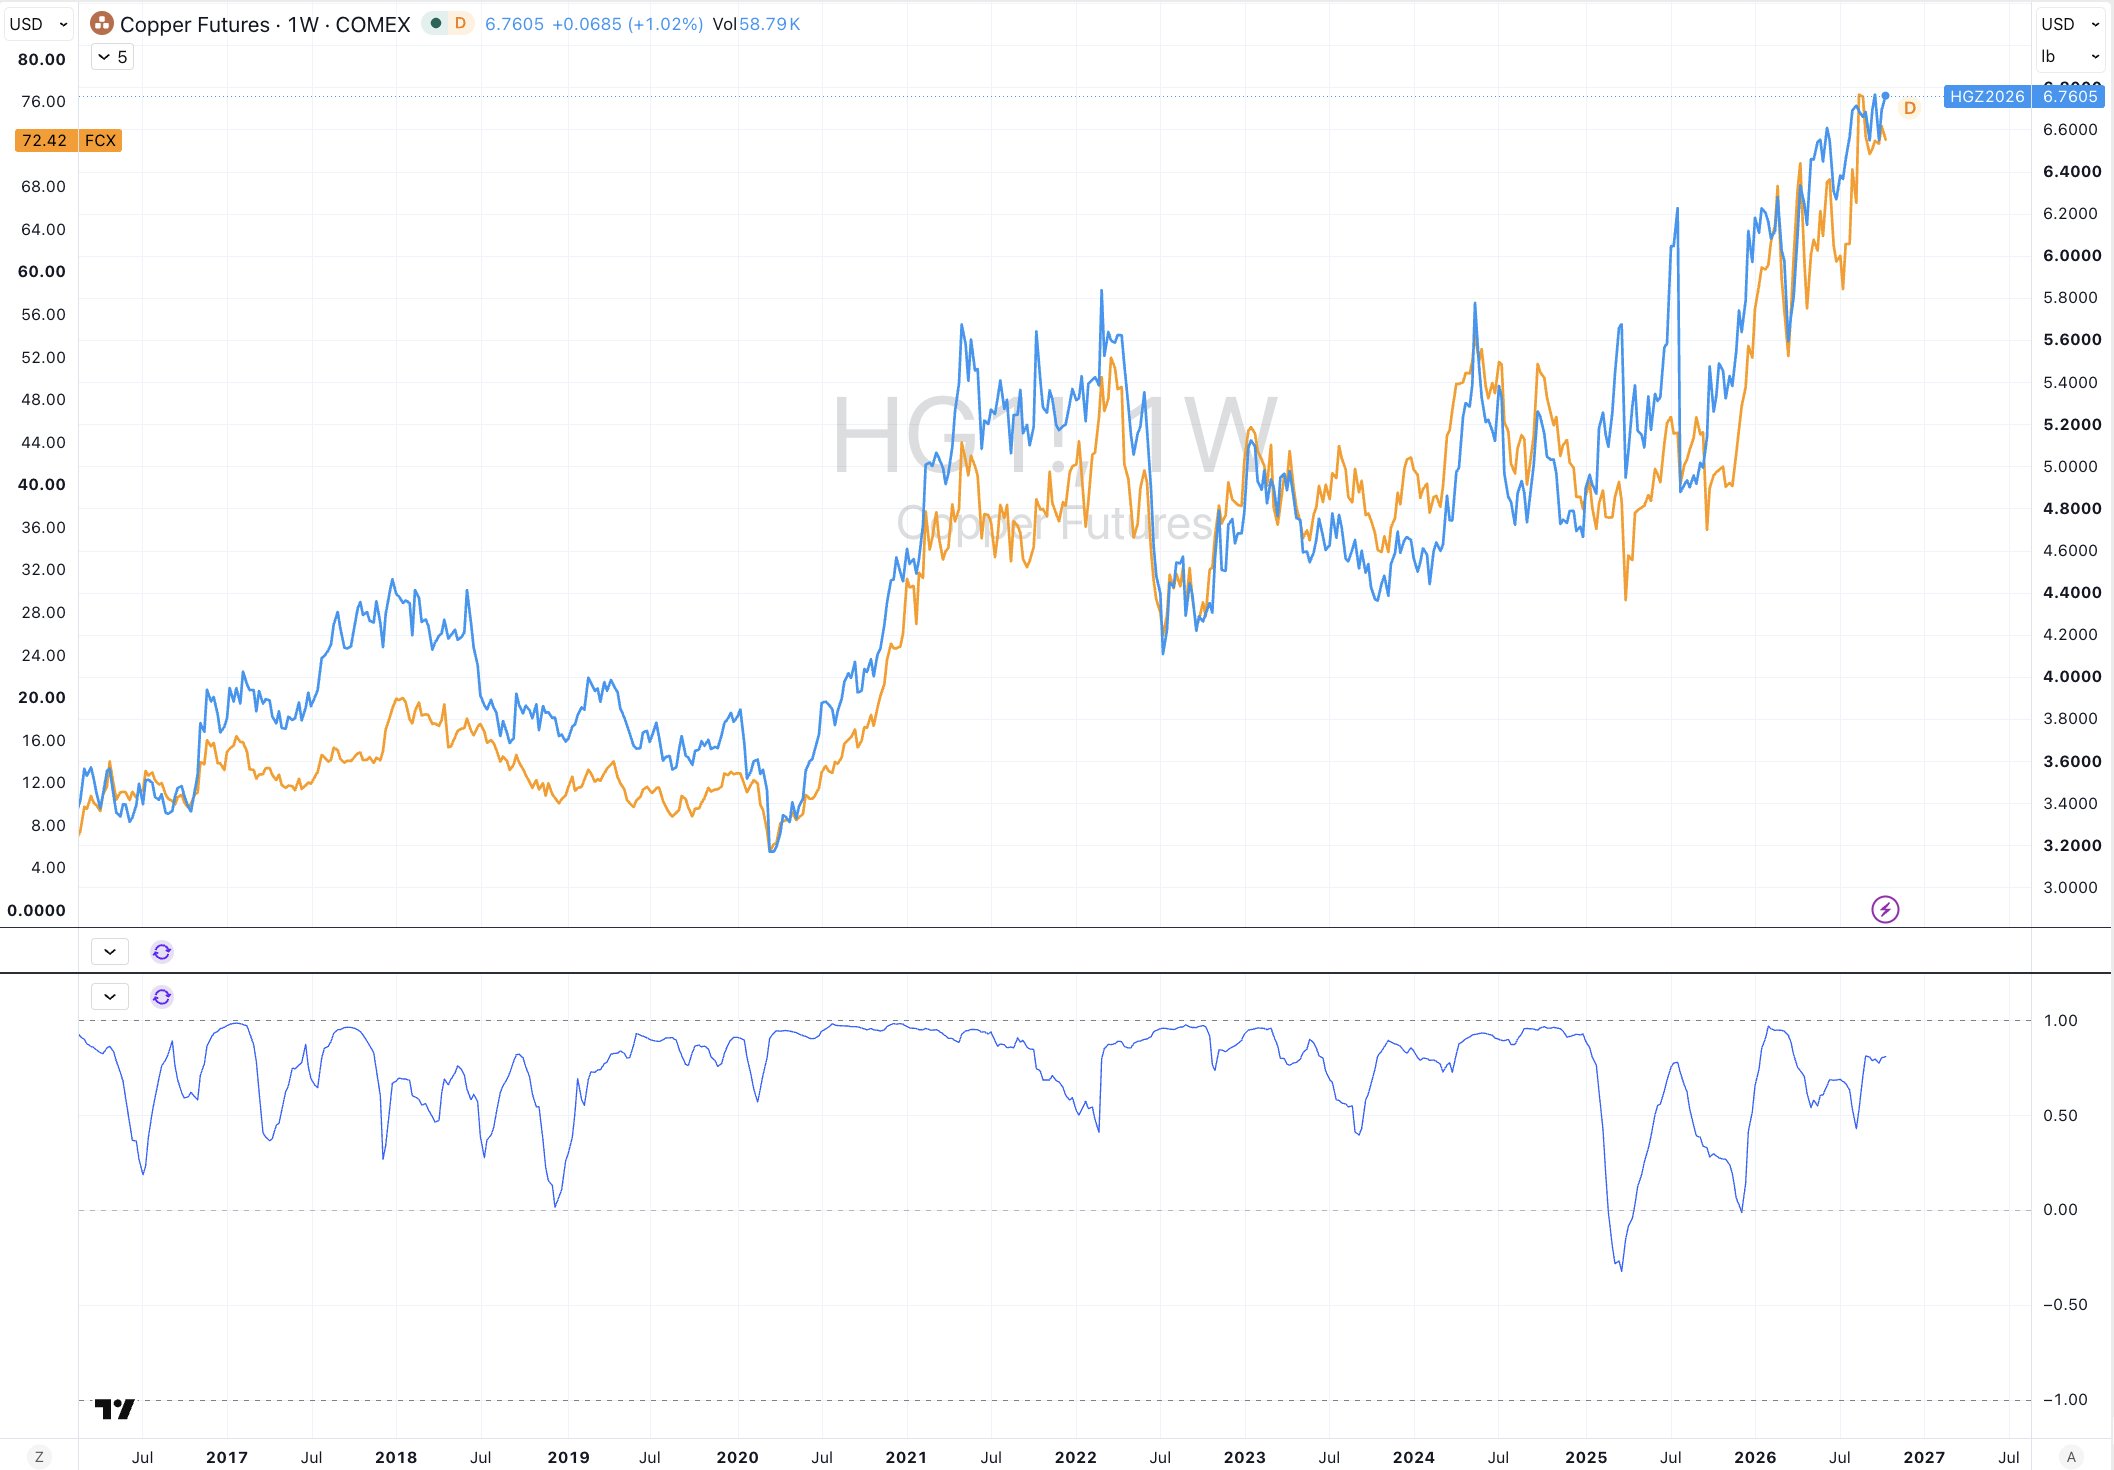
Copper
Overbought (RSI > 70)
Japanese 2, 5 and 10-year bond yield *
Austrian and Spanish 10-year government bond yields
U.S. 30-year bond yield
Austria’s ATX equity index
Taiwan’s TAEIX equity index
And Poland’s WIG Index *
The Overbought Quinella (Both Overbought and Traded at > 2.5 standard deviations above the weekly mean)
U.S. 5–7-year corporate bond yields *
Belgian, Chilean, Danish, Finnish, French, Greek, Italian, Dutch and Portuguese 10-year government bond yields *
British 2-year bond yield
The U.S. and EU yield curves (except for the 30’s)
TBX
U.S. 3-month bill, 2, 3, 5, 7, 10 and 20-year bond yields
U.S. 5-year bond yield minus 5-year inflation breakeven rate spread *
U.S. 10-year bond yield minus 10-year inflation breakeven rate spread *
North American Hot Rolled Coiled Steel *
Gasoline *
Gasoil and its crack spread *
Rice *
Extremes below the Mean (at least 2.5 standard deviations)
Australian 10 year minus U.S. 10-year bond yield spread
U.S. 10 year minus U.S. 2-year bond yield spread
Türkiye’s BIST Index *
Oversold (RSI < 30)
TLT
The Oversold Quinella (Both Oversold and Traded at < 2.5 standard deviations below the weekly mean)
IEF & IEI *
SHY *
U.S. 30 year minus U.S. 10-year bond yield spread *
Notes & Ideas:
Government bond yields were the news.
During the week, Australia’s 10 year minus 5-year bond yield spread touched a lower extreme.
Swiss and U.S. 10-year bond yields are in a 4-week winning streak, as is the U.S. 10 year minus U.S. inflation rate spread.
Japanese 5 year and the U.S. 10 year minus 10-year break even inflation rate has climbed for 5 weeks.
The rest of the U.S. yield curve and the U.S. 5 year minus U.S. inflation rate spread are in a 6-week winning streak.
U.S. 5–7-year bond yields have risen for 7 weeks.
Inversely, Brazilian 10-year yields have sunk for 7 weeks.
The German and Italian 2-year yield fell and broke 6 weeks of advance.
Belgian, Czech, Danish, Spanish, Finnish, French, Greek, Italian, Dutch Polish, Portuguese and Swedish 10-year yields have risen for 7 consecutive weeks as are German 5’s and U.S. 7’s.
The last time we saw such a 7-week bond yield winning streak was in August-September 2022.
The U.S. 30 minus 10-year yield spread and the IEI ETF have closed lower for the past 6 weeks.
While U.S. 10 year minus U.S. 5 year rose and bounced out from a negative quinella.
Equities were mixed with a weaker bias.
Saudi Arabia’s Tadawul, the South Africa 40, ASX 200ASX Materials and the ASX Industrials have fallen for the past 4 weeks.
The Dow Jones Transports and S&P Small Cap 600 have declined for 6 weeks.
The CSI 300, Nifty, Sensex and Nasdaq Transports are in 7-week losing streaks.
UAE’s DFM index has advanced for the past 5 weeks.
And Norway’s OBX fell to snap its 10-week winning streak.
Commodities prices have plenty of action.
Distillates, Gases, Copper, Oats, Silver and Gold were the notable gainers.
Coal, Cocoa, Cotton, Coffee, Lithium, Sugar and Rice were amongst the largest decliners.
Lean Hogs moved out of oversold territory.
North American steel prices rose for the 4th straight week.
JKM LNG prices have fallen for 10% for past 2 weeks.
Lithium Carbonate, Palladium & Wheat have fallen for 4 weeks.
Arabica Coffee and Lithium Hydroxide have sunk for 5 weeks.
Naphtha crack spreads have closed lower for the 8th consecutive weeks.
And Urea, Gasoline, Gasoil crack and Heating Oil crack fell and snapped their respective winning streaks.
Currencies were quiet, again.
The Aussie and Loonie were weaker, again.
The Yen was stronger.
NZD/AUD has fallen for 4 weeks.
Kiwi/Dollar is in a 5-week losing streak, as are CHF/USD and CLP/USD.
And the PHP/USD rose to snap a 6-week losing streak.
The larger advancers over the past week comprised of;
Rotterdam Coal 1.3%, Baltic Dry Index 1.7%, Cocoa 5.5%, Cotton 1.9%, Cattle 2.6%, Natural Gas 9.8%, Orange Juice 7.2%, Tin 1.4%, Oats 3.4%, Rice 6%, ATX 2.1%, IBB 2.6%, TAIEX 1.8%, Nasdaq Composite 2.1%, KOSPI 2.7%, Mexico 2.6%, NBI 1.6%, Nasdaq 100 3.3%, Nikkei 2.1%, SET 1.5%, WIG 1.4% and SOX rose 6.3%.
The group of largest decliners for the week included;
Brent Crude (1.5%), WTI Crude (3.8%), Palm Oil (4.6%), Heating Oil (7.9%), JKM LNG (6.2%), JKM LNG in Yen (2.6%), Palladium (3.3%), Platinum (1.6%), S&P GSCI (1.5%), Dutch TTF Gas (9.4%), Gasoil (3.2%), Silver (2.9%), Gold (2.1%), Wheat (1.5%), Heating Oil crack spread (4.2%), Gasoline (1.9%), Naphtha (6.5%), CSI 300 (1.5%), AEX (1.6%), KBW Banks (1.8%), IDX (3.1%), DJ Transports (2.5%), EGX (3.1%), FCATC (1.3%), Tadawul (1.7%0, KRE Regional Banks (1.7%), OBX (1.6%), Copenhagen (1.8%), Nasdaq Transports (1.5%), Vietnam (1.7%), BIST (2.9%) and ASX Small Caps fell 1.7%.
September 27, 2026
By Rob Zdravevski
rob@karriasset.com.au
September 20, 2026 Leave a comment
A weekly Macro, Cross Asset review of prices trading at extremes which may generate future investment ideas and opportunities.
The following assets (on a weekly timeframe) either registered an Overbought or Oversold reading and/or have traded more than 2.5 standard deviations above or below its rolling mean.
n.b. pricing of (commodity) futures contracts is only considering the immediate front month.
* denotes multiple week inclusion
Extremes above the Mean (at least 2.5 standard deviations)
Austrian and Czech 10-year government bond yields *
Chilean 10’s minus 2’s yield spread
U.S. high yield and BB Index *
Heating Oil *
Oats
And Portugal’s PSI Index
Overbought (RSI > 70)
Japanese 2, 5 and 10-year bond yield *
U.S. 5–7-year corporate bond yields *
Australian Coking Coal
North American Hot Rolled Coiled Steel *
JKM LNG in $ *
Rice *
Heating Oil crack spread *
Gasoline *
Dutch TTF Gas *
Gasoil and its crack spread *
AUD/CHF *
CNH/USD *
Hungary’s BUX Index
Norway’s OBX *
Singapore’ Strait Times Index
And Poland’s WIG Index *
The Overbought Quinella (Both Overbought and Traded at > 2.5 standard deviations above the weekly mean)
Belgian, Canadian, Danish, Spanish, Finnish, French, Greek, Italian, Dutch and Portuguese 10-year government bond yields
The U.S. and EU yield curves (except for the 30’s)
TBX
U.S. 5-year bond yield minus 5-year inflation breakeven rate spread *
U.S. 10-year bond yield minus 10-year inflation breakeven rate spread *
Extremes below the Mean (at least 2.5 standard deviations)
NZD/AUD
Türkiye’s BIST Index
Oversold (RSI < 30)
Lean Hogs
The Oversold Quinella (Both Oversold and Traded at < 2.5 standard deviations below the weekly mean)
IEF & IEI
SHY
U.S. 10 year minus U.S. 5-year bond yield spread
U.S. 30 year minus U.S. 10-year bond yield spread
Notes & Ideas:
Government bond yields were mixed but several fell enough to see them drop out from overbought extremes.
British 2 year and Japanese 5-year bond yields are in 4-week winning streaks.
Indian 10 year and U.S. 2- and 3-year bond yields have climb for 5 weeks.
Belgian, Czech, Danish, Spanish, Finnish, French, Greek, Italian, Polish, Portuguese and Swedish 10-year yields have risen for 6 consecutive weeks.
As have the British 3’s, Euro 2’s and 5’s along with the U.S. 5- and 7-year yields and the U.S. 5-year bond minus 3-month bill yield spread.
While the U.S. 10 minus 5-year yield spread and the IEI ETF have closed lower for the past 5 weeks.
Equities were mostly weaker.
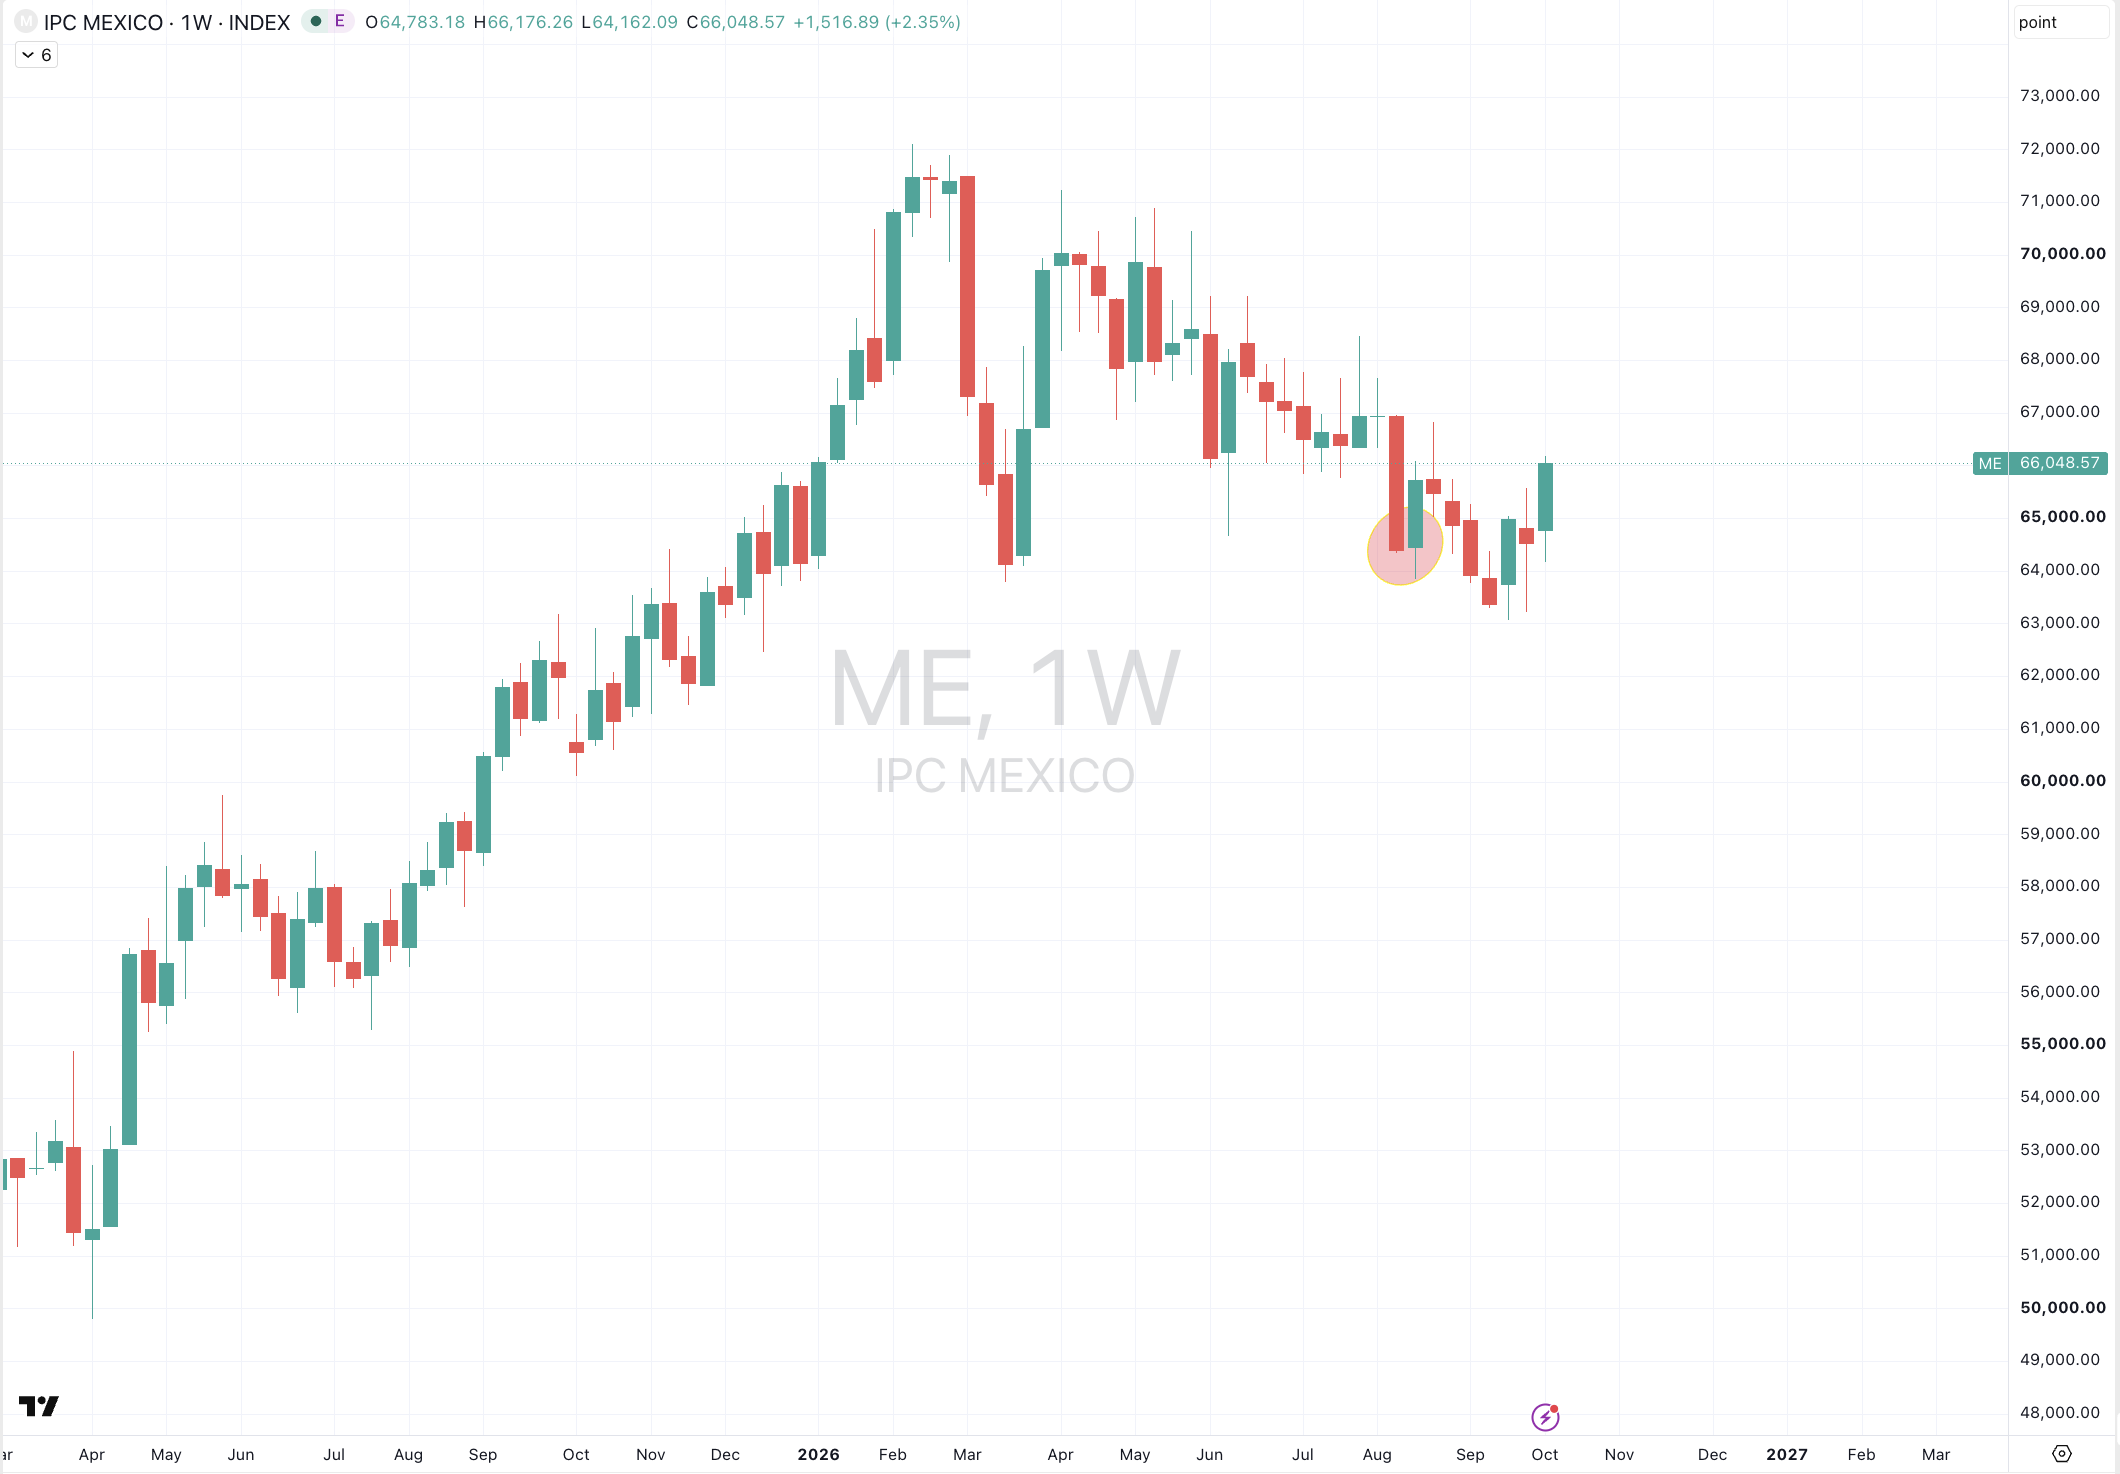
Malaysia’s KLSE and Mexico’s IPC have fallen for the past 4 weeks.
The Dow Jones Transports, FCATC, S&P Small Cap 600 and TSX have declined for 5 weeks.
The CSI 300, CAC 40, Nifty, Sensex and Nasdaq Transports are in 6-week losing streaks.
Brazil’s Bovespa has advanced for the past 5 weeks.
And Norway’s OBX is in a 10-week winning streak.
Commodities prices told a mixed story.
Many commodities left the extreme list.
Distillates, Gases, Copper, Oats, Silver and Gold were the notable gainers.
Coal, Cocoa, Cotton, Coffee, Lithium, Sugar and Rice were amongst the largest decliners.
Rice and Gasoline fell and snapped 4 weeks of higher prices.
U.S. Gulf Urea prices have climbed for 5 weeks.
JKM LNG and Dutch TTF fell and broke their 5-week winning streaks.
Gasoline and the Gasoil Oil crack spread are in 6-week winning streaks.
And Tin has fallen for 5 weeks.
Currencies were quiet, again.
The Aussie eeked out small gains except vs. the USD
The Loonie was unchanged to weaker.
Euro was weaker, as did the Yen.
The Yen weakness saw it find relief from its ‘extremes’.
The Kiwi is in a 4-week losing streak against the AUD & USD.
The USD was strong and looking so.
Its advance was enough to see it snap its 4-week losing streak against the Korean Won.
And the PHP/USD has fallen for 6 weeks.
The larger advancers over the past week comprised of;
Australian Coking Coal 2.6%, Copper 2.2%, Heating Oil 1.9%, Natural Gas 2.9%, Gasoline 4.1%, Urea U.S. Gulf 1.9%, Gasoil 2%, Silver 3%, Gold 1,5%, Oats 7.3%, Gasoil crack spread 2.7%, Heating Oil crack spread 3.2%, Gasoline crack spread 14.3%, TAIEX 2.2%, Nikkei 225 1.6%, IGPA 1.4%, TA35 1.6% and the ASX Small Caps rose 1.3%.
The group of largest decliners for the week included;
Richards Bay Coal (2.1%), Rotterdam Coal (1.4%), Baltic Dry Index (3.9%), Cocoa (10.6%), Cotton (5.7%), Hogs (4.2%), JKM LNG (4.2%), Arabica Coffee (1.8%), Lumber (5.6%), Cattle (1.7%), JKM LNG in Yen (4.4%), Lithium Carbonate (1.9%), Lithium Hydroxide (2.2%), Newcastle Coal (3.1%), Orange Juice (3%), Robusta Coffee (3.7%), Sugar (4.4%), Rice (2.4%), Wheat (1.5%), All World Developed ex USA (1.6%), ATX (1.3%), KBW Banks Index (4.9%), CAC (1.4%), IDX (1.5%), DJ Industrials (1.9%), DJ Transports (2.7%), Saudi Tadawal (2.2%), MIB (1.8%), IBEX (1.6%), S&P SmallCap 600 (2.3%), Dublin (1.7%), Russell 2000 (1.7%), KRE (1.6%), S&P MidCap 400 (1.8%), PSE (3.4%), PX (2.3%), SA40 (2.3%), Eurostoxx 50 (1.4%), BIST (8.2%) and Nasdaq Transports fell 3.3%.
September 20, 2026
By Rob Zdravevski
rob@karriasset.com.au
September 18, 2026 Leave a comment
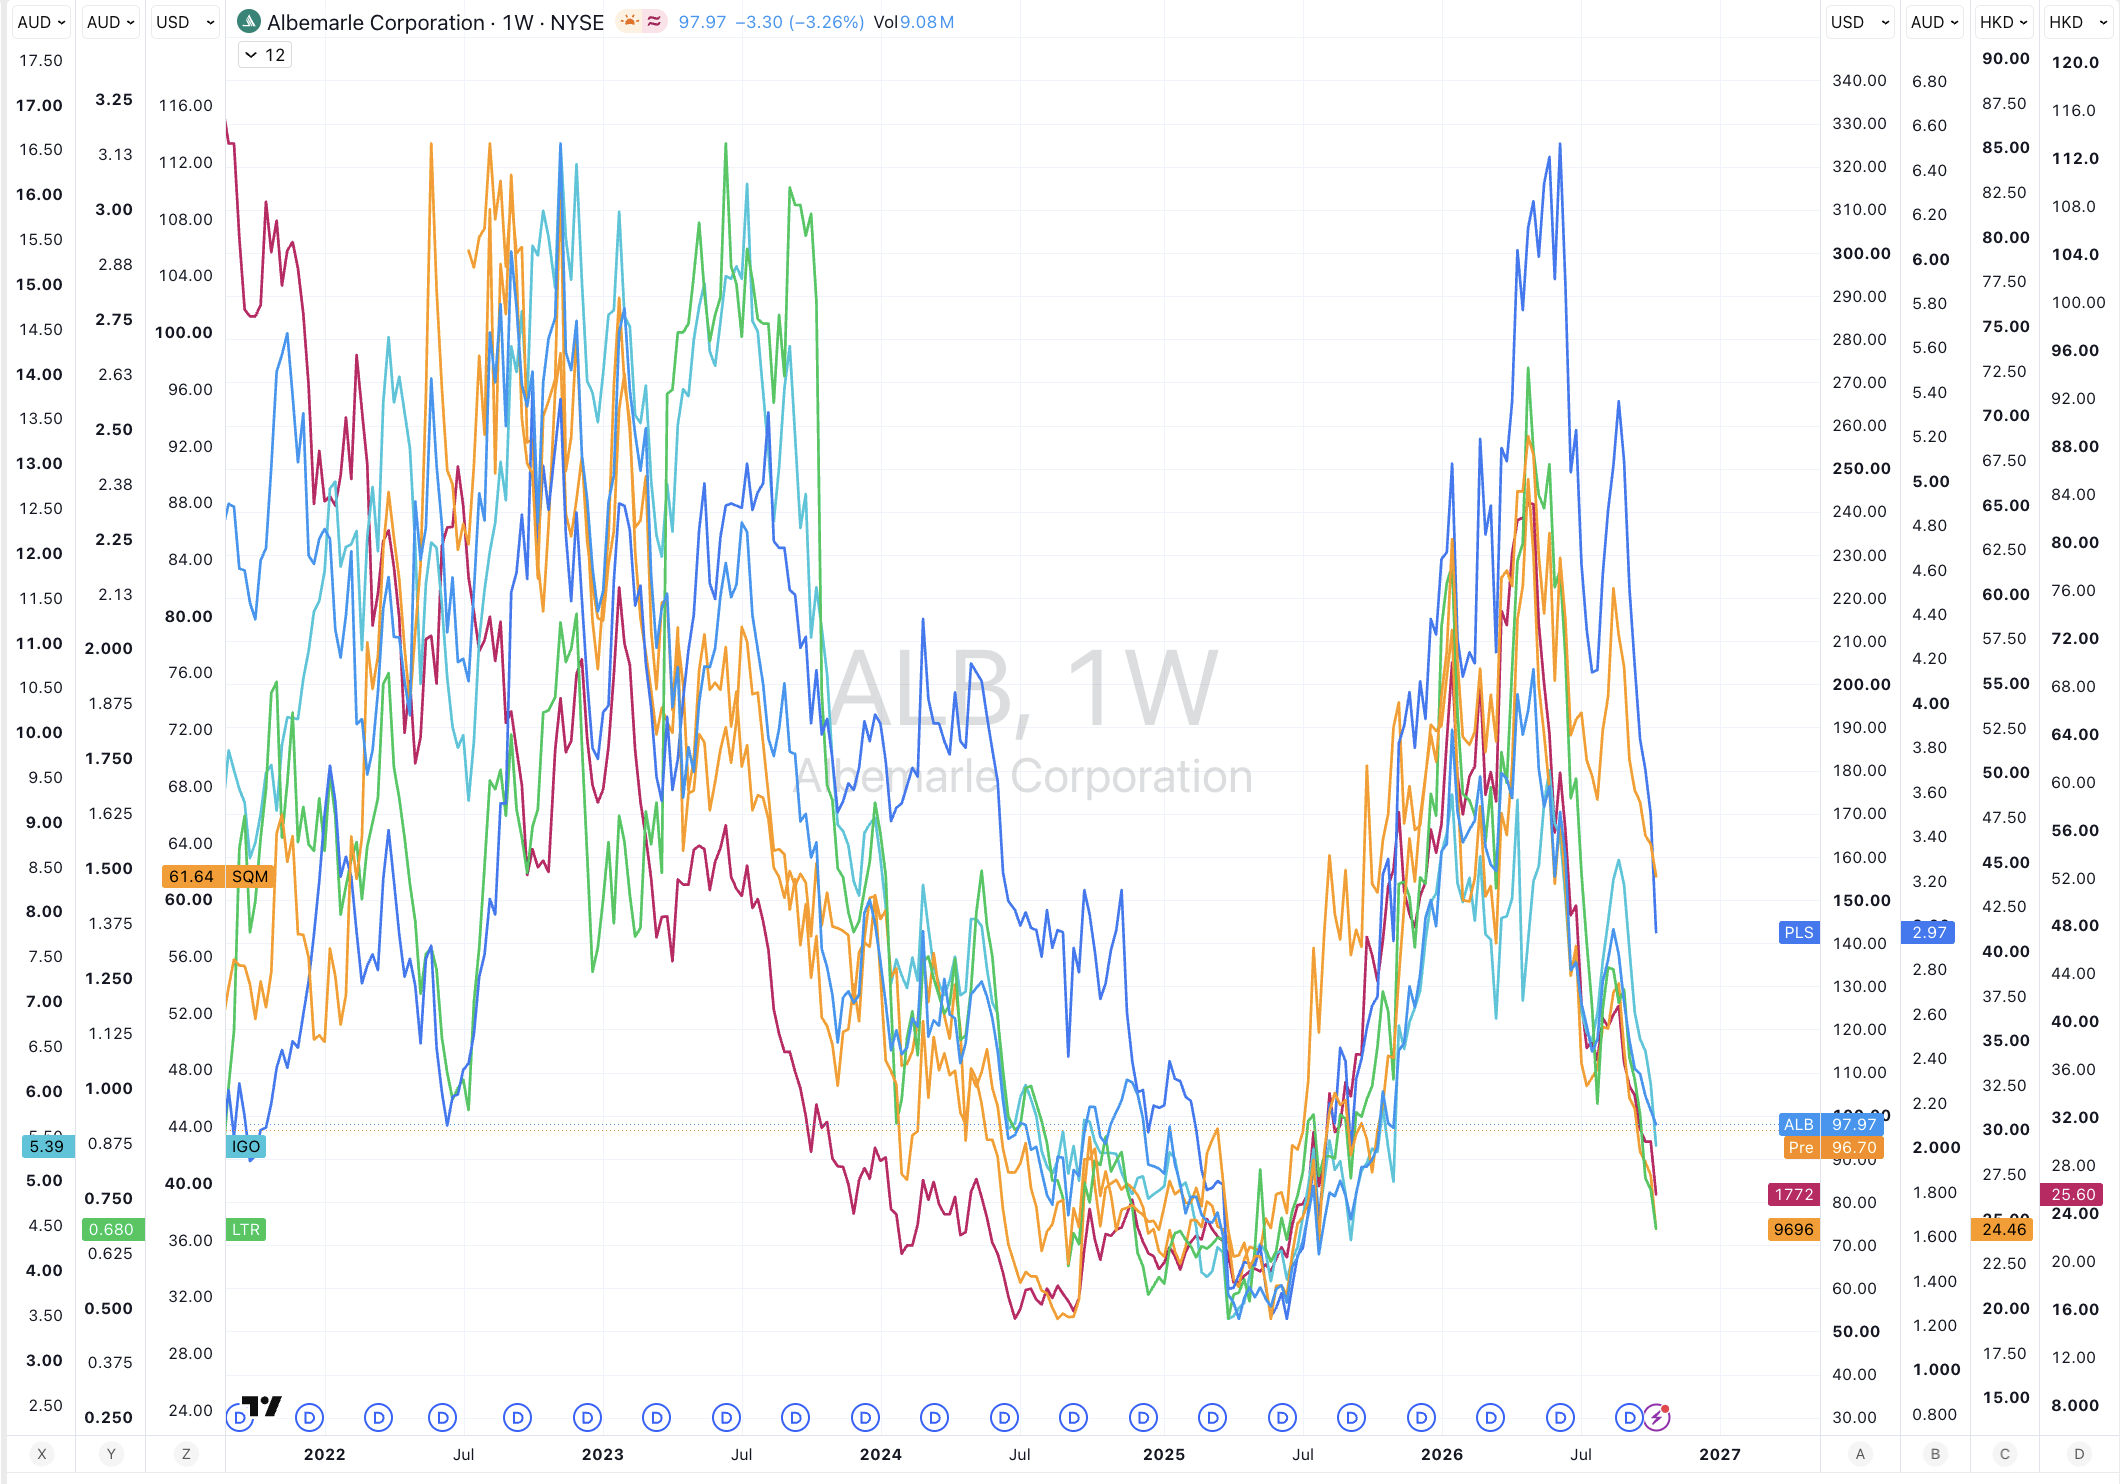
Lithium is retracing a recent pop. There are correlations abound and no is talking about this commodity.
September 18, 2026
#liontown #sqm #albermarle #pls

September 18, 2026 Leave a comment
I’m tinkering about being long stocks in the Materials sector…you know, building materials, steel, chemicals, aggregates etc;
but I think the Materials Index peaks first, and then 2-4 months later, bond yields peak.
So, I may wait 4 months to buy “Materials” and perhaps around the same time, advise to also increase fixed income exposure.
Just some thinking at this stage.
September 18, 2026

September 16, 2026 Leave a comment
A major component of my work is that I provide evidence based empirical price analysis and probability reasoning to investors to assist validating the decision of “why today was the day that you bought, added, lightened or exited a security”.
You can like a stock (or any other asset) because of its theme or story, but prices matter and they tell you everything.
Today, I’m highlighting Hong Kong listed stock JD.Com (9618:HK).
My read of the tape says this stock falls from its current price of HK$105 to HK$91.
September 16, 2026
rob@karriasset.com.au

September 13, 2026 Leave a comment
A weekly Macro, Cross Asset review of prices trading at extremes which may generate future investment ideas and opportunities.
The following assets (on a weekly timeframe) either registered an Overbought or Oversold reading and/or have traded more than 2.5 standard deviations above or below its rolling mean.
n.b. pricing of (commodity) futures contracts is only considering the immediate front month.
* denotes multiple week inclusion
Austrian, Belgian, Spanish, Greek, Irish, Kiwi and Portuguese 10-year government bond yields
British yield curve except the 30’s
U.S. high yield and BB Index
Richards Bay Coal
Rotterdam Coal
WTI Crude
North American Hot Rolled Coiled Steel *
Japanese 2, 5 and 10-year bond yield *
U.S. 5-year bond yield minus 5-year inflation breakeven rate spread *
U.S. 10-year bond yield minus 10-year inflation breakeven rate spread *
JKM LNG in $ *
Rice *
Heating Oil crack spread *
AUD/CHF *
CNH/USD *
COP/USD
Austria’s ATX Index *
Hungary’s BUX Index
Norway’s OBX *
And Poland’s WIG Index *
Belgian, Canadian, Danish, Finnish, French, Italian and Dutch 10-year government bond yields
The Australian, EU, U.S. yield curve (except for the 30’s)
U.S. 5–7-year corporate bond yields
TBX
Heating Oil *
JKM LNG in Yen *
Gasoline *
Sugar *
Dutch TTF Gas
Gasoil *
Gasoil crack spread *
SHY
AUD/JPY
CAD/JPY *
CHF/AUD *
EUR/JPY *
GBP/JPY
USD/JPY
FCATC Index
USD/KRW *
CHF/JPY *
Government bond yields saw the most action and rose, again except for Brazilian 10’s.
Indian 10 year and U.S. 2- and 3-year bond yields have climb for 4 weeks.
Austrian, Belgian, Czech, Danish, Spanish, EU curve, Finnish, French, British curve, Greek, Irish, Italian, Dutch, Polish, Portuguese and Swedish 10-year yields have risen for 5 consecutive weeks.
As have the U.S. 5- and 7-year yields.
Australian 3-, 5- and 10-year yields, along with Japanese 2’s are in a 6-week winning streaks.
While the U.S. 30 minus 10-year yield spread has closed lower for the past 4 weeks.
Equities were mixed.
The Dow Jones Transports, S&P Small Cap 600 and TSX have declined for 4 weeks.
The CSI 300, CAC 40, China A50, FCATC, Nifty, Sensex and Nasdaq Transports are in 5-week losing streaks.
Brazil’s Bovespa has advanced for the past 4 weeks.
And Norway’s OBX is in a 9-week winning streak.
Commodities prices told a mixed story.
Coal, Oil, Distillates, Gases, Sugar and Rice were the notable gainers.
Cocoa, Cotton, Coffee, Lithium, Palladium, and Corn were amongst the largest decliners.
Many streaks came to an end while,
Rice and U.S. Guld Urea prices have climbed for 4 weeks.
JKM LNG, Gasoline, Dutch TTF and the Gasoil Oil crack spread are in 5-week winning streaks.
And Tin has fallen for 4 weeks.
Currencies were quieter.
The Aussie was mixed but mainly took a breather.
mainly higher.
AUD/EUR fell and broke a 5-week winning streak.
The Euro and Yen rose.
The latter features in this week’s list.
Kiwi was weaker.
The U.S. Dollar saw strength.
While the USD/KRW has fallen for 4 weeks.
And the PHP/USD has fallen for 5 weeks.
The larger advancers over the past week comprised of;
Bloomberg Commodity Index 1.7%, Brent Crude 8.7%, WTI Crude 9.4%, Heating Oil 9.2%, JKM LNG 3.6%, Lumber 1.6%, Cattle 3.2%, JKM LNG in Yen 12.8%, Gasoline 2.9%, Robusta Coffee 2.8%, S&P GSCI 2.2%, Dutch TTF Gas 10.5%, Urea U.S. Gulf 1.8%, Gasoil 12.9%, Oats 2.8%, Gasoil crack 11.1%, Heating Oil crack 7.6%, BUX 3.2%, Kospi 3.3%, Helsinki 1.3% and BIST rose 3.3%.
The group of largest decliners for the week included;
Australian Coking Coal (2.6%), Aluminium (1.9%), Baltic Dry Index (3.3%), Cocoa (3.7%), EHR (1.9%), Palm Oil (2.3%), Copper (2%), Arabica Coffee (3.4%), Lithium Carbonate (2.8%), Newcastle Coal (3.3%), Natural Gas (4.8%), Nickel (2.3%), Orange Juice (7%), Palladium (5.7%), Platinum (1.6%), Tin (2.7%), Silver (2.6%), Gold (1.8%), Gasoline crack (8%), Naphtha (7.1%), ZEX (1.3%), IDX (1.4%), DAX (1.8%), DJ Industrials (1.8%), FCATC (3.1%), HSCEI (3.6%), Hang Seng (3.3%), IBB (4.2%), S&P SmallCap 600 2.2%, KRE (1.8%), KSE (2.8%), FTSE 250 (2.5%), S&P MidCap 400 (1.9%), Mexico (1.5%), NBI (4.3%), Nikkei 225 (1.6%), Nifty (2.1%), Copenhagen (2.5%), Russell 2000 (2.4%), Sensex (2.3%), SMI (4.3%), IGPA (1.9%), STI (1.8%), Nasdaq Transports (1.8%), TSX (2.2%), FTSE 100 (1.7%), Vietnam (3.1%), XBI (4.7%), ASX Financials (2.3%), ASX 200 (2.9%), ASX Materials (3.9%) and ASX Small Caps fell 3%.
September 13, 2026
By Rob Zdravevski
rob@karriasset.com.au
September 11, 2026 Leave a comment
I like the ‘long’ commodity trade, particularly the ‘harder commodities’, but the beginning of the upward move began more than a year ago, and it wouldn’t have hurt to have gotten set earlier than that.
You’ll see an example of that in the chart of the Van Eck Australian Resource ETF pasted below.

At the beginning of the decade, I was a commodity bear and then in mid- 2023, I started writing about my ‘warming’ to commodities.
Now, I’m looking for a retracement.
Recently, cartwheels and backflips were being done when BHP’s share price was heralded as the largest capitalised company on the ASX.
Anyway, I think BHP’s stock price can decline at least 30% from its recent peak.

September 11, 2026
rob@karriasset.com.au
September 11, 2026 Leave a comment
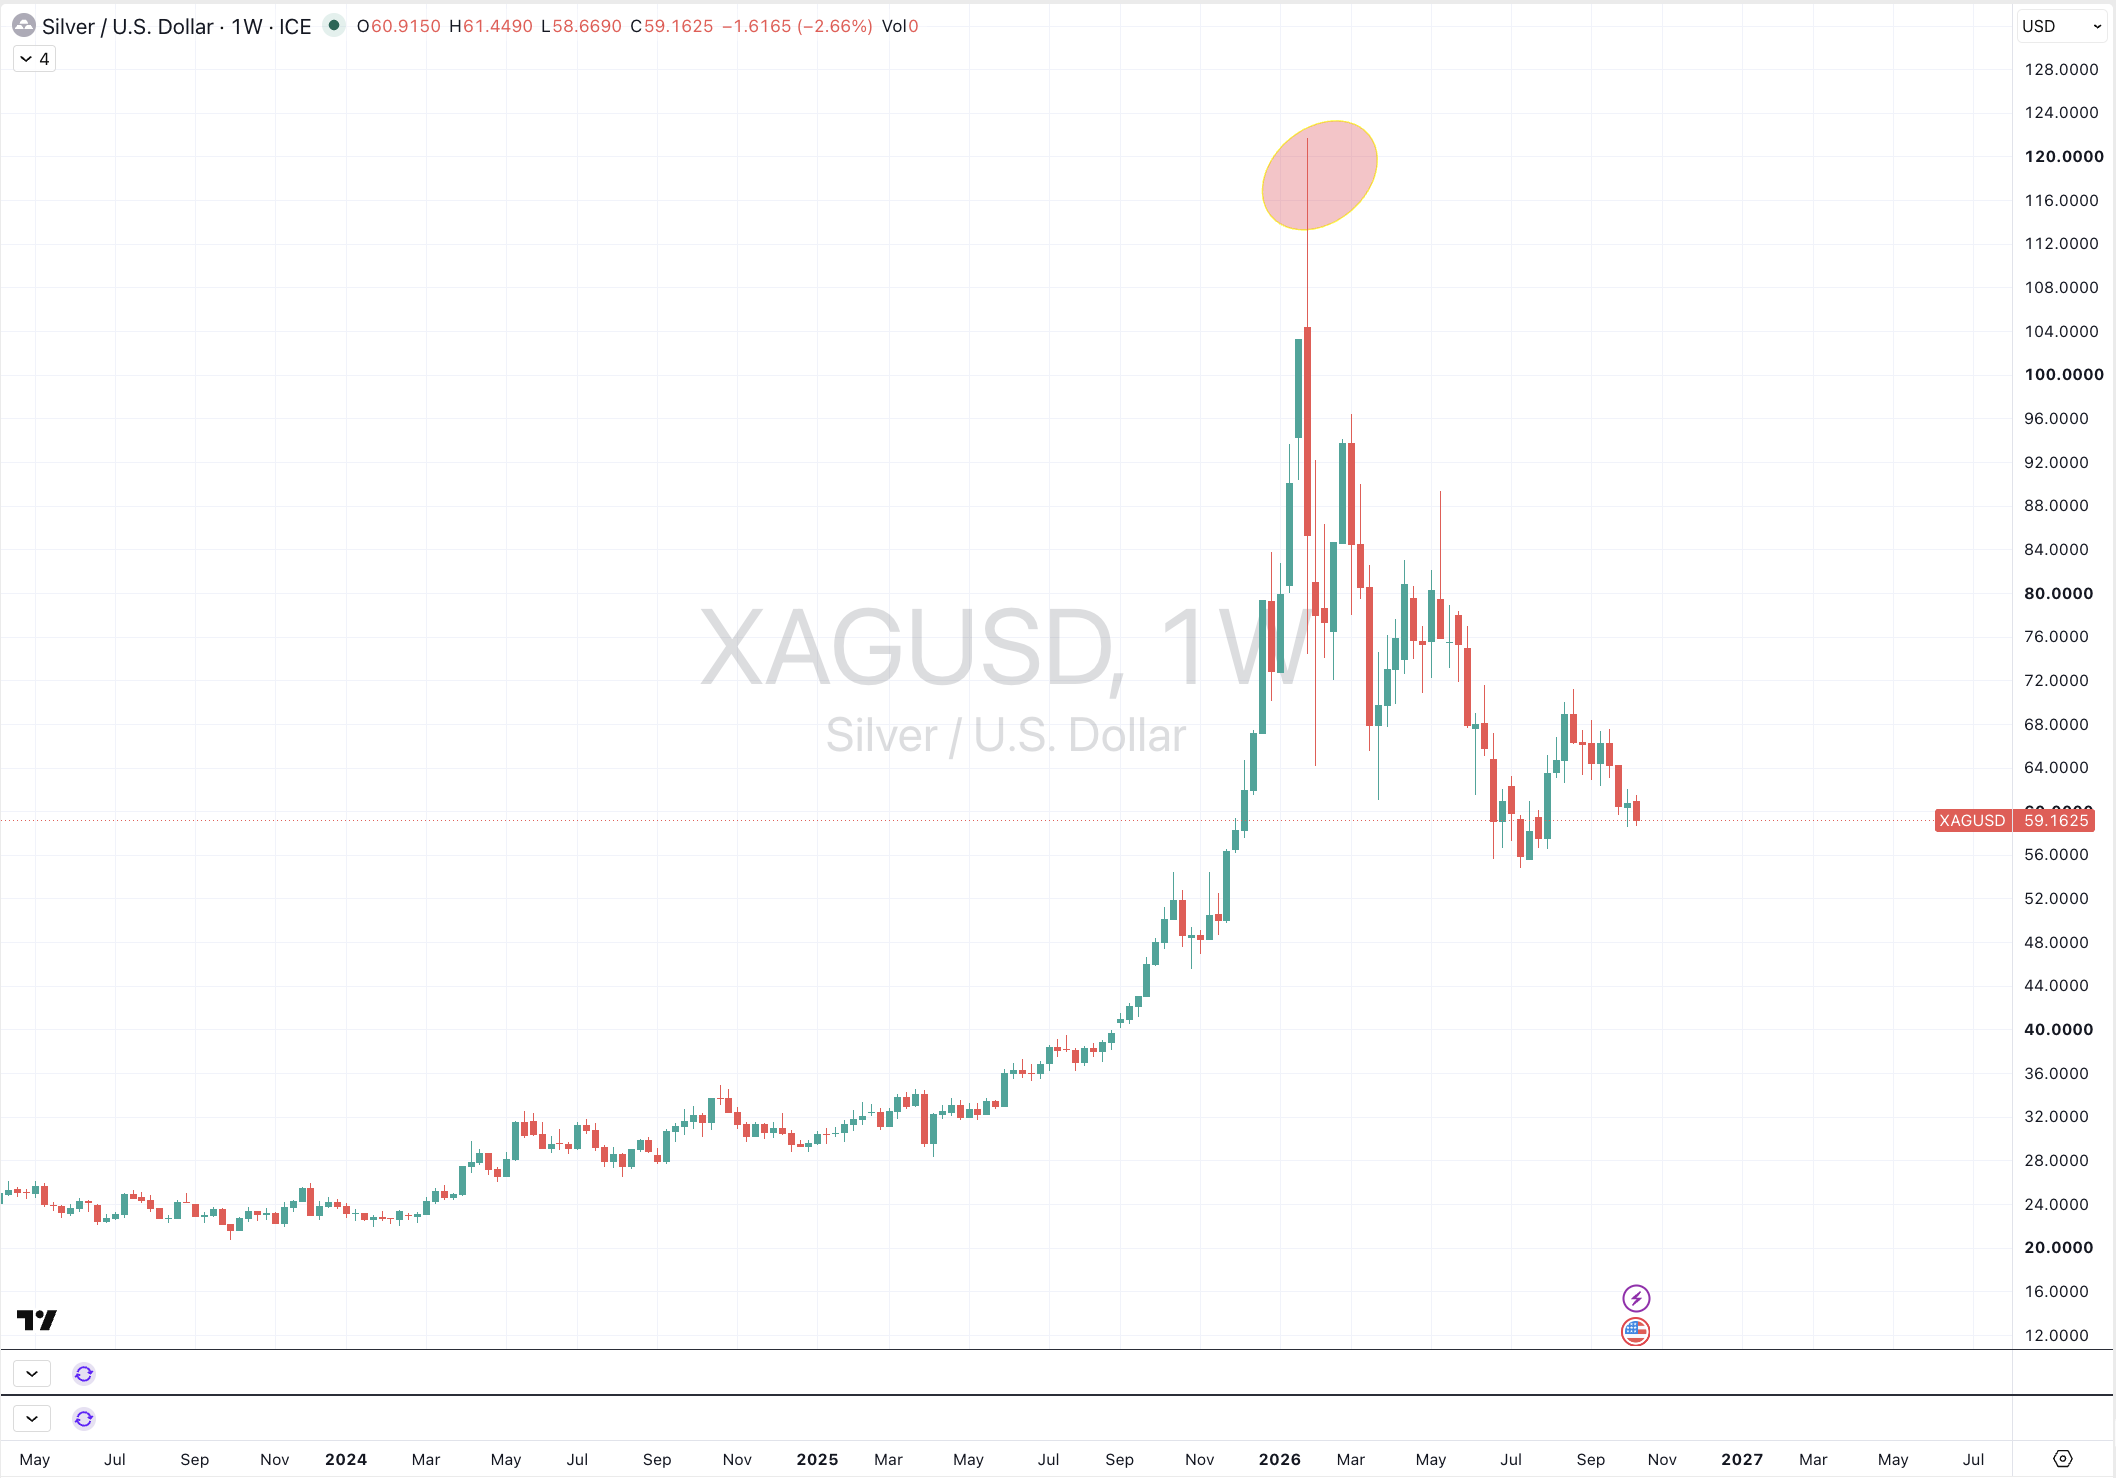
My June 19, 2026 Gold price call said the pullback was done.
An interim rally was indeed seen.
But my call of USD Gold visiting the US$3,100 region still stands.
September 11, 2026
rob@karriasset.com.au

September 11, 2026 Leave a comment
EU 10 year bond yields are registering one of my overbought quinellas for the first time since September 2022.
They’ll appear in this weekend’s edition of my Macro Extremes.
For now, I’m recognising the upward momentum (which came into effect in late July ’26) as such but my call will be for this yield to pullback to 3% in the medium term, before seeing them settle into a new and higher atmosphere.
Overall, the EU 10 year bond yield is mimicking ‘shapes’ that I’m observing in the U.S. 10 year bond yield.
Incidentally, the U.S. 10 year bond yield is making shapes not seen since 1965.
September 11, 2026
rob@karriasset.com.au