The two most notable parabolic price moves in recent times is being seen in the price of Cocoa and NVIDIA shares.
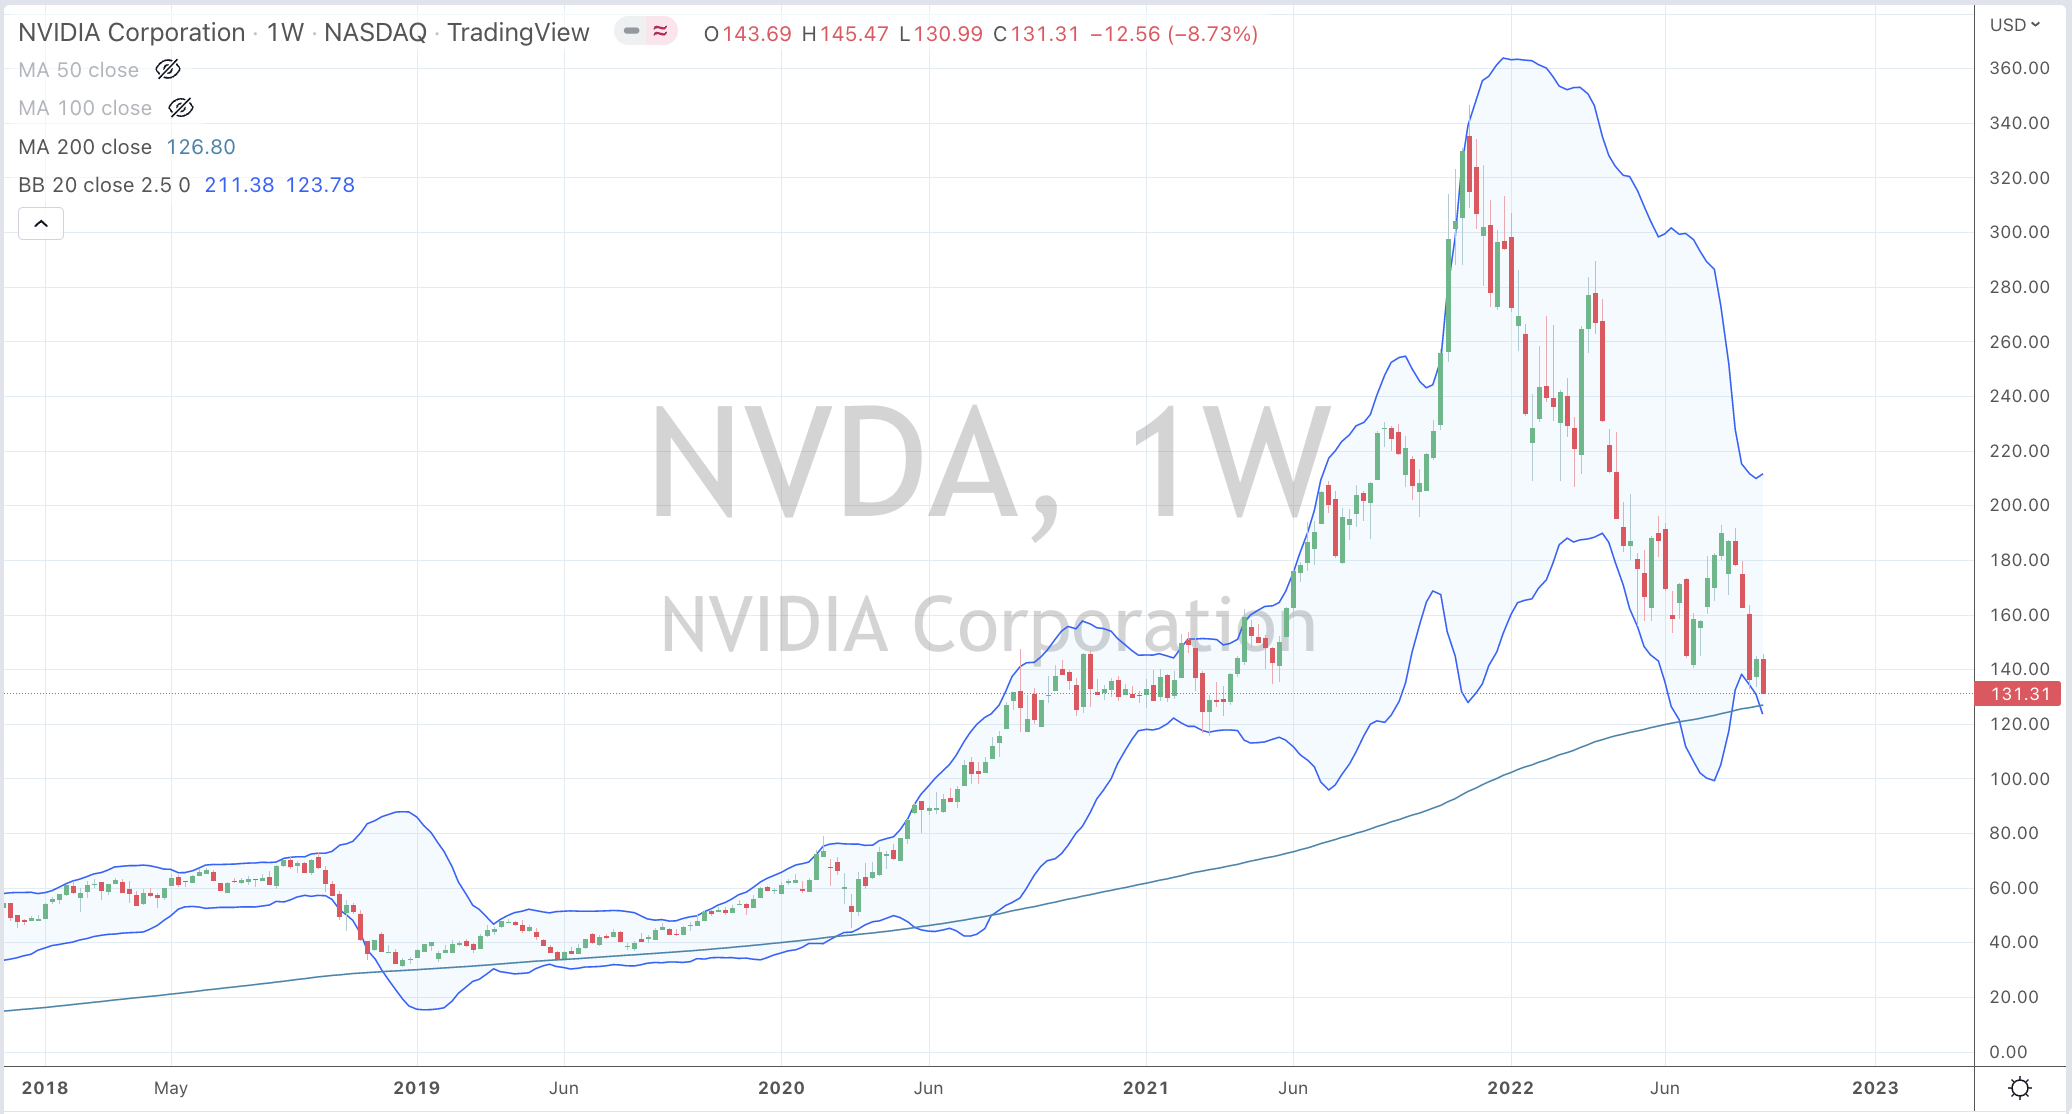
Both prices are trading at stratospheric percentages above their 200 week moving averages.
Cocoa is trading 3.5 standard deviations above its rolling monthly mean and even more astonishing, at US$9,950 per ton, it is more expensive than Copper which is trading at US$8,870 per ton.
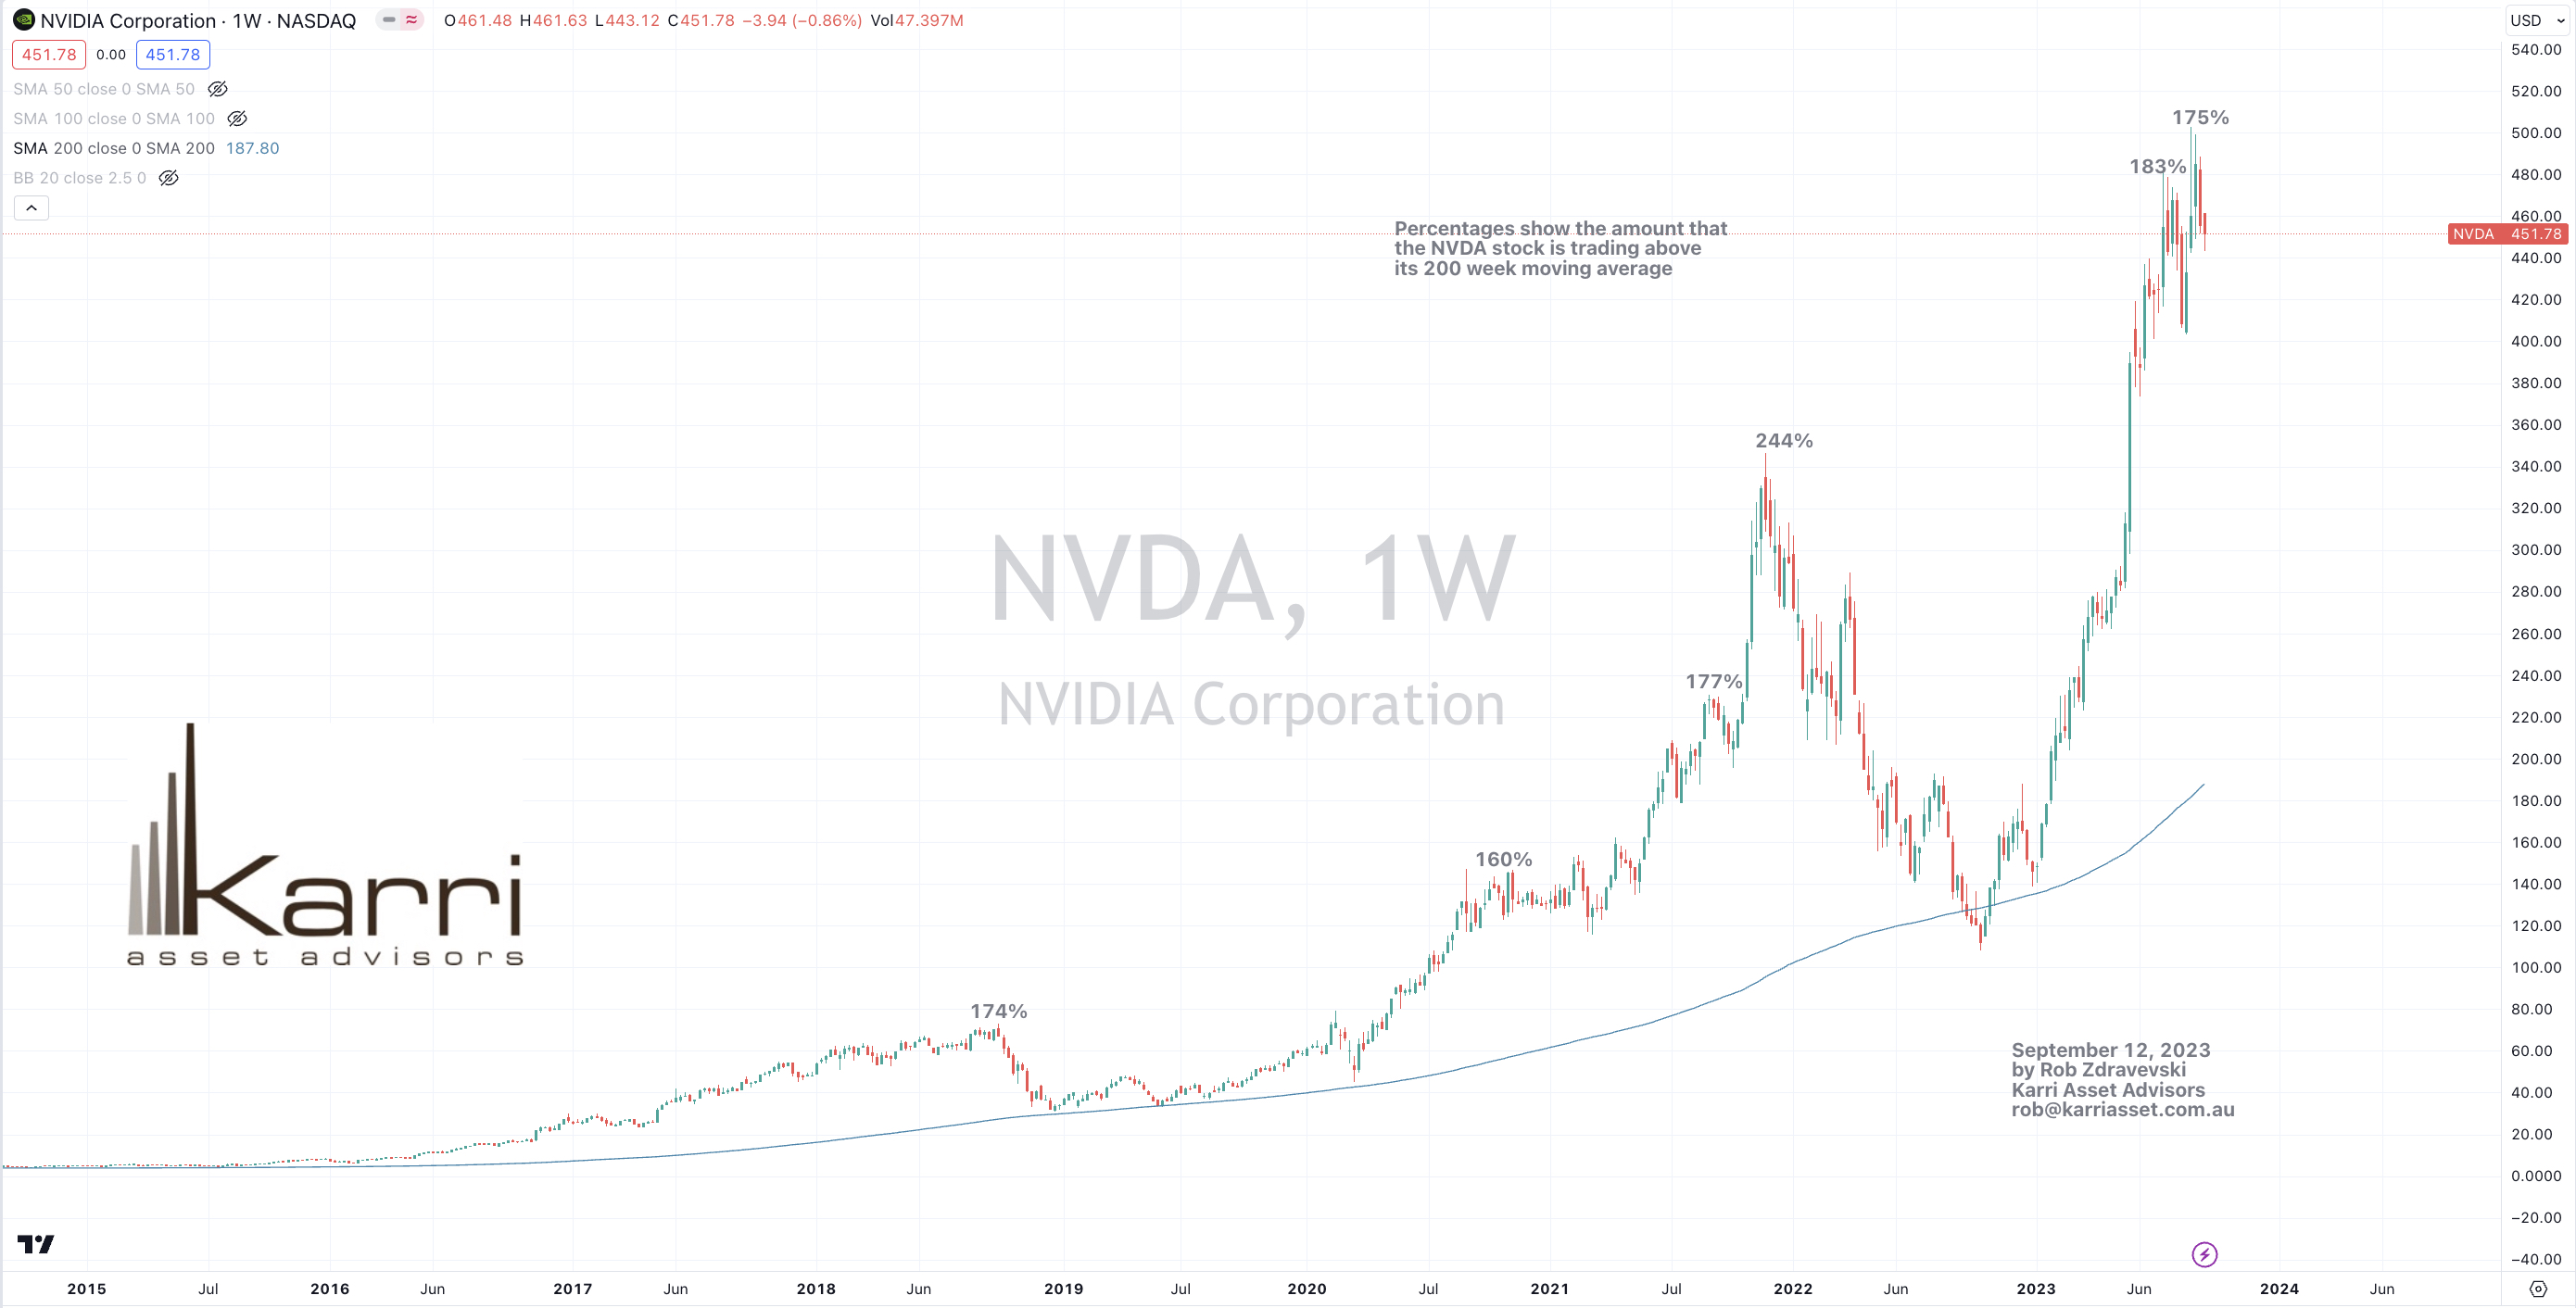
The study below reminds me which atmosphere stocks such as Nvidia (NVDA) are trading within.
It can be useful to those who use words such as “momentum” or “break-outs” as reasons for their investment or speculation decisions.
This study can also be applied to a bunch of the fabled tech darlings.
Keep in mind that mean reversion is a real thing.
What if NVDA’s stock price fell to $240?
While I see demand in certain industries and products, I’m also warning that valuations matter and the world won’t always need a new gadget let alone do we need another subscription software service.
I doubt that productivity, convenience or joy can be increased commensurately.
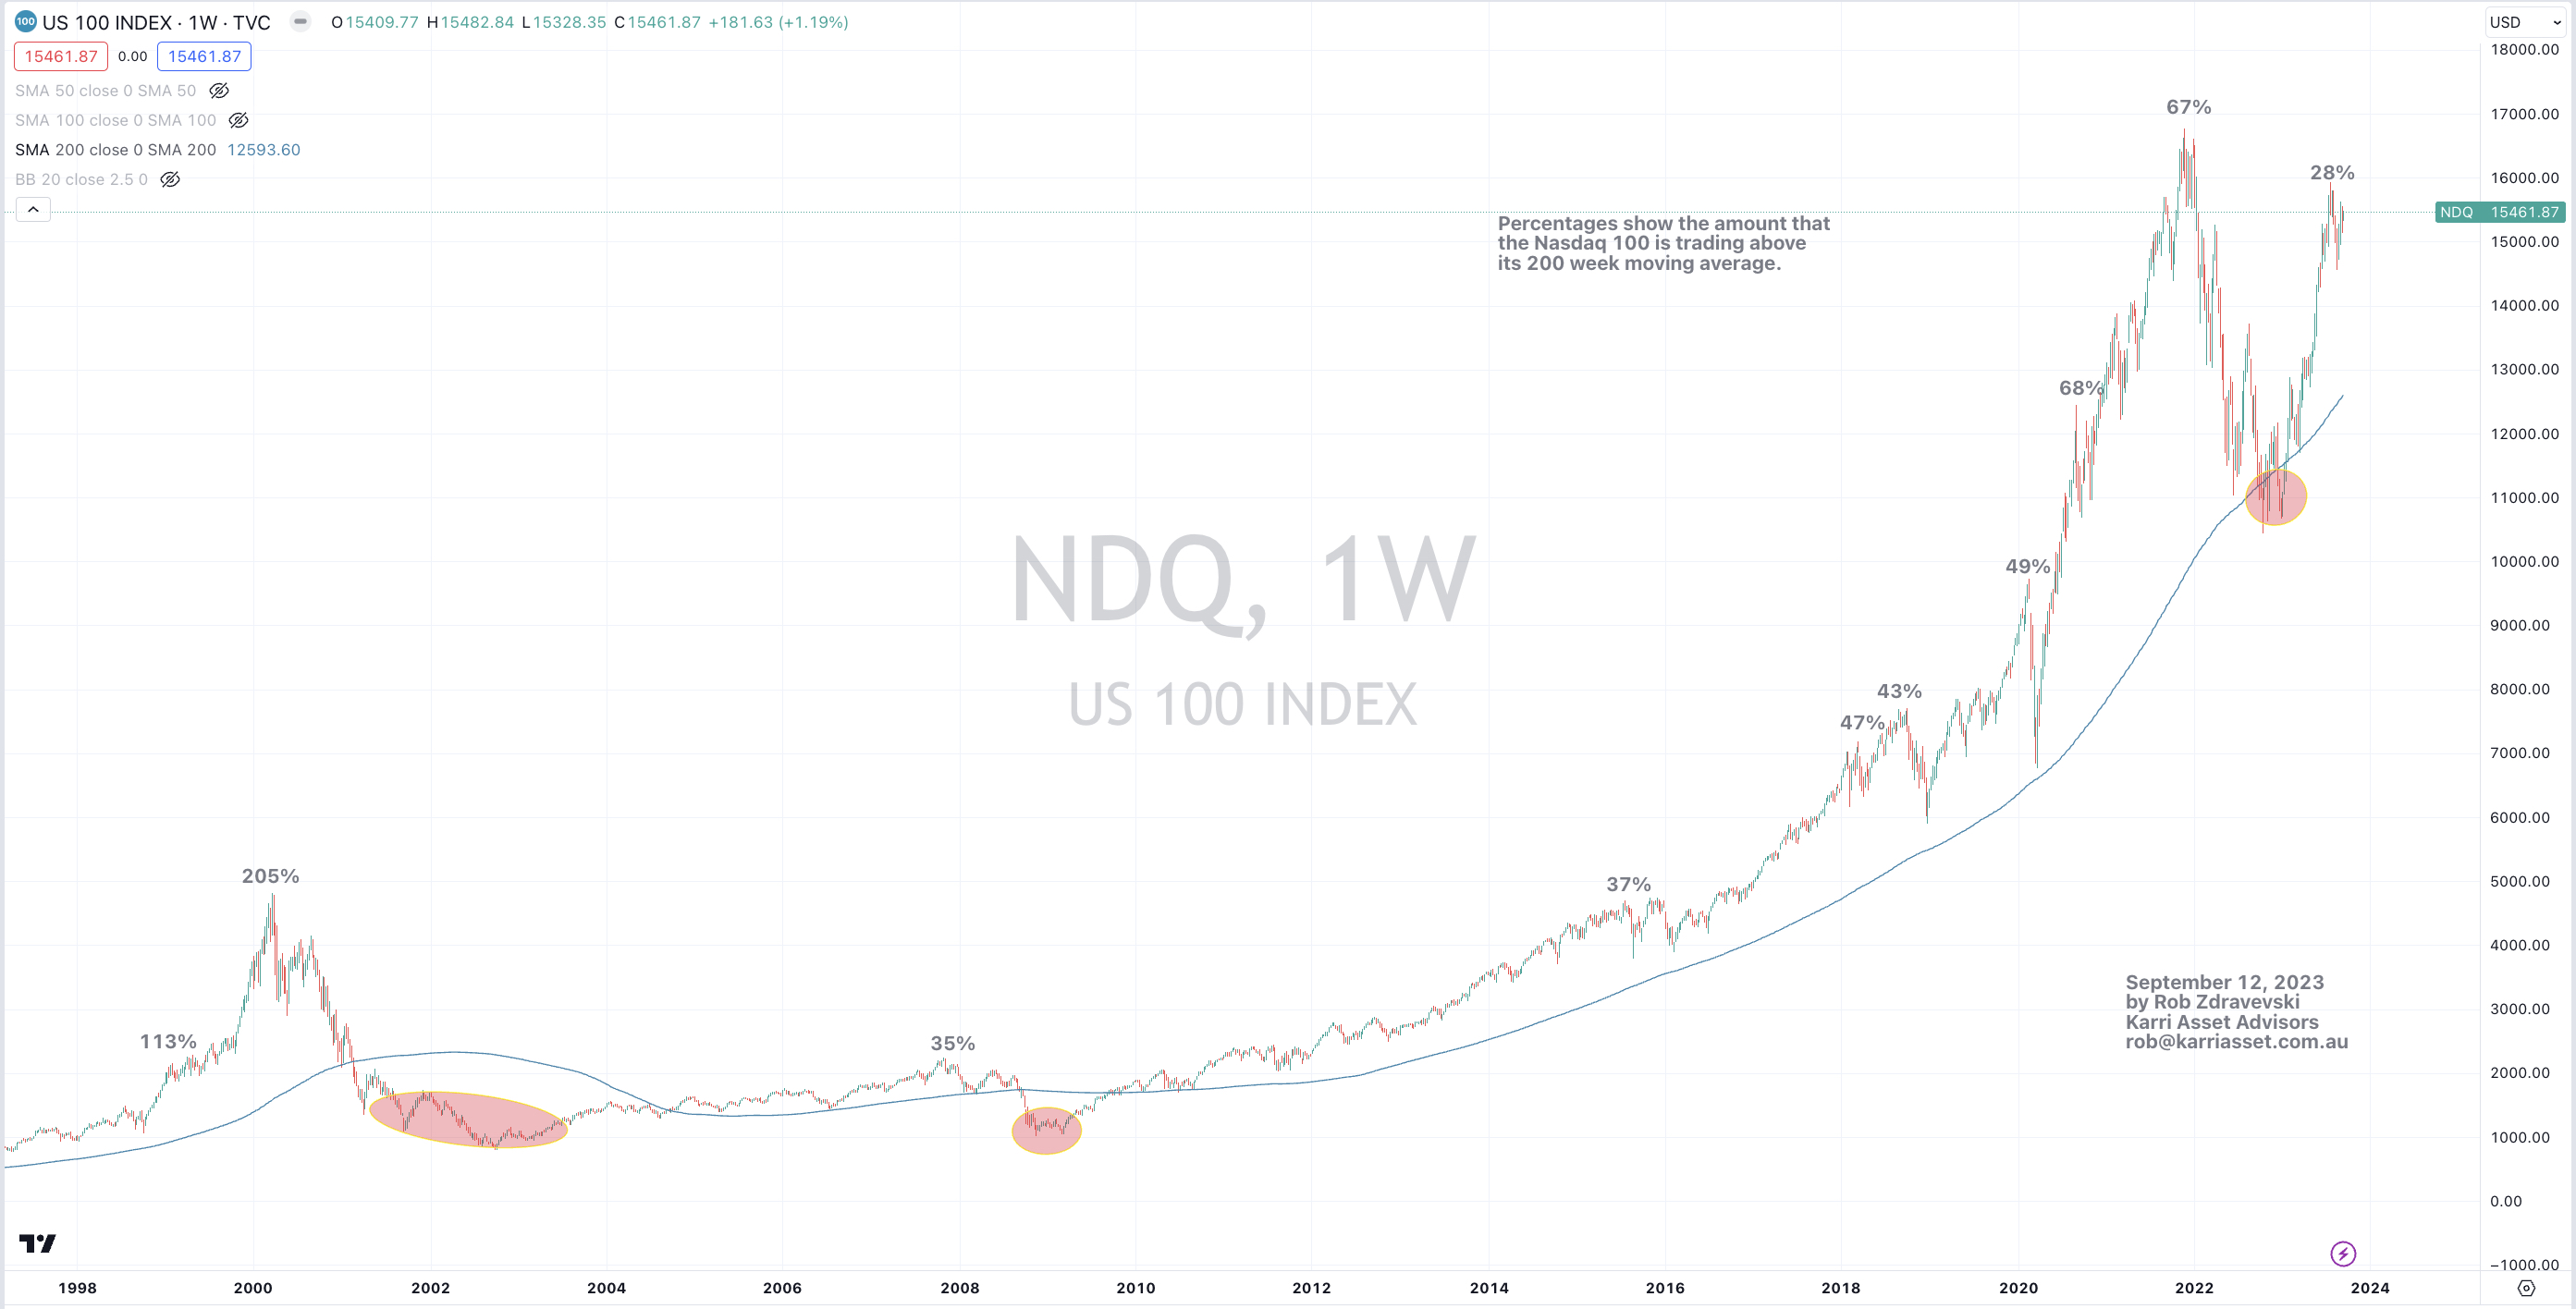
The second attached study features the Nasdaq 100.
Since that mean reversion, we’ve seen another parabolic price move.
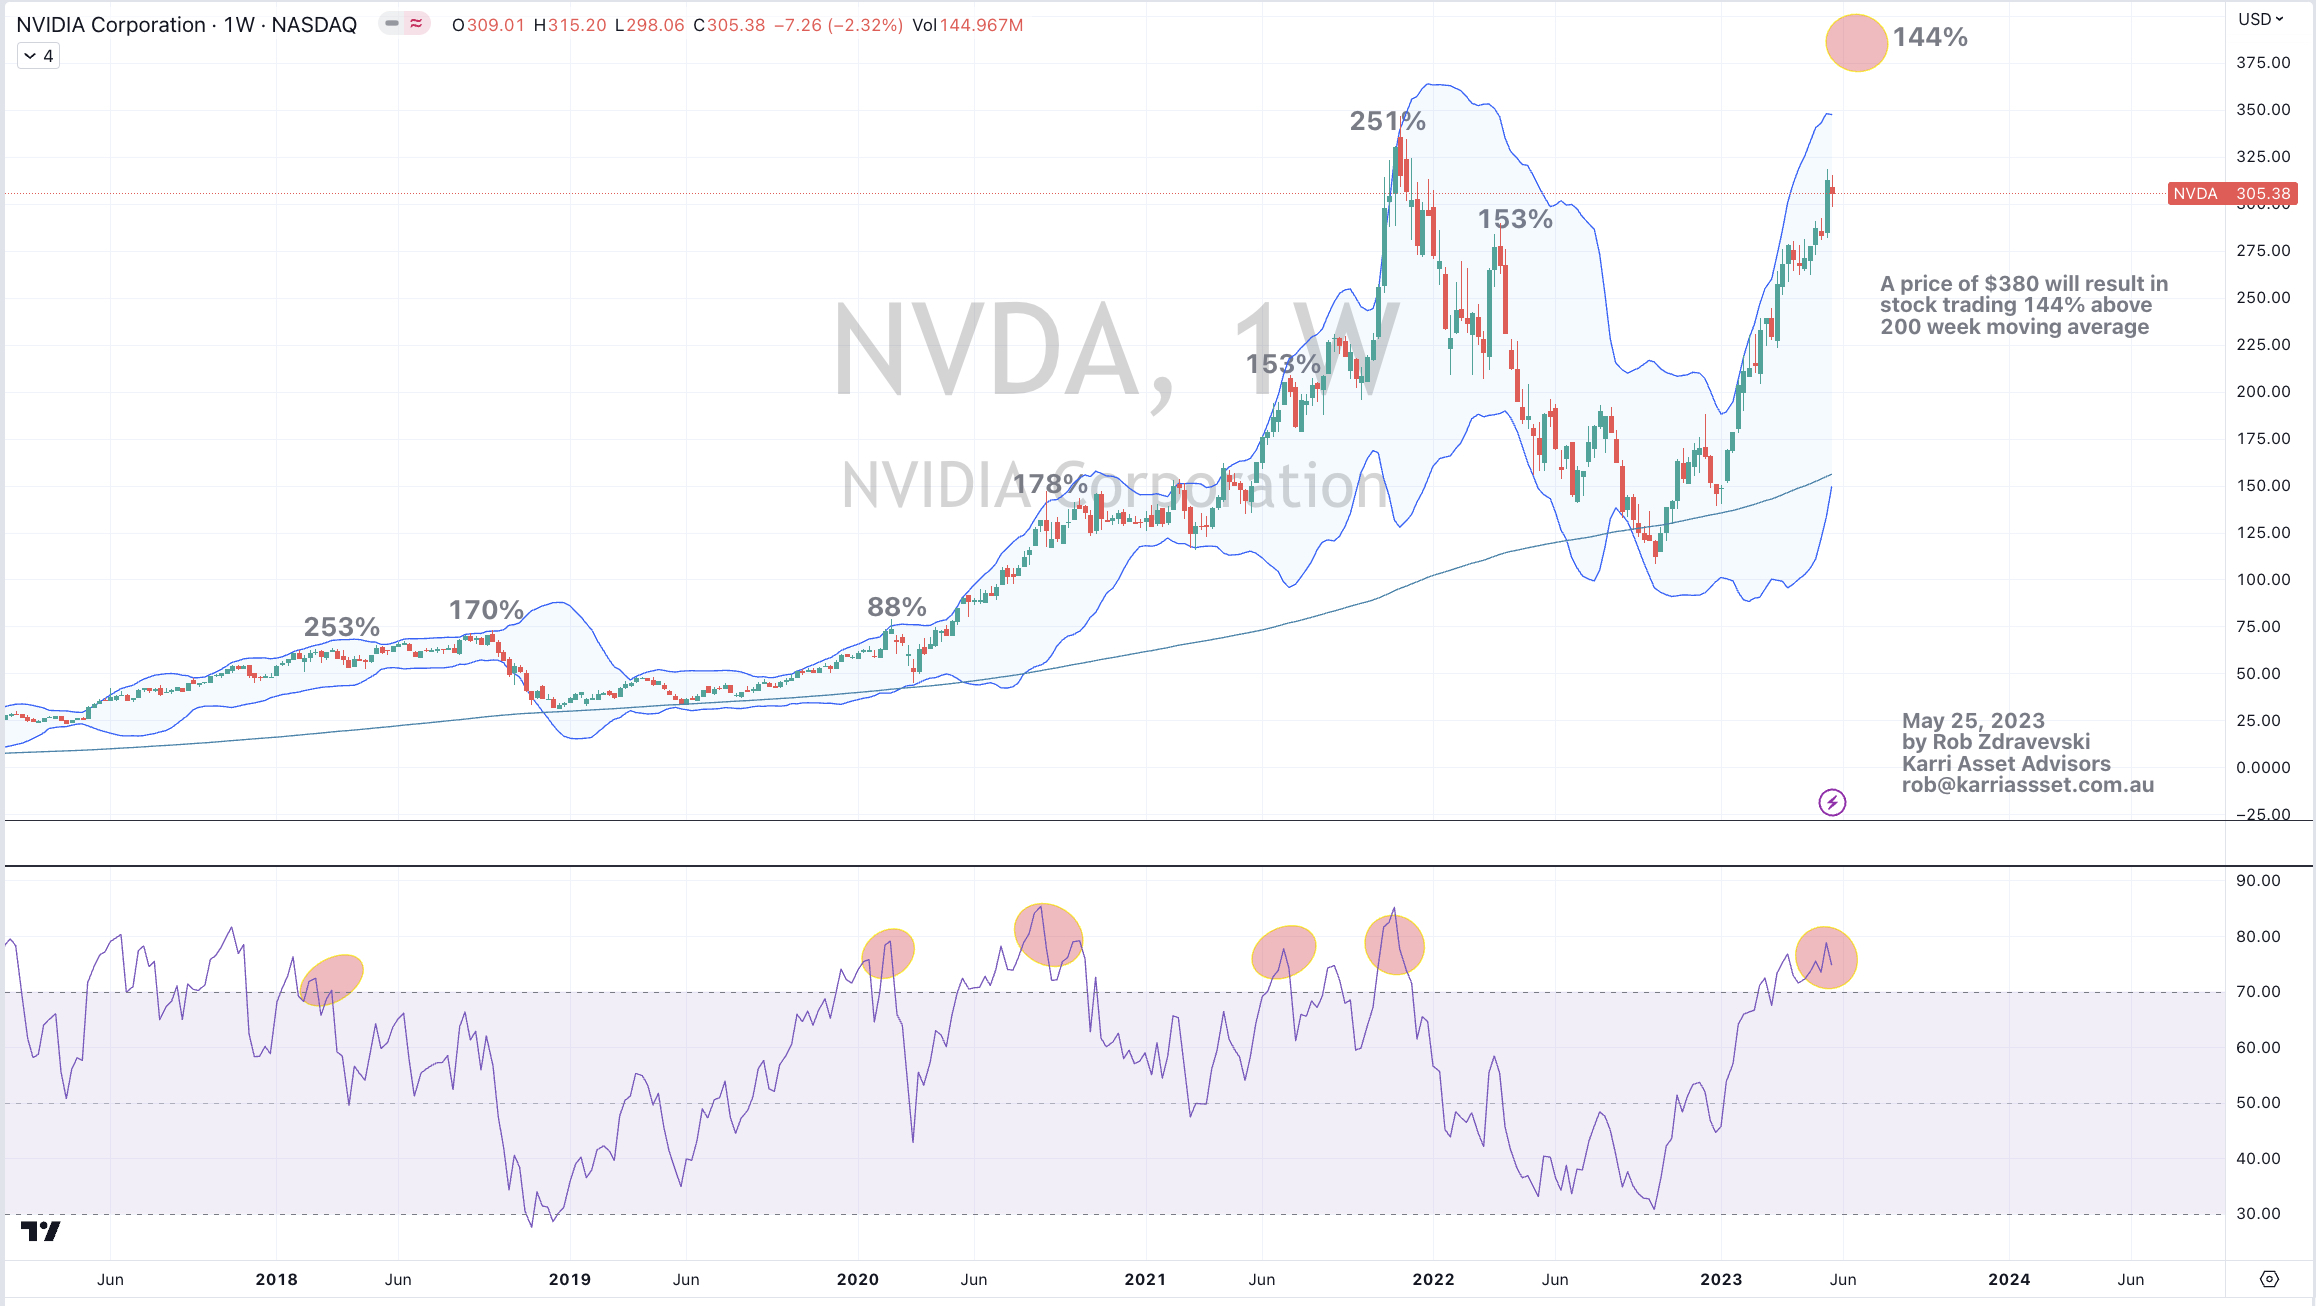
While it’s a stupendous result for those who accumulated the stock down near that $120 level, I’m miffed by the motivations of the buyers in today’s market with the stock in the $380 price region.
The law of large numbers also comes to mind as Nvidia approaches a market capitalisation of $800 billion.
In late 2021 and early 2022, I wrote often about the peak in the equity prices of semiconductor companies.
Then this note on October 11, 2022 (only 4 months ago) suggested a pending low in those related stocks.
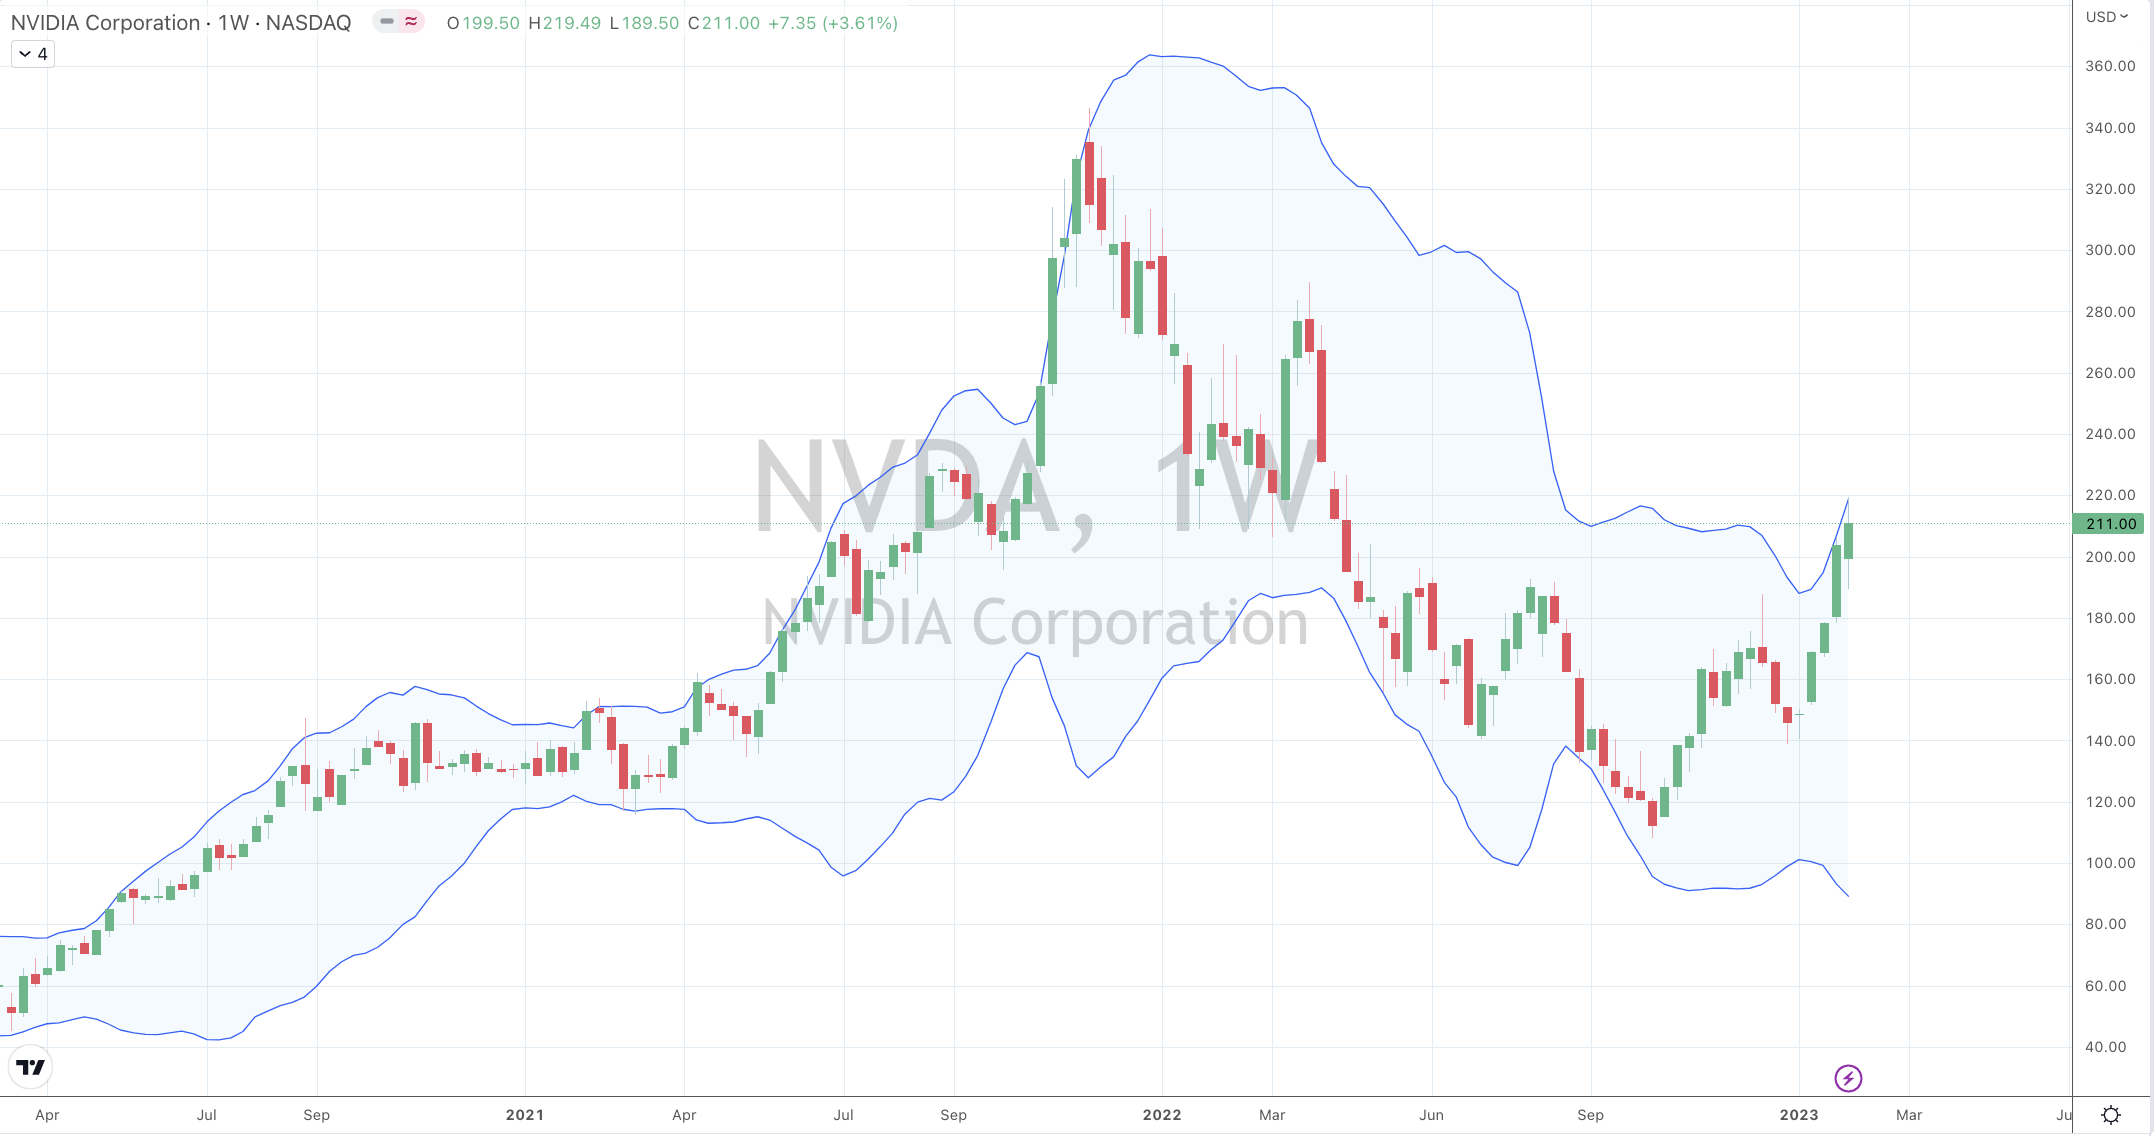
Specifically, I wrote that I was looking for a low in the price of Nvidia stock between $105 – $108 as a buying point.
The next day, it traded to a low of $108.13…..
This week, it was time to get out again.
The intra-week high of $219.49 told me that the ‘fat part of the trade’ has been seen or had.
This call is still valid at the most recent closing price of $211.
Beyond my various reasonings suggesting a current peak……a 102% advance in 4 months should satisfy most {sic} all.
Or put another way, as stellar as the return is, this is a ‘get out of jail free’ card for many, while for anyone who bought this stock before October 2021 remains underwater.
If it’s not a current peak, I am definitely not a buyer of Nvidia with ‘new money’ at the prevailing prices.
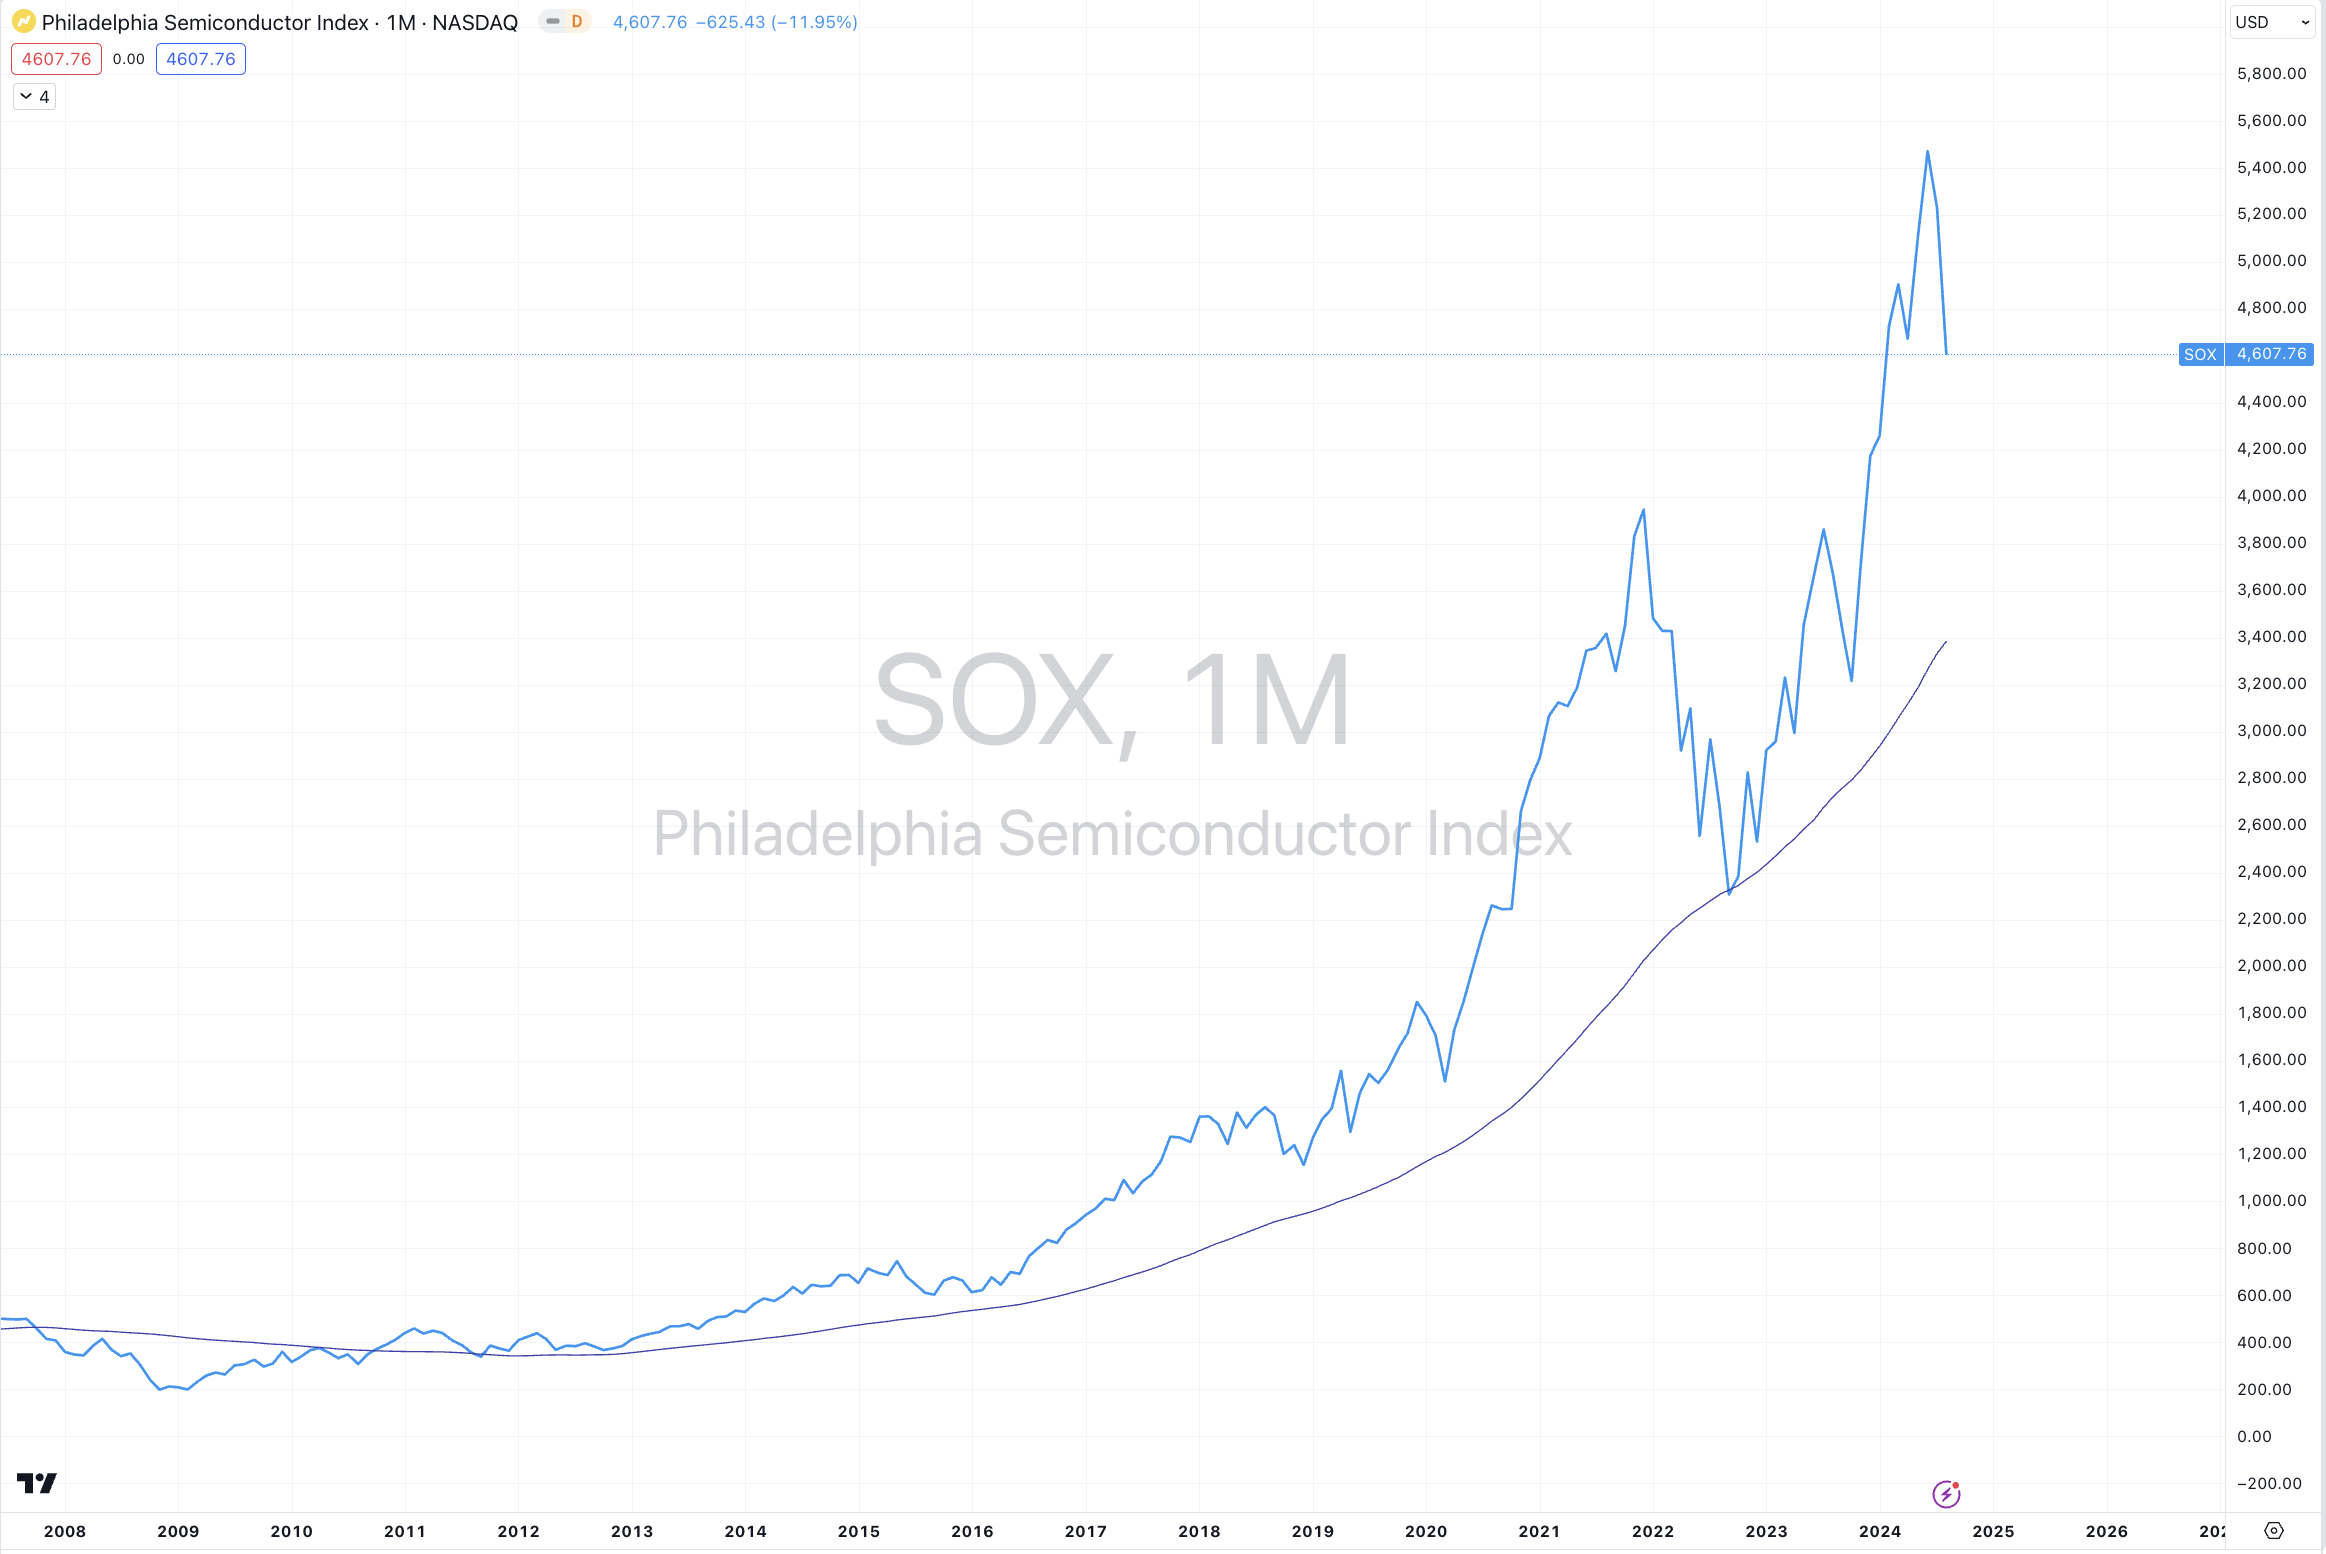
The same goes for the SOX (the Philadelphia Semiconductor Index)