I think #Amazon‘s stock price can trade down to $122 within the year 2025.
Whether it occurs in 2025 is inconsequential.
It’s a larger concern to those buying the stock at any of these lofty levels.
It’s certainly an uncrowded thought and trade.
Should #AMZN‘s sport a market capitalisation which is $1 trillion less than today, I’m thinking of where the money goes to from the selling proceeds during its decline?
and the respondents are more bearish than last week’s result.
and the bullish/bearish spread is negative at (1.5%).
It’s the highest bearish reading since Nov 2, 2023, when the bullish/bearish spread was also negative.
The most recent moment that the bullish/bearish spread was negative was in the April 25, 2024 release.
I have highlighted those 2 moments in the attached S&P 500 price chart.
This is in keeping with my other commentary that while we are late in this particular equity ‘party’ and the VIX is subdued, it looks like equities will ‘rip’ higher.
Like any place where waves are prevalent, you need to watch out for the rips.
Last week’s palaver about unwinding Yen trades is old news.
The Yen has nearly swung to the other side of the pendulum.
The study below shows the 13 moments over the past 15 years when the AUD/JPY was trading (coinciding with a couple other metrics) at a weekly RSI reading of 36 or below.
I say ‘nearly swung’, for we are close but not there yet……for another such occurrence.
When they do occur, they bode well for listed equities risk appetite.
The Nasdaq 100 index appears within my study as a comparison.
It is 1% away from a) trading at 2.5 standard deviations above its rolling weekly mean and b) registering a weekly overbought reading.
Incidentally, it has moved from 2.5 standard deviations (SD) below its weekly mean to 2.5 SD’s above, within 8 weeks.
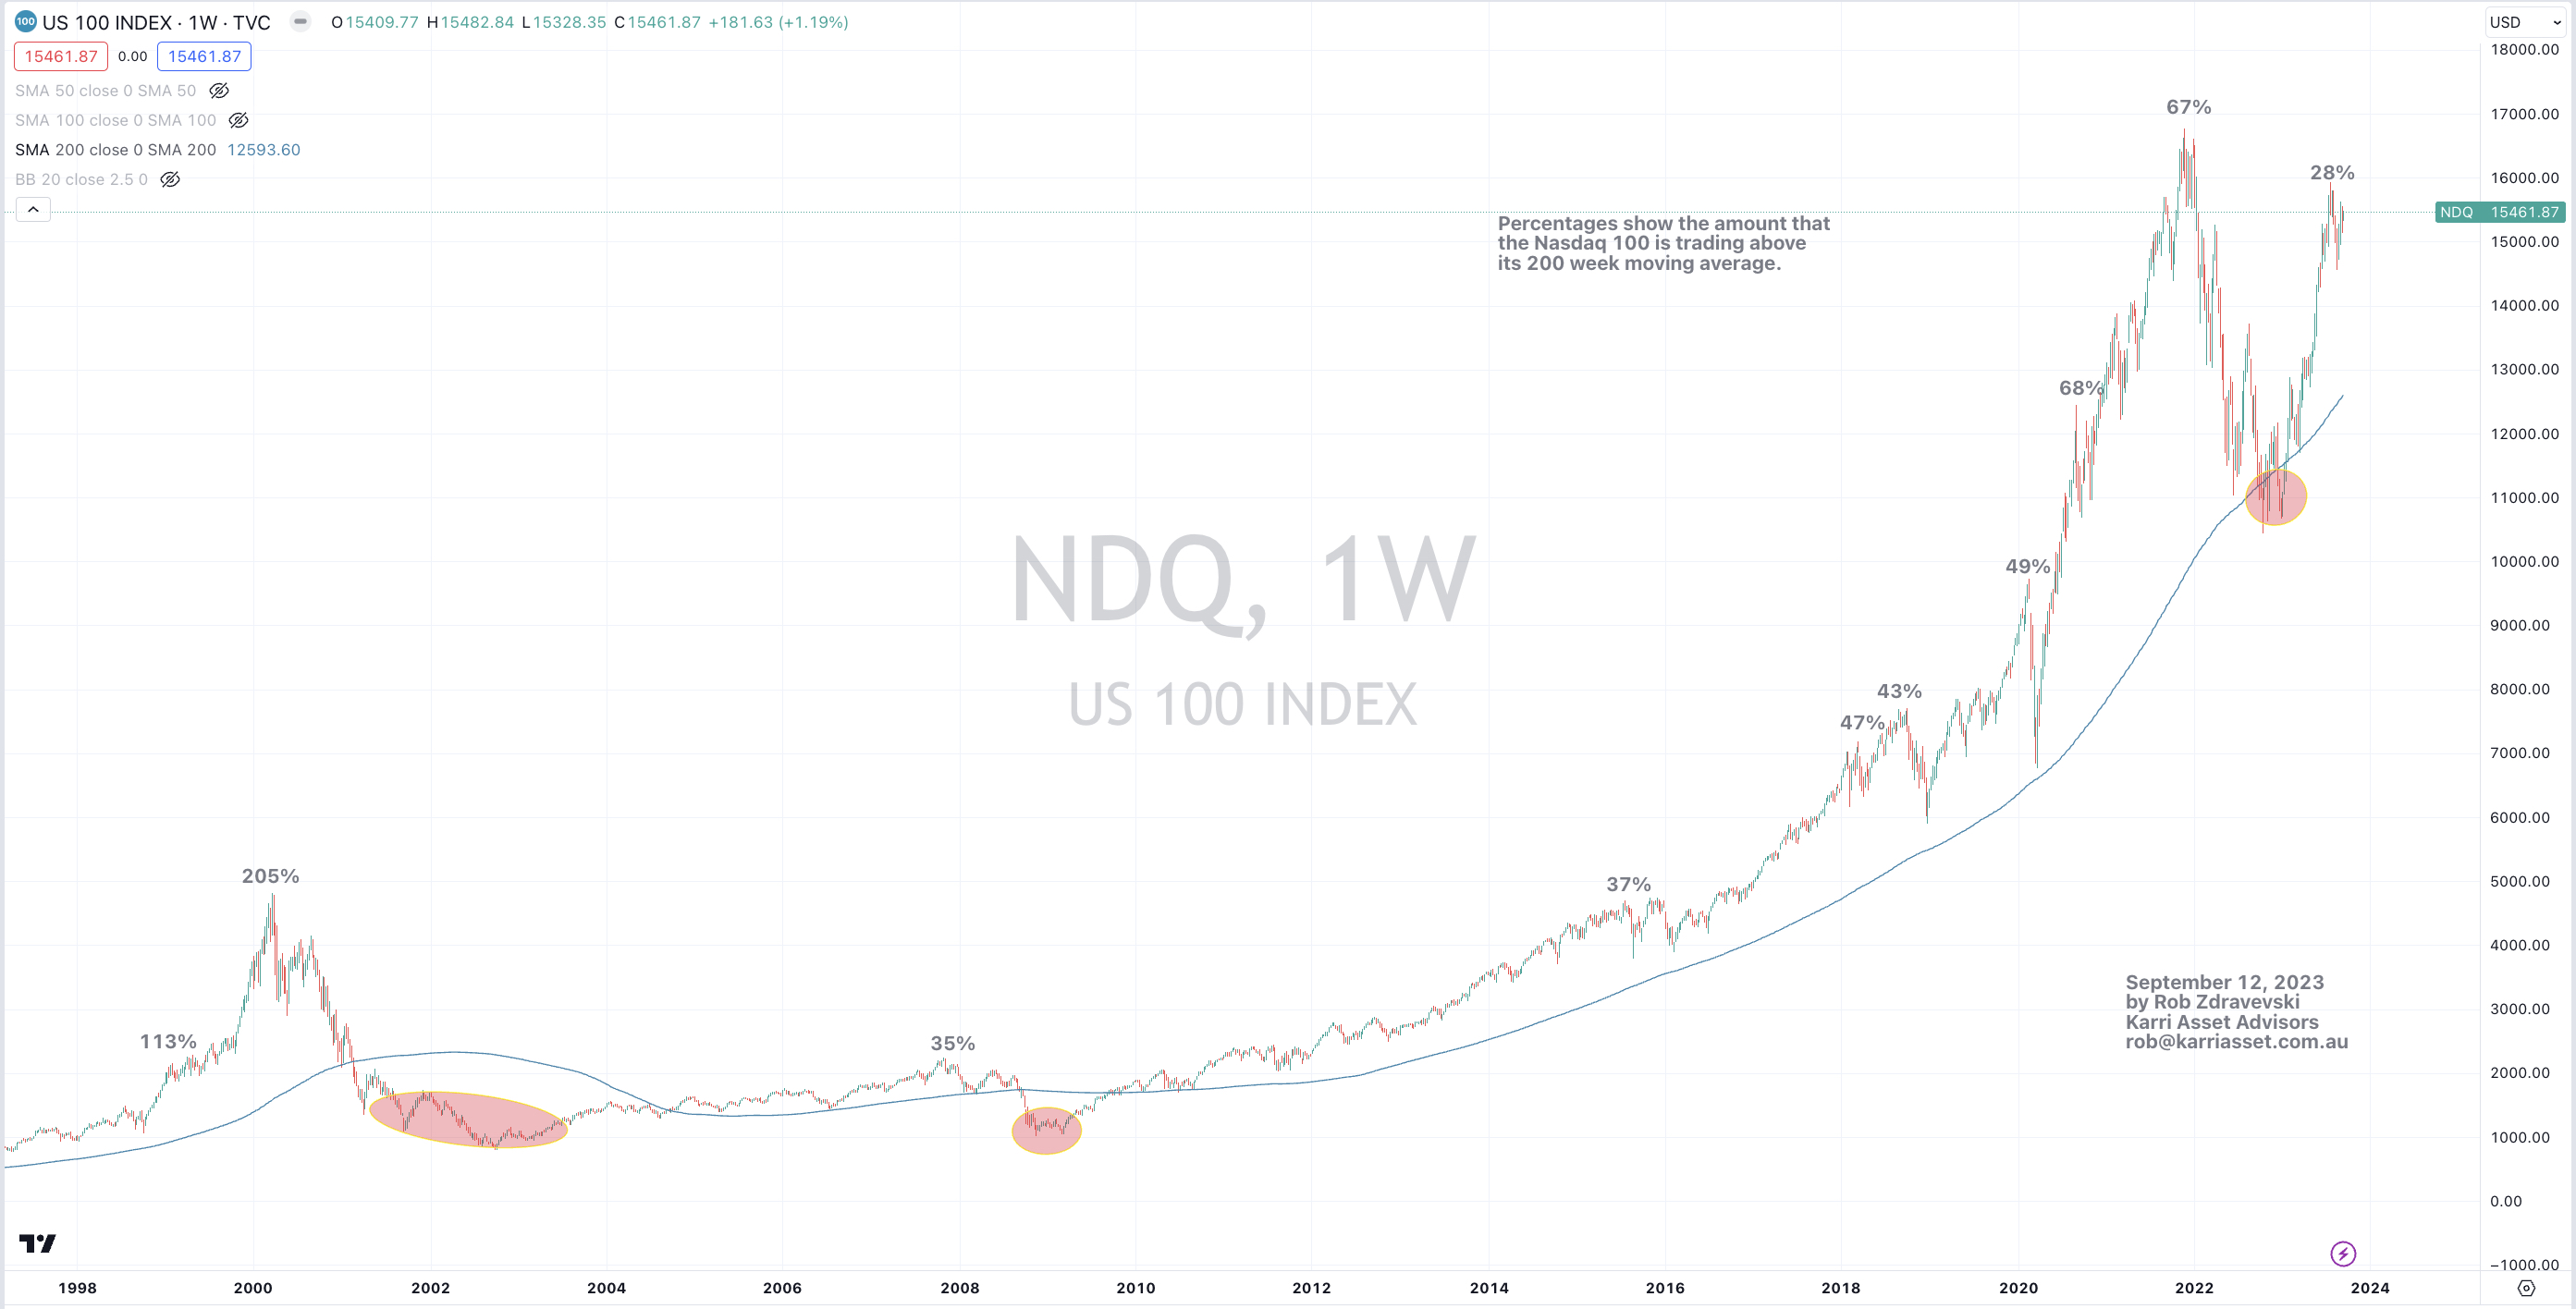
It is also trading at 27% above its 200 week moving average.
(readers of my posts will recognise that pattern).
It is in the midst of a 7 week winning streak.
Also, the Nasdaq 100 is yet to make a new ‘higher high’. That high of 16,765 was seen in November 2021.
Lastly, there are ‘gaps’ below. I’m watching the one at 14,421.
A 12% decline from today’s price would only represent a 38% retracement of this particular advance which commenced in December 2022.
What would be wrong with a 12% for an index which has risen 56% over the past 12 months?
Subjectively, the ‘Magnificent 7’ make up more than 50% of the Nasdaq 100’s market cap and they account for 30% of the S&P 500 market capitalisation.
Many others are welcome to initiate a ‘long position’ at today’s prices on the basis that a ‘break-out’ will provide them with what they are looking for.
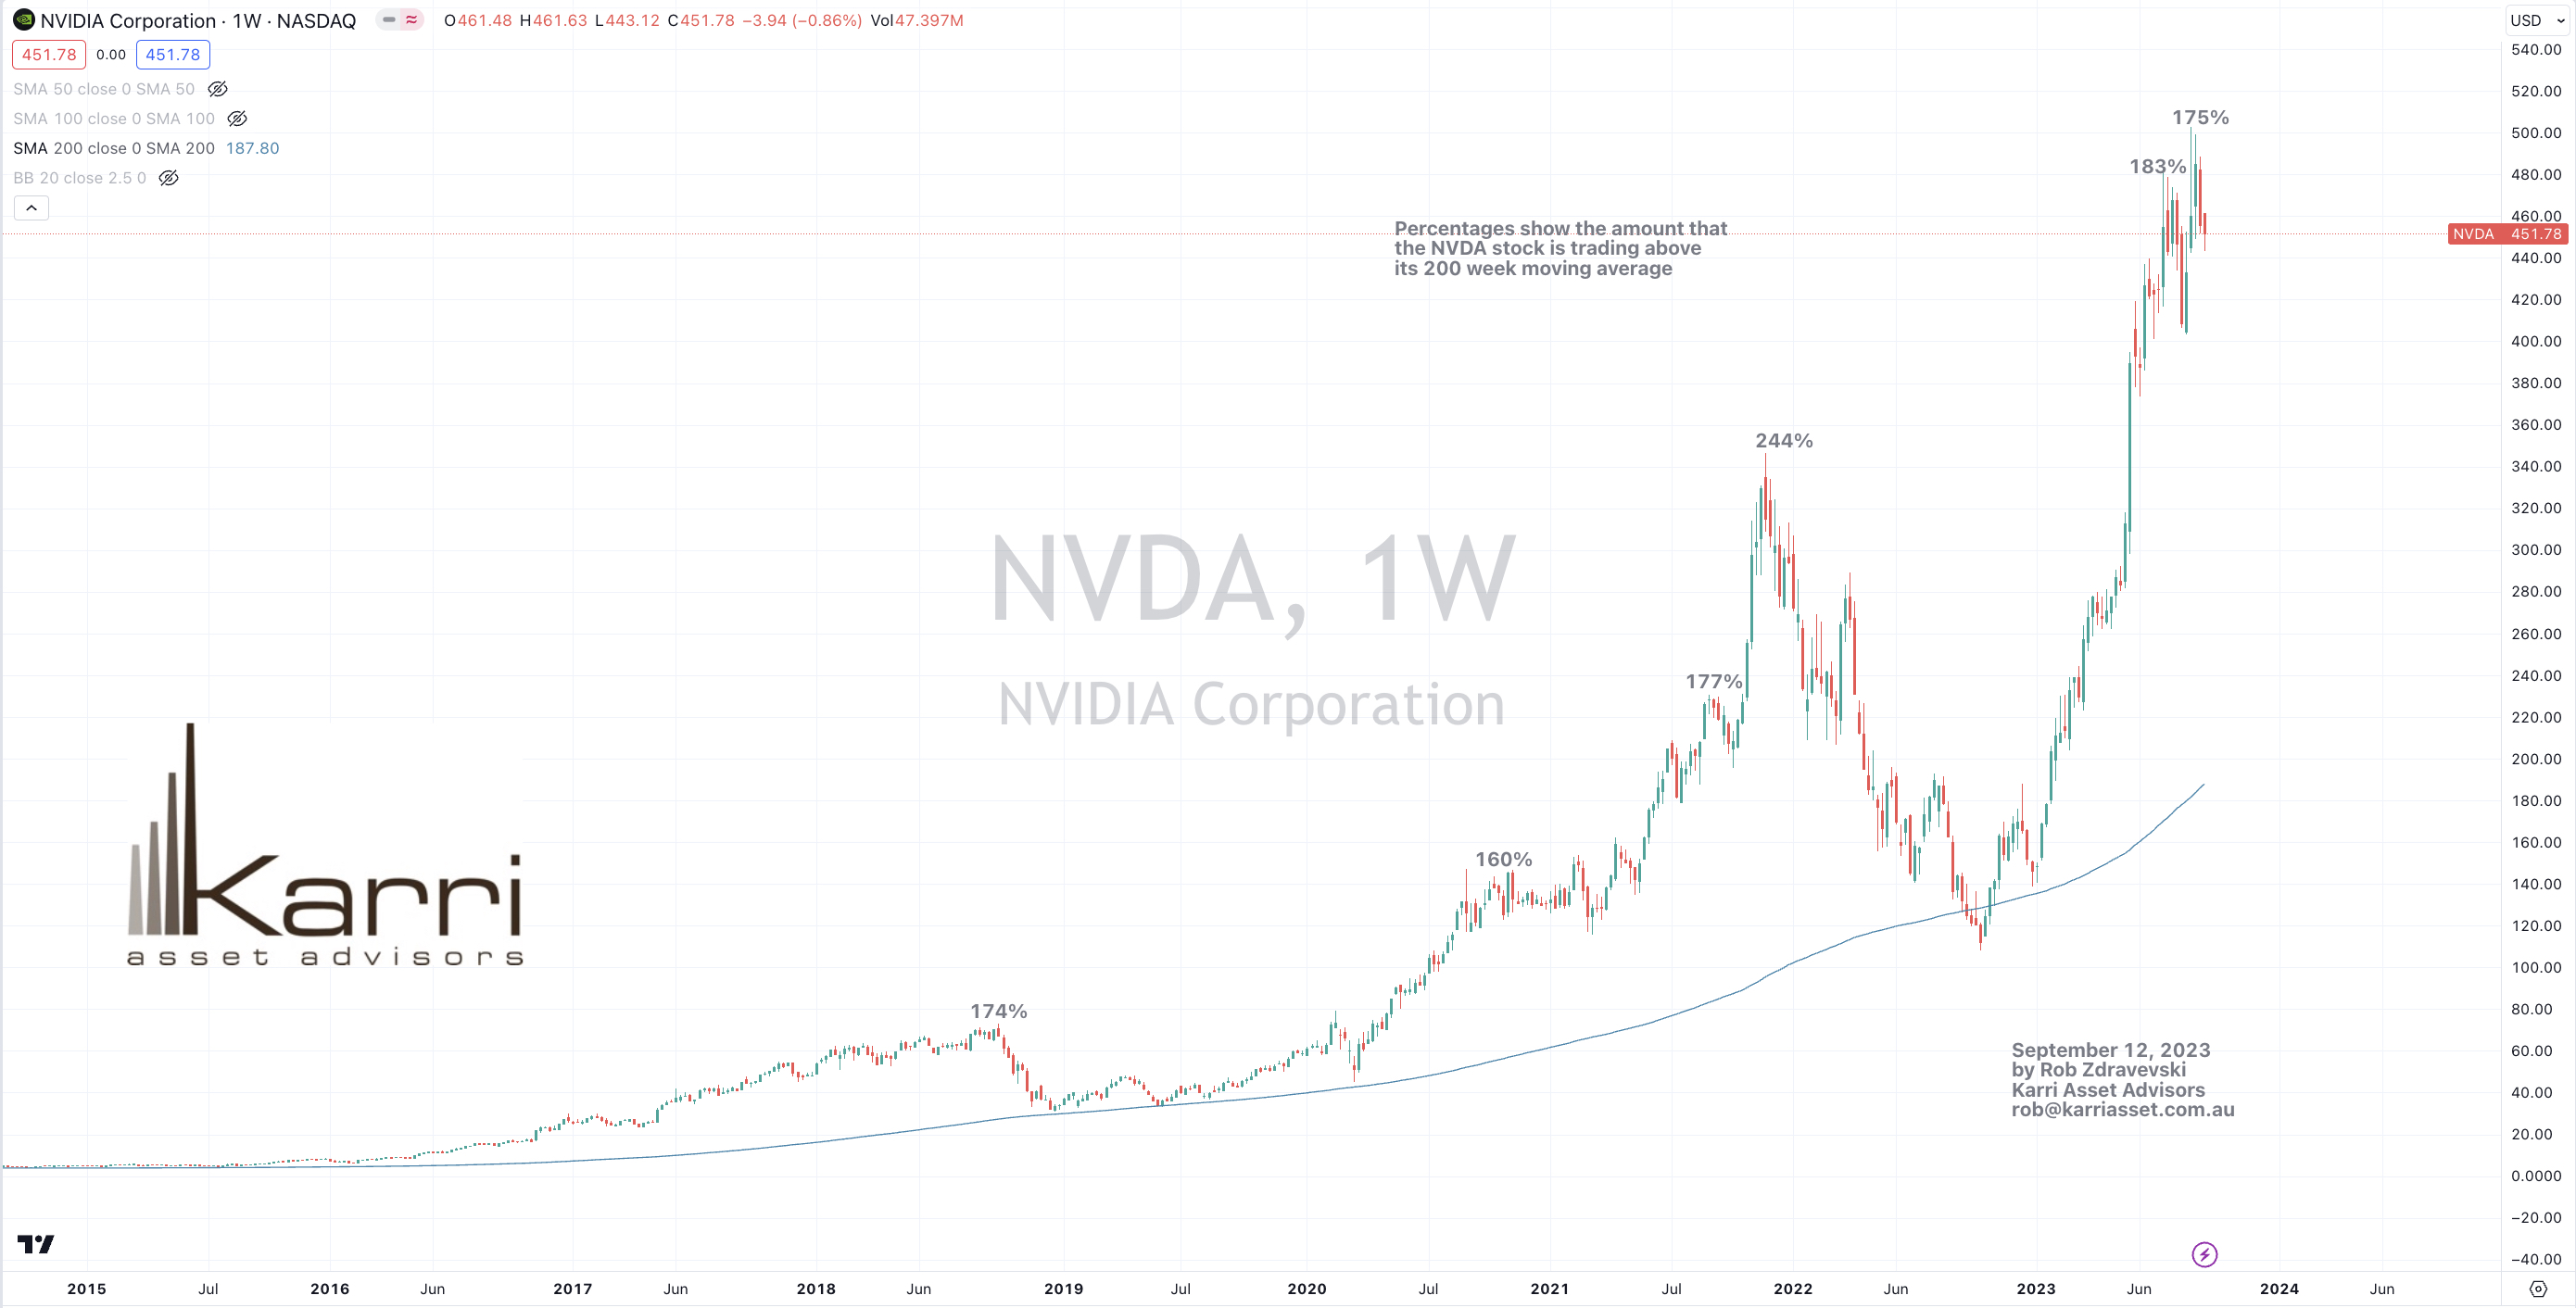
The study below reminds me which atmosphere stocks such as Nvidia (NVDA) are trading within.
It can be useful to those who use words such as “momentum” or “break-outs” as reasons for their investment or speculation decisions.
This study can also be applied to a bunch of the fabled tech darlings.
Keep in mind that mean reversion is a real thing.
What if NVDA’s stock price fell to $240?
While I see demand in certain industries and products, I’m also warning that valuations matter and the world won’t always need a new gadget let alone do we need another subscription software service.
I doubt that productivity, convenience or joy can be increased commensurately.
The second attached study features the Nasdaq 100.