Gold priced in USD remains in a downtrend. It’s currently trading at US$1,721
USD Gold would register a weekly oversold reading somewhere between $1,675 – $1,642, which is approximately a further 3% lower today than the current price.
However, my trend analysis for Gold priced in EUR and AUD shows then developing into a new but early ‘daily’ upward trend.
It is early but work watching, as today, Aussie listed gold producers had a positive trading day. Head fakes do occur and there are gaps to be filled in these stocks, so it remains poised but interesting.
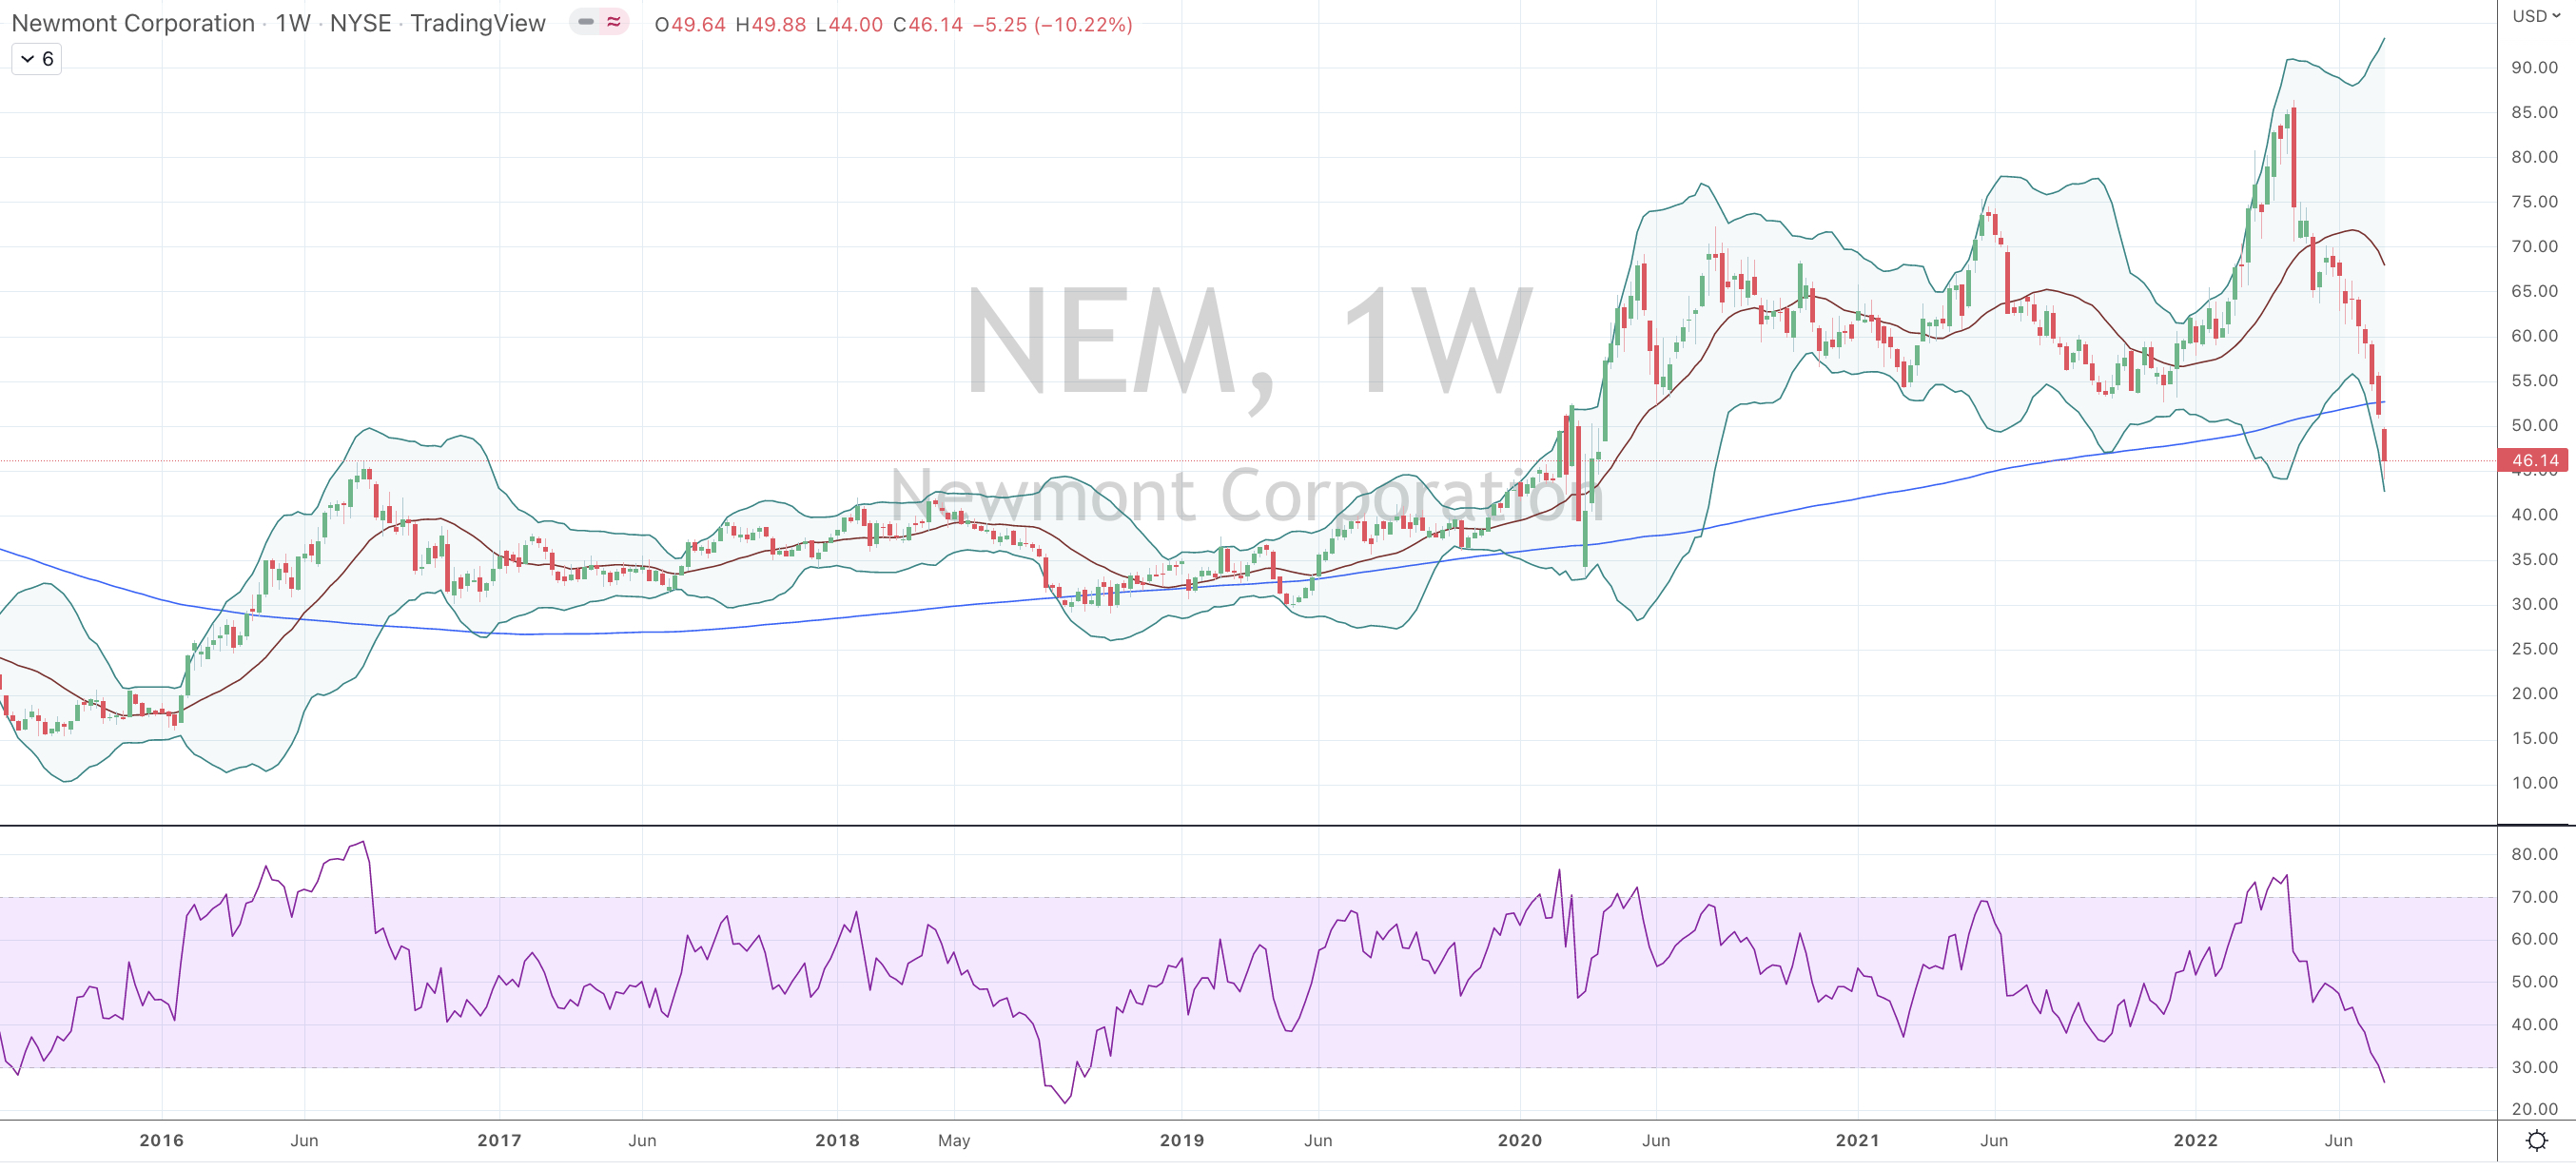
In a continuation of my Alcoa post earlier today, Newmont Mining’s stock price is now dancing at ‘extremes’ not seen for some time.
The first chart below is an illustration of the various times that Newmont’s stock price has traded at high levels of percentage above its 200 weekly moving average.
Other than the shocks of the respective 1981 interest rate hikes and the 1987 stockmarket crash, Newmont Mining’s stock price doesn’t necessarily spend time up in this stratosphere.
My case is not a one-way street.
Note the highlighted ellipse in the chart surrounding 2003 and 2005.
Newmont trades at 101% above its 200 WMA in the last part of 2003, then attempts a mean reversion to then rise back to the same stock price, YET the percentage reading is ‘only’ 57%.
This is because the 200 WMA ‘rolls up’ quickly to catch up with the parabolic move seen through 2003.
The 200 WMA will move higher, while NEM stock price declines.
This is the convergence that I mention in the previous Alcoa post.
So, I’l look for Newmont’s stock to work its way back to the $64-$68 mark in the coming 9-13 months.
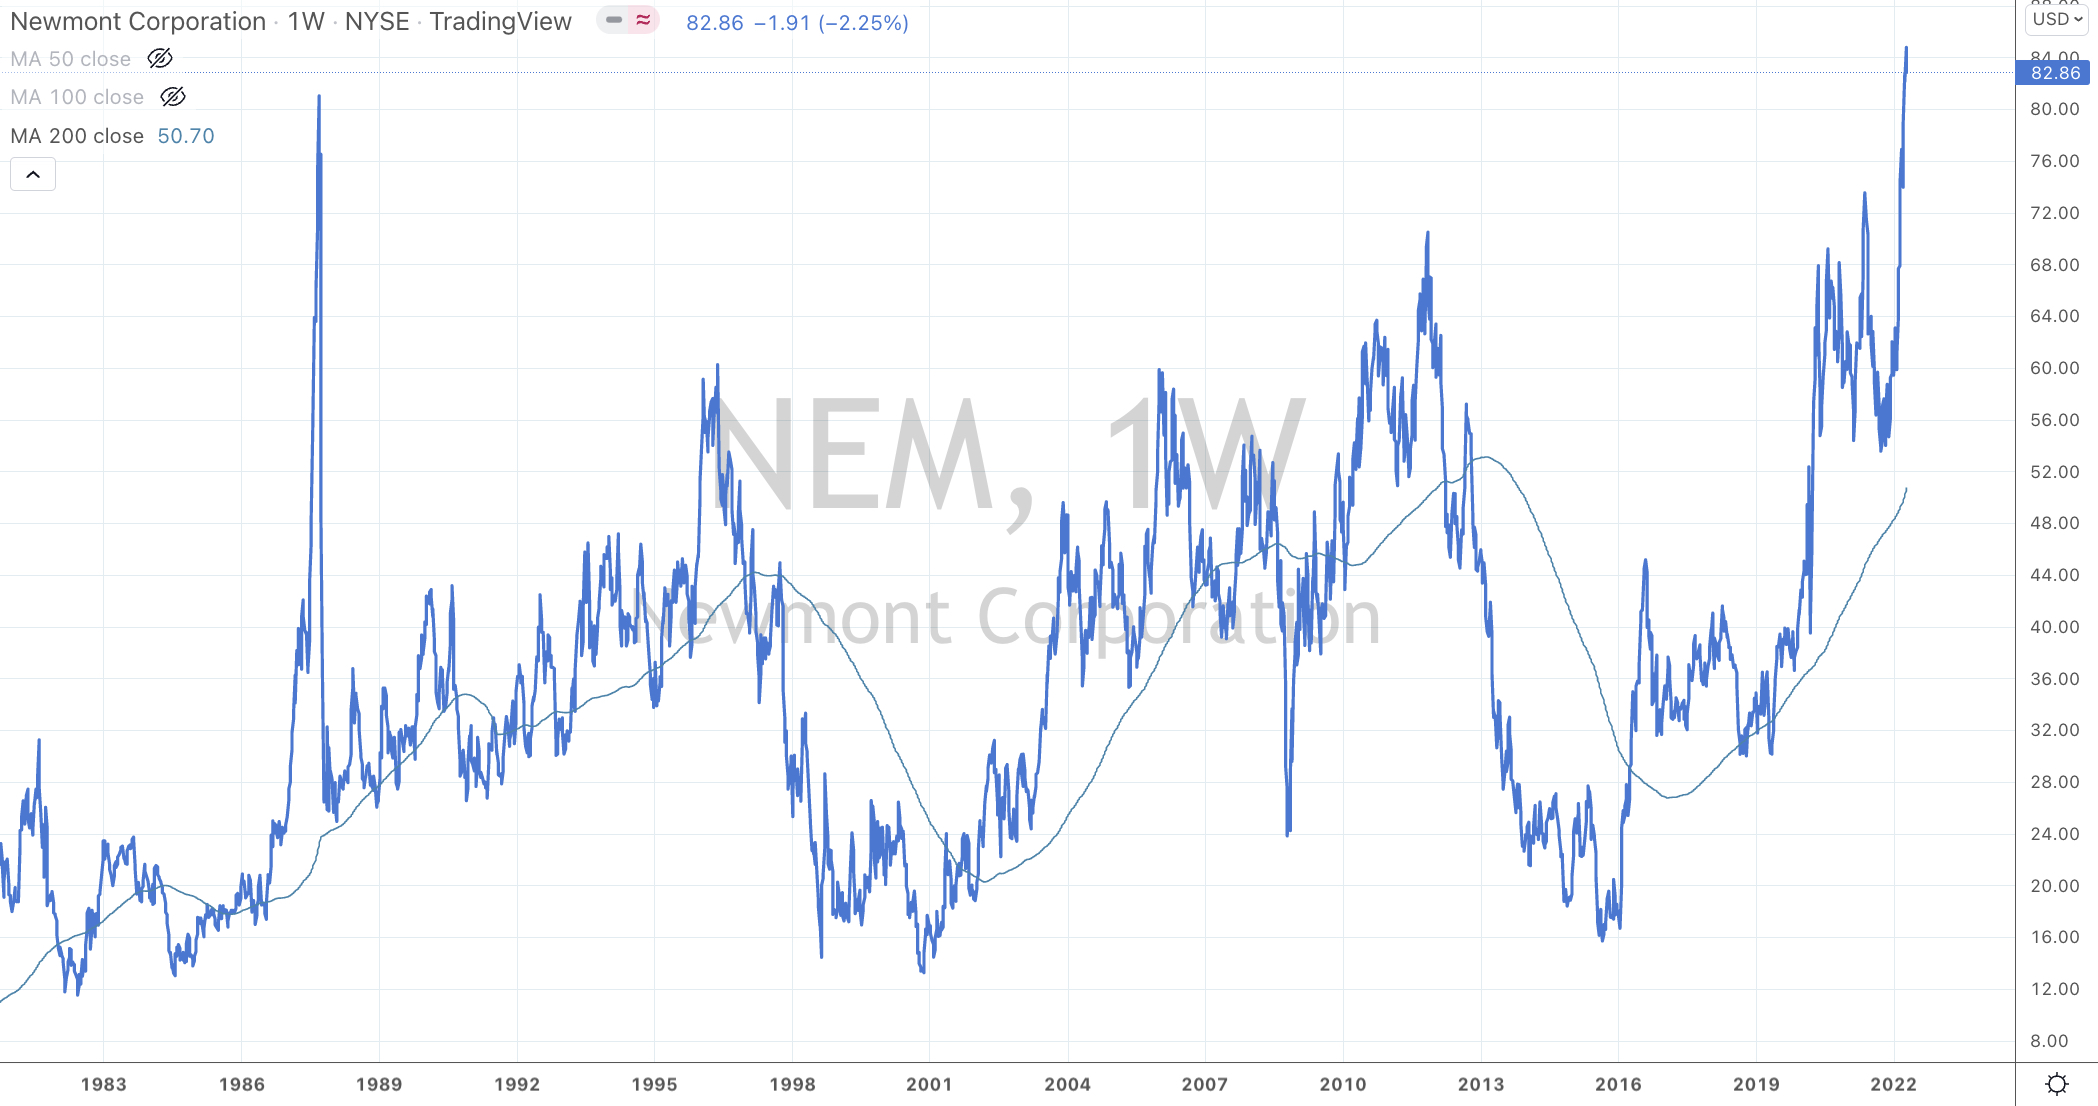
The second chart compares Newmont to the Gold price (in USD).
Similar to Alcoa, it’s plausible that Newmont uses its well priced equity to make some acquisitions or raise some capital itself.
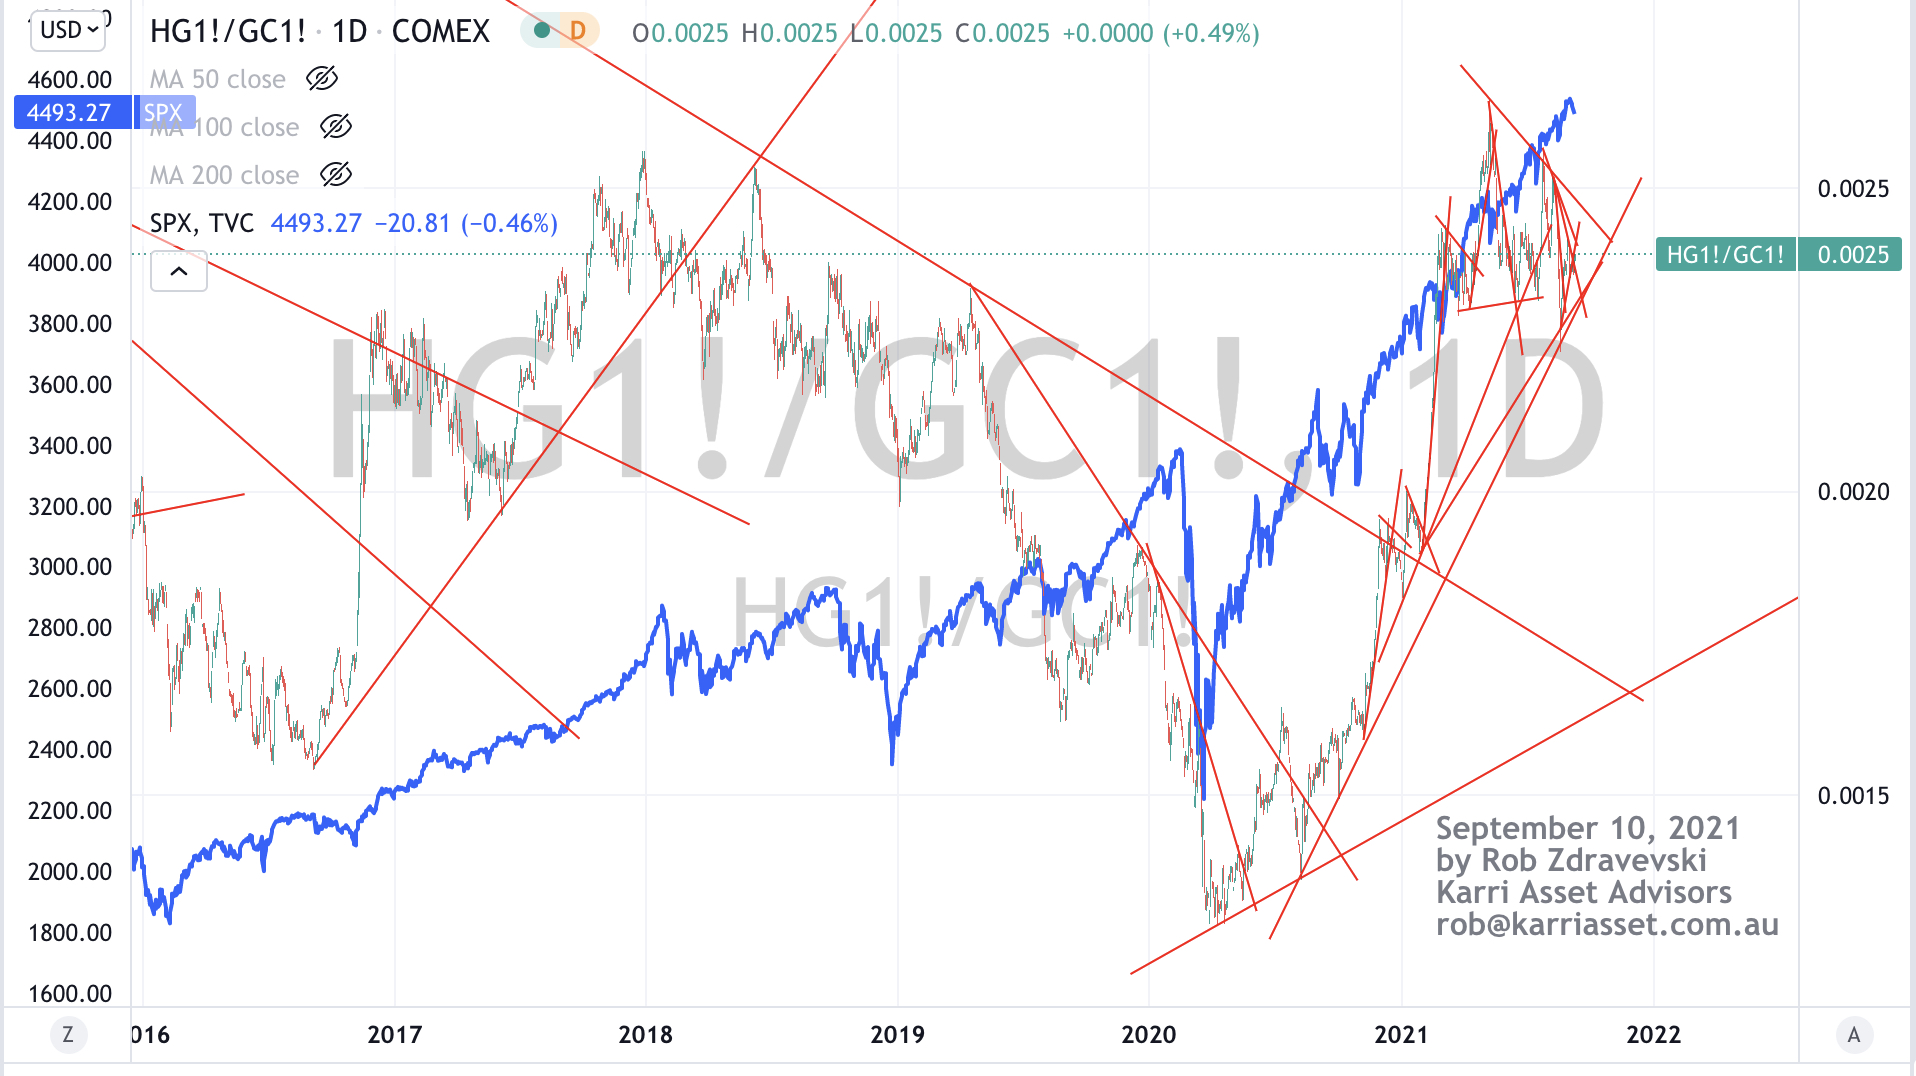
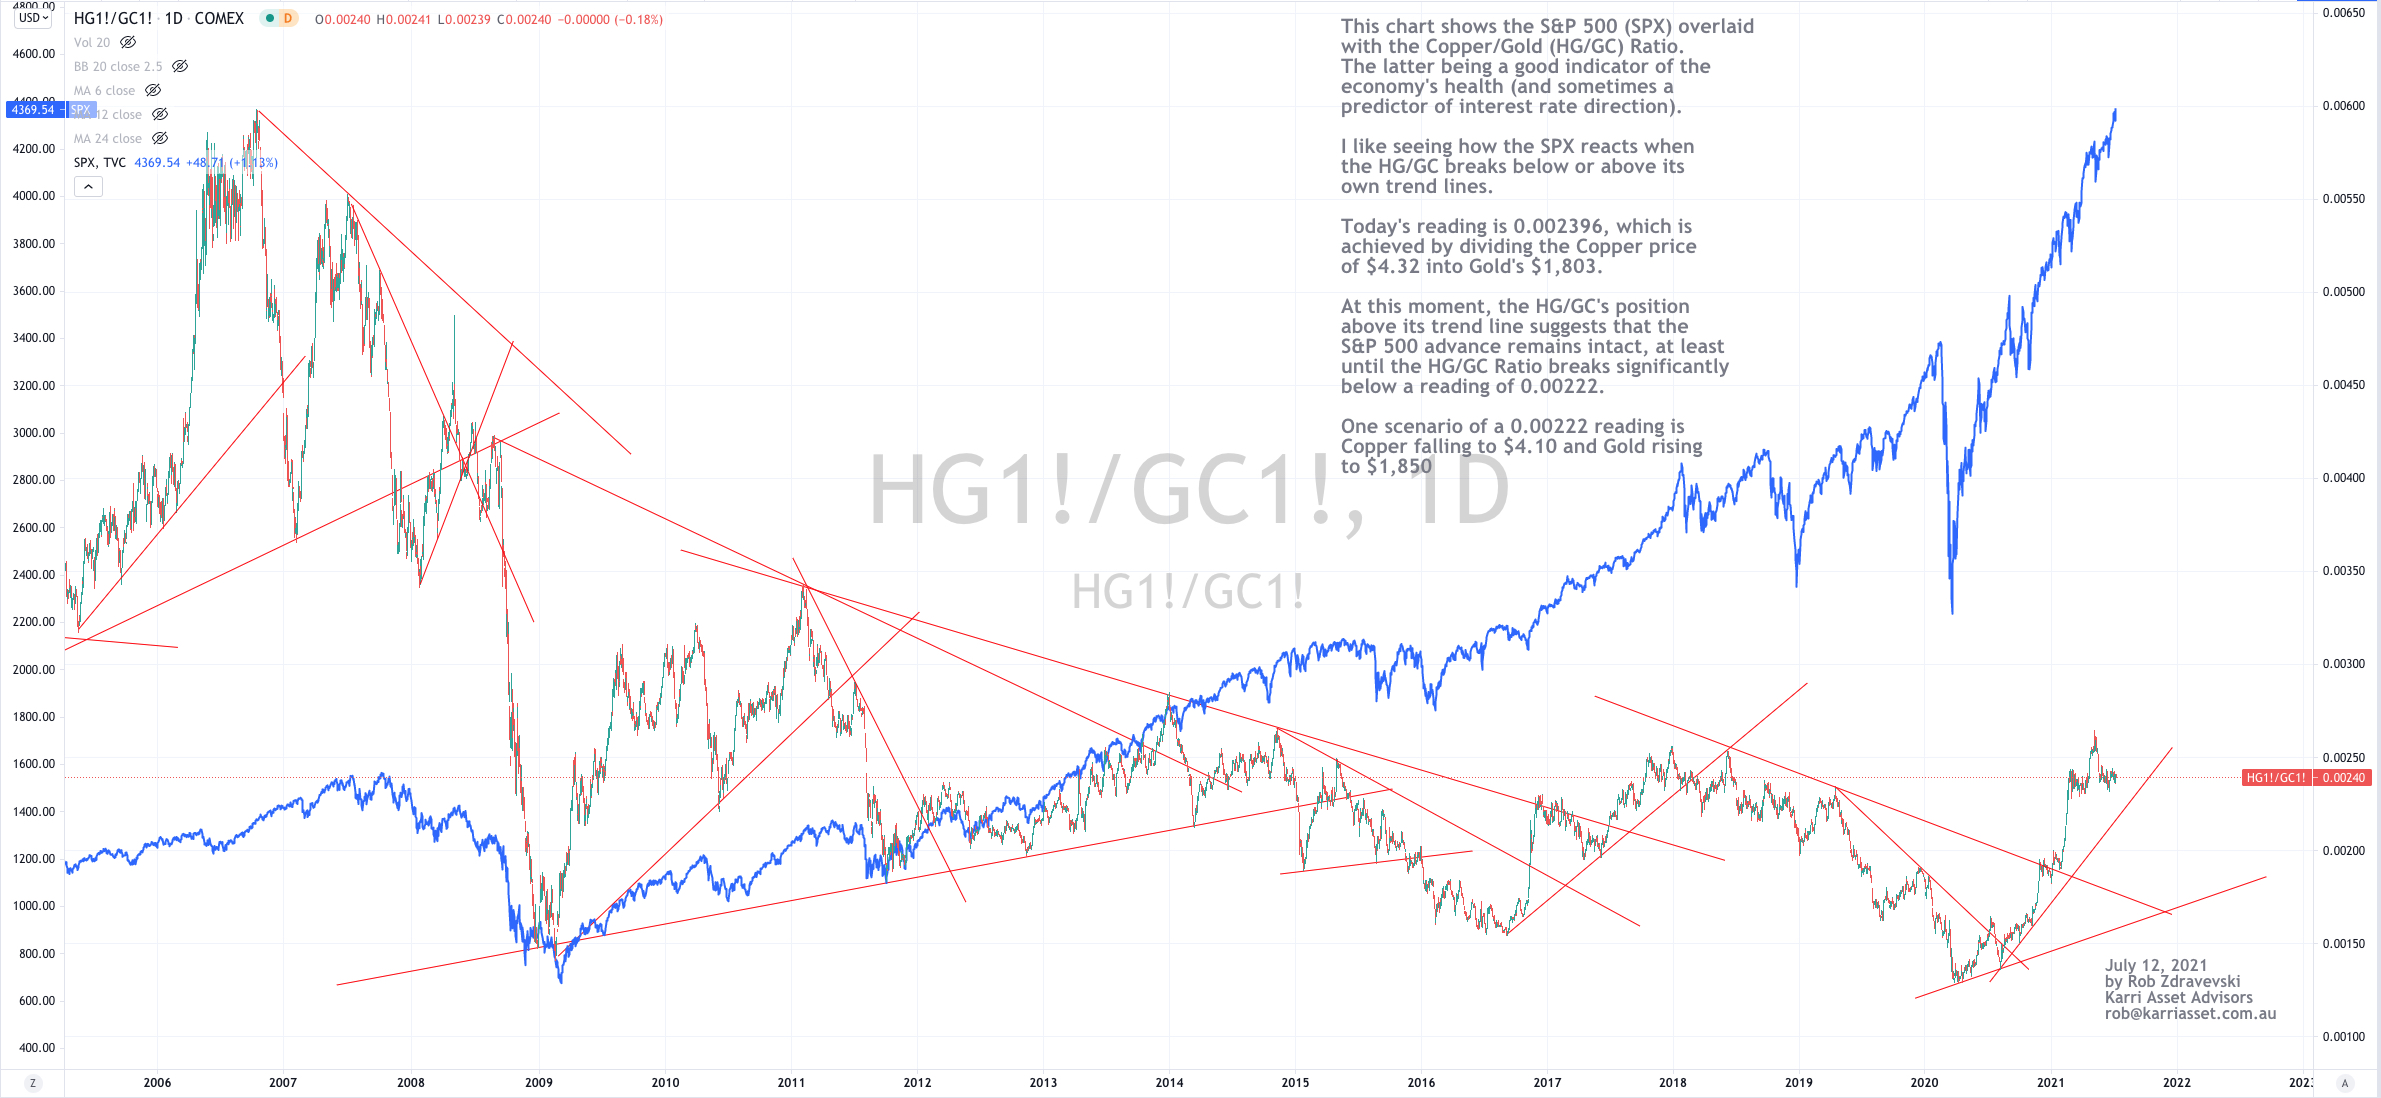
The chart below shows the S&P 500 (SPX) overlaid with the Copper/Gold (HG/GC) Ratio on a daily basis over the past 15 years.
The latter ratio is a good indicator of the economy’s health and sometimes a predictor of interest rate direction.
I find this chart helpful when pondering my asset allocation to equities and how much broader risk I am comfortable taking, especially at the later end of an advance, bull market or rally.
I like seeing how the SPX reacts when the HG/GC breaks above or below its trend lines.
Today’s reading of 0.002396 is calculated by dividing the Copper price of $4.32 into Gold’s $1,803.
At this moment, while the HG/GC’s is trading above its trend line (and a reading of 0.00222) it is suggesting that the S&P 500 advance remains intact……..
This seems quite perverse to many, as pundits reiterate their calls of an overvalued, ‘bubble-esque’ equities market.
In some recent posts I challenge the norm and perhaps the consensus call for a notable decline.
The S&P 500 can continue trading at the historical higher end of its historical stretch above its 200 Week Moving Average, just like the late 1990’s.
and the way the S&P 500 relates to the U.S. 10 year bond yield or more pointedly, the spread between the 10 year and 2 year yield is another important indicator to watch.
Investing is a highly nuanced past time or business.
Often markets move to where they can do the most damage….and going up can cause as much damage as going down, in circumstances such as ‘missing out’ or underperforming other fund managers if you’ve been holding a lot of cash.
P/E ratios are not the only thing to look at.
One scenario of a 0.00222 reading is Copper falling to $4.10 and Gold rising to $1,850. Just something to play around with.
The watching the direction (not necessarily its value) of the Copper/Gold Ratio helps me reading the health of the economy.
And it has been healthy….
It’s particularly correlated with the direction of the U.S. Government 10 Year Bond Yield. More on that in the next post.
The chart below shows us the 6 moments when the Copper/Gold Ratio has registered an Overbought reading over the past 20 years.
Such occurrences correlate to and increase the probability of lower prices in the S&P 500 Index or at the very least see it trade sideways for the coming months. This also coincides with my thesis in my recent newsletter.
What this chart tells you is that probability does not suggest ‘going long’ or making any meaningful capital deployment into equities at this juncture.
A bet that the Internal Combustion Engine still has 30 years of life
The Discount:
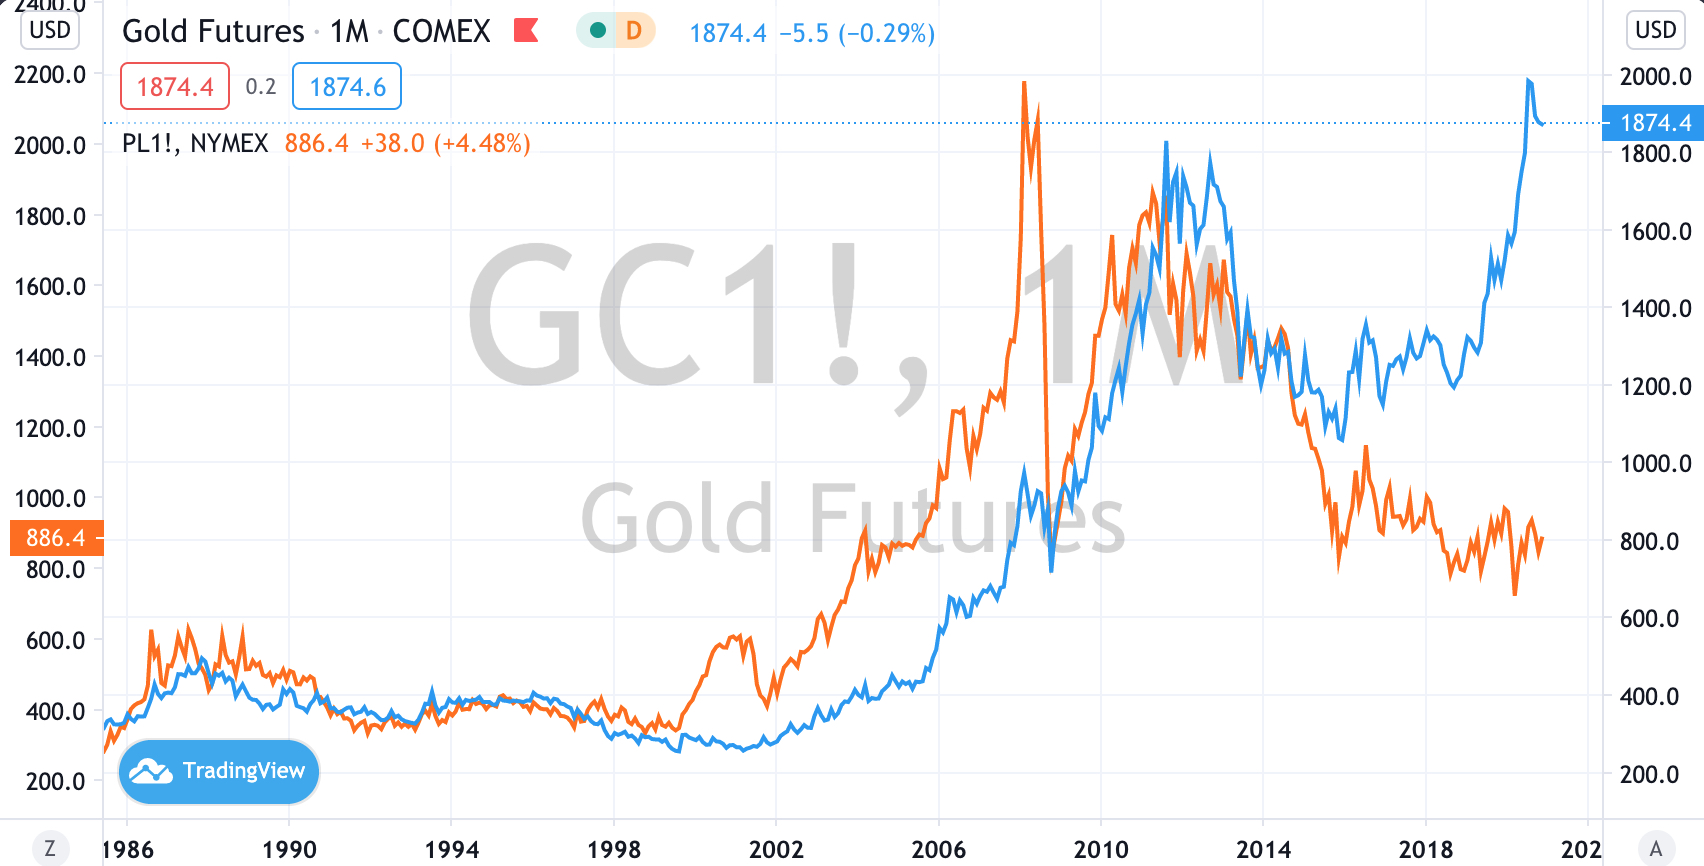
Colloquially, Platinum is considered more precious than Gold.
When it comes to pricing, Platinum has traded at either par or $200-$300 an ounce higher than the price of Gold.
In early 2015, Platinum started to consistently trade at a discount to the price of Gold.
Today, Platinum is trading at $1,000 below the price of Gold.
We haven’t seen such a percentage discount spread in 35 years.
Subjectively, there is a euphoria behind Gold’s prospects while Platinum is seemingly unloved which seems to have widened the discount.
Platinum (in orange) compared to Gold (blue line)
Production & Supply:
At least 70% of the world’s Platinum production is sourced from South Africa’s Bushveld region.
This allows us to easily monitor supply disruptions, labour disputes and political machinations.
COVID-19 has also seen the South African Government restrict mine production to a capacity of 50% and in turn, mining companies have elected to place various mines in ‘care and maintenance’.
Coupled with a latency in re-starting production, there is a distortion in price and supply upon us.
Industrial Use & a substitute for Palladium:
On the demand front, Platinum is used in ……..
jewellery, dental fillings, medical/laboratory instruments, turbine blades, computer hard disks, in the chemical industry (nitric acid, benzene, silicone), as compounds in chemotherapy drugs, as a catalyst making fuel cells more efficient and in motor vehicle engine catalytic converters.
Catalytic converters (in cars, trucks and buses) account for 50% of its utility.
On the topic of automobile catalytic converters, Palladium has been the preferred metal amongst manufacturers and rightfully so due to its lower price.
On an industrial basis, being Long Platinum is to take a view that the proliferation of vehicle electrification will take longer than suggested.
This is certainly a contrarian view.
Although, it has been noted that whenever Palladium trades at twice the price of Platinum, manufacturers opt for the cheaper Platinum substitute.
Today, Palladium is trading at $2,457 is trading nearly 3 times Platinum’s current price of $887.
The price of Platinum appears in orange, while Palladium is in blue.
Mean Reversion
Gold is currently trading at 64% above its 200 day moving average (on a monthly basis) while Platinum is 27% below its monthly 200 DMA. It is plausible to expect a convergence and mean reversion in both assets.
When pondering how this gap will narrow, a rising Platinum price seems more probable than a collapse in the Gold price in the current asset and ‘expected’ price inflation environment.
Correlation to CME Futures Contract Margins:
The case for an interim peak (for Gold) also lies in my historical analysis of futures contract margin requirements tend to coincide with an extreme in the price of Gold.
Platinum’s futures margin requirements are not reaching any historical peaks. In fact, I think there is growing probability that Platinum margins are decreased soon.
The Internal Combustion Engine (ICE)
It’s unlikely that automobile manufacturers will walk away from the capital expenditure spent on engine development and assembly, while synthetic fuels are making ICE’s even more cleaner.
Commensurate to introducing electric vehicles into their stable, auto companies have also made statements that they still expect the ICE to be part of their business for the next 30 years.
Incumbent industry and job protectionism is another topic that won’t dissipate anytime soon.
Electric Vehicles (EV)
While their purchase is subsidised in many jurisdictions, EV’s remain expensive and have yet to reach a pricing equilibrium making them affordable and a mass viable financial alternative to owning an ICE vehicle.
The EV charging network isn’t widespread and will require notable investment while facing a formidable fuel retailing industry. Range anxiety and the speed of re-charging also remains a challenge.
Hence, EV’s account for 2.5% of global car sales and 1% of the global car ‘population’.
Bloomberg New Energy Finance predicts that electric vehicles (EVs) will hit 10% of global passenger vehicle sales in 2025, with that number rising to 28% in 2030 and 58% in 2040.
I’m not hanging onto the past and while EV market penetration should grow; we are still making cars, trucks and buses with ICE’s.
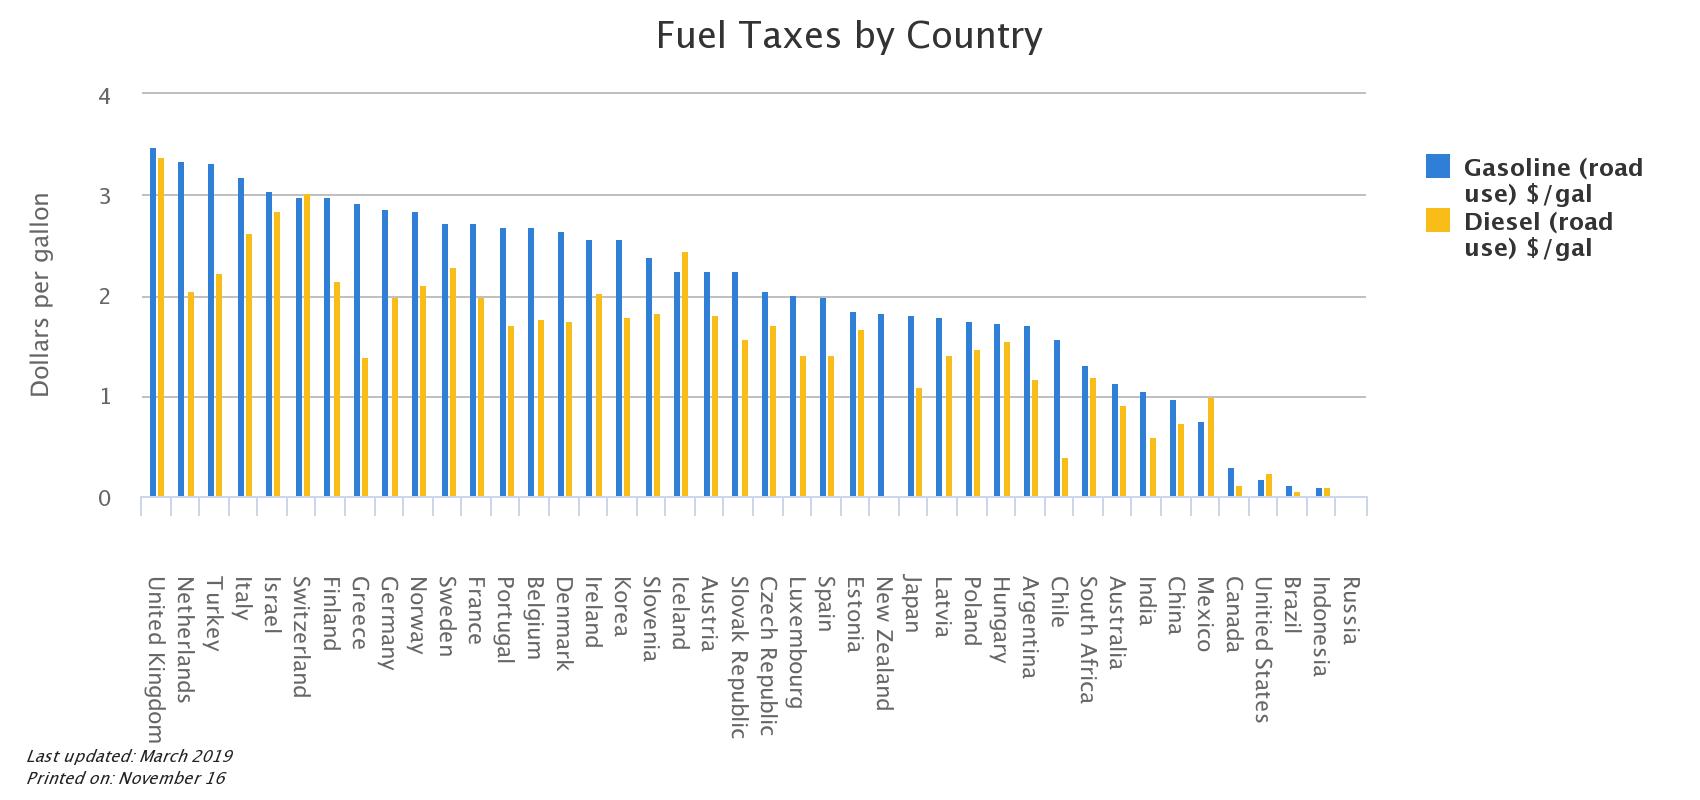
Government & Tax
Government love things which they know how to tax; items such as tobacco, alcohol and fuel.
The fuel excise tax is a hefty component of many government revenues and the funds raised assist with maintaining not only roads & bridges, but also hospitals and schools.
EV’s are currently not providing a comparable revenue replacement for potential lost petroleum taxes.
Another challenge for governments is figuring out how to tax the electricity trickle from your residential power outlet, the solar panels located on your roof or from a public charging station.
We are now seeing governments announces “road usage taxes” for EV’s.
Today, Northern Star Resources (NST.ASX) announced its wish to takeover Saracen Minerals (SAR.ASX).
Why don’t they call it a takeover rather than a merger?
Well, mainly because its “friendly”, hence using a “scheme of arrangement” encourages civil co-operation and it increases the likelihood of the deal completing but it does remove any possible price tension.
Anyway, putting spin to one side,
No premium was paid over the previous day’s closing price and Saracen’s board is recommending the acceptance of “nil premium bid”.
Yesterday, NST closed at $13.82. It is paying 0.3763 of its shares for 1 SAR share. This equals $5.20 per SAR share. Saracen’s closing price yesterday was $5.22.
This resembles past comments I have made suggesting that we can expect more ‘take-unders’ in terms of M&A prices paid.
Although this friendly and perhaps submissive path makes me wonder if Saracen think the business was/is fully valued?
Today’s price action in the rest of the sector is flat. In other words, ASX listed gold stocks are not being dragged higher with any M&A exuberance.
Perhaps last weeks note (link below) may add a little more ‘colour’ to the ASX gold market.