Copper miner, Sandfire – then there is a time to sell

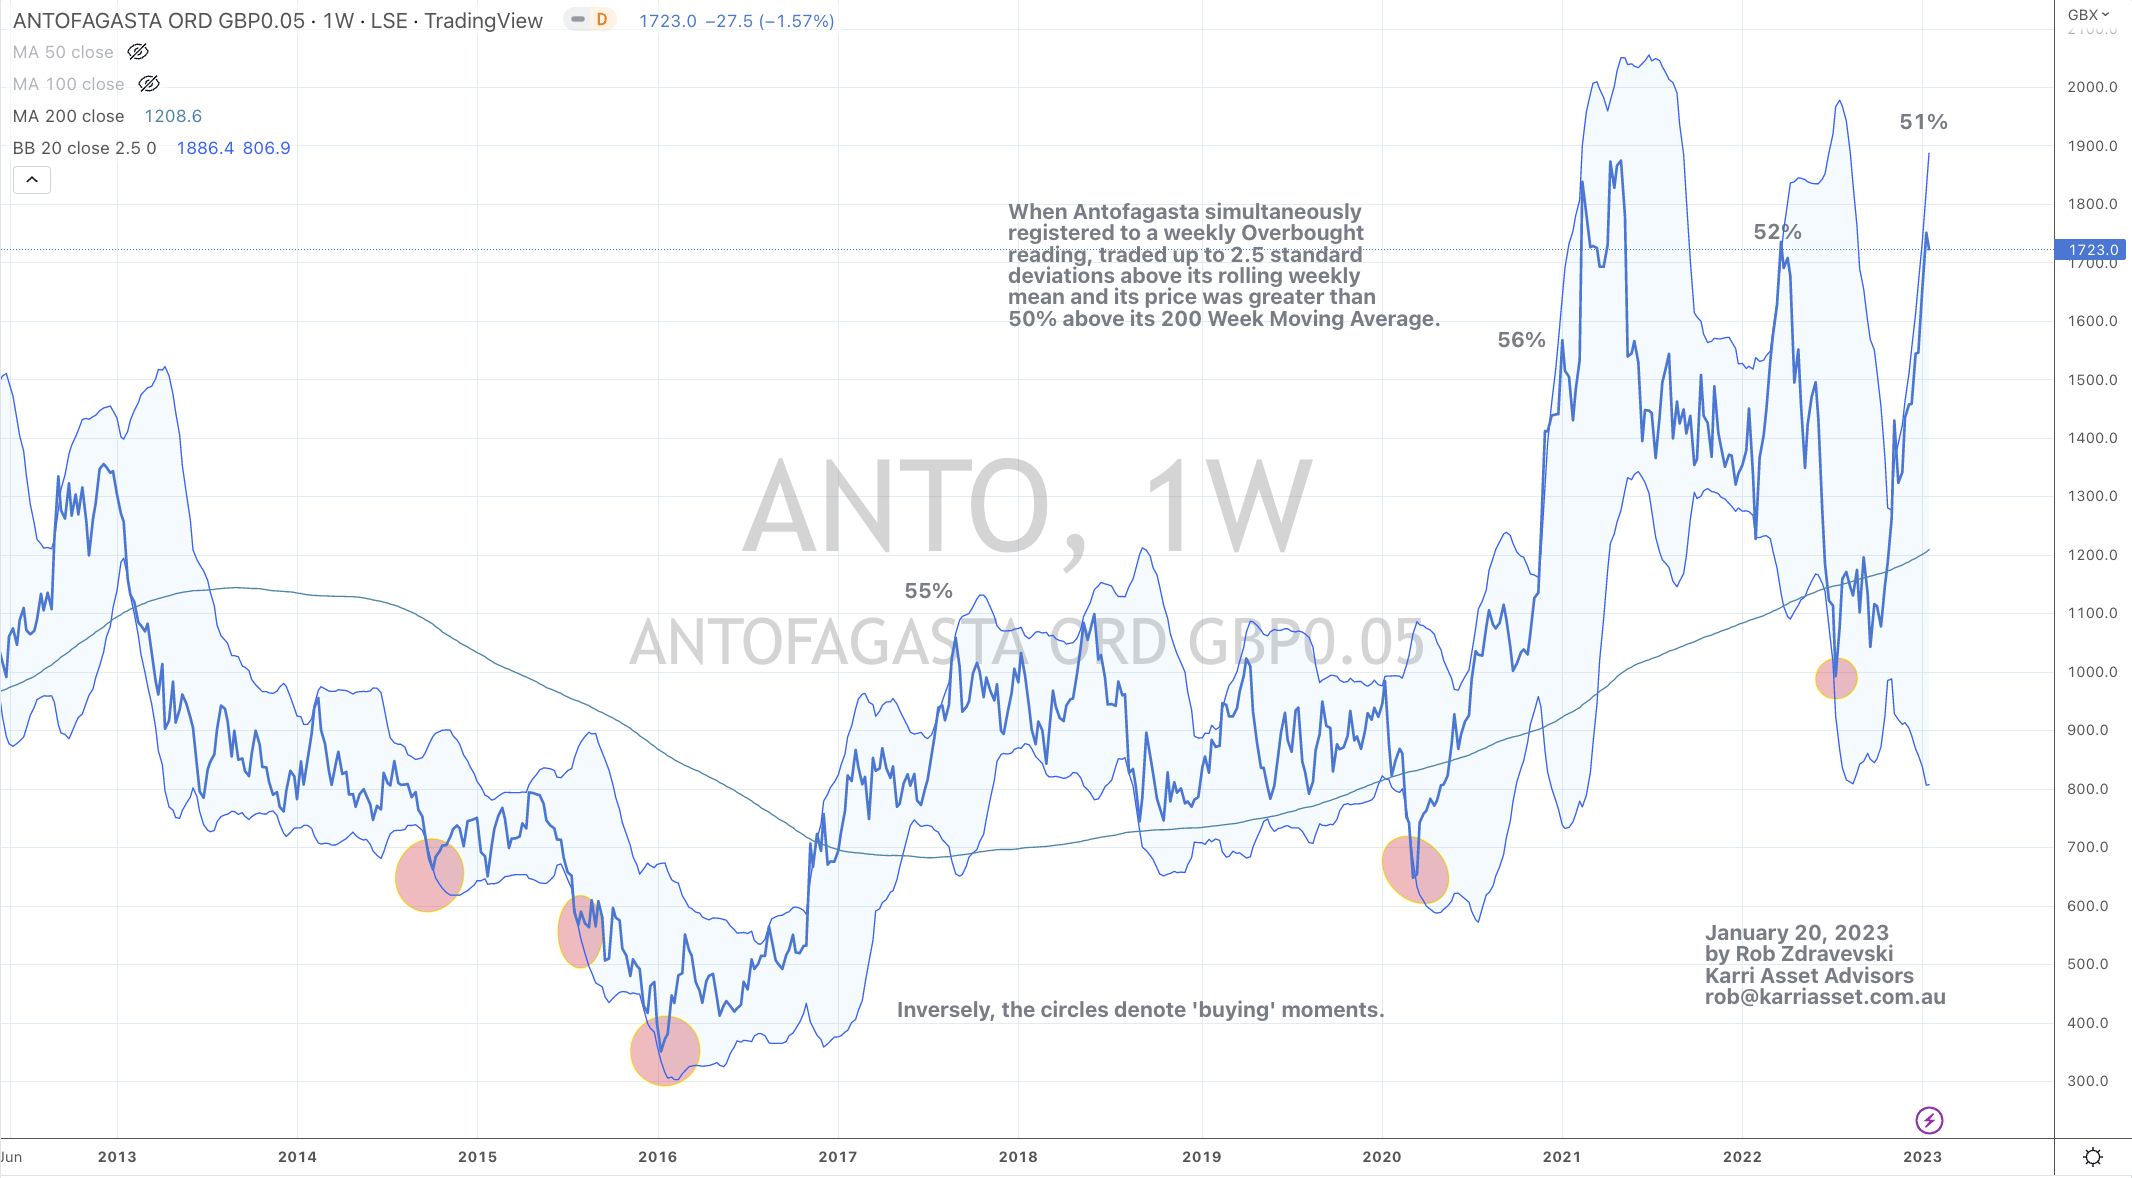
Today, with it’s stock price trading at $7.04, Australian copper mining company, Sandfire Resources (SFR.AX) is approaching a moment where probability tells me to sell its shares soon. *

The chart below shows 3 notable (recent) moments when Sandfire Resources stock price was trading at the upper end of various extreme measures. It is also at stretched percentages above its 200 week moving average.

In July 2022 (9 months ago), I posted a note which observed the ‘extreme’ low in its share price. The stock was trading around the A$3.80 mark then.

That original July 2022 quip was preceded this next post……

…..which mentioned the first bid BHP made for Oz Minerals and showed other stocks that created the same buy signal during that month of July 2022.

For as long as the business isn’t broken and the theme remains intact, it takes some fortitude to accumulate equity when all around you seems dire.

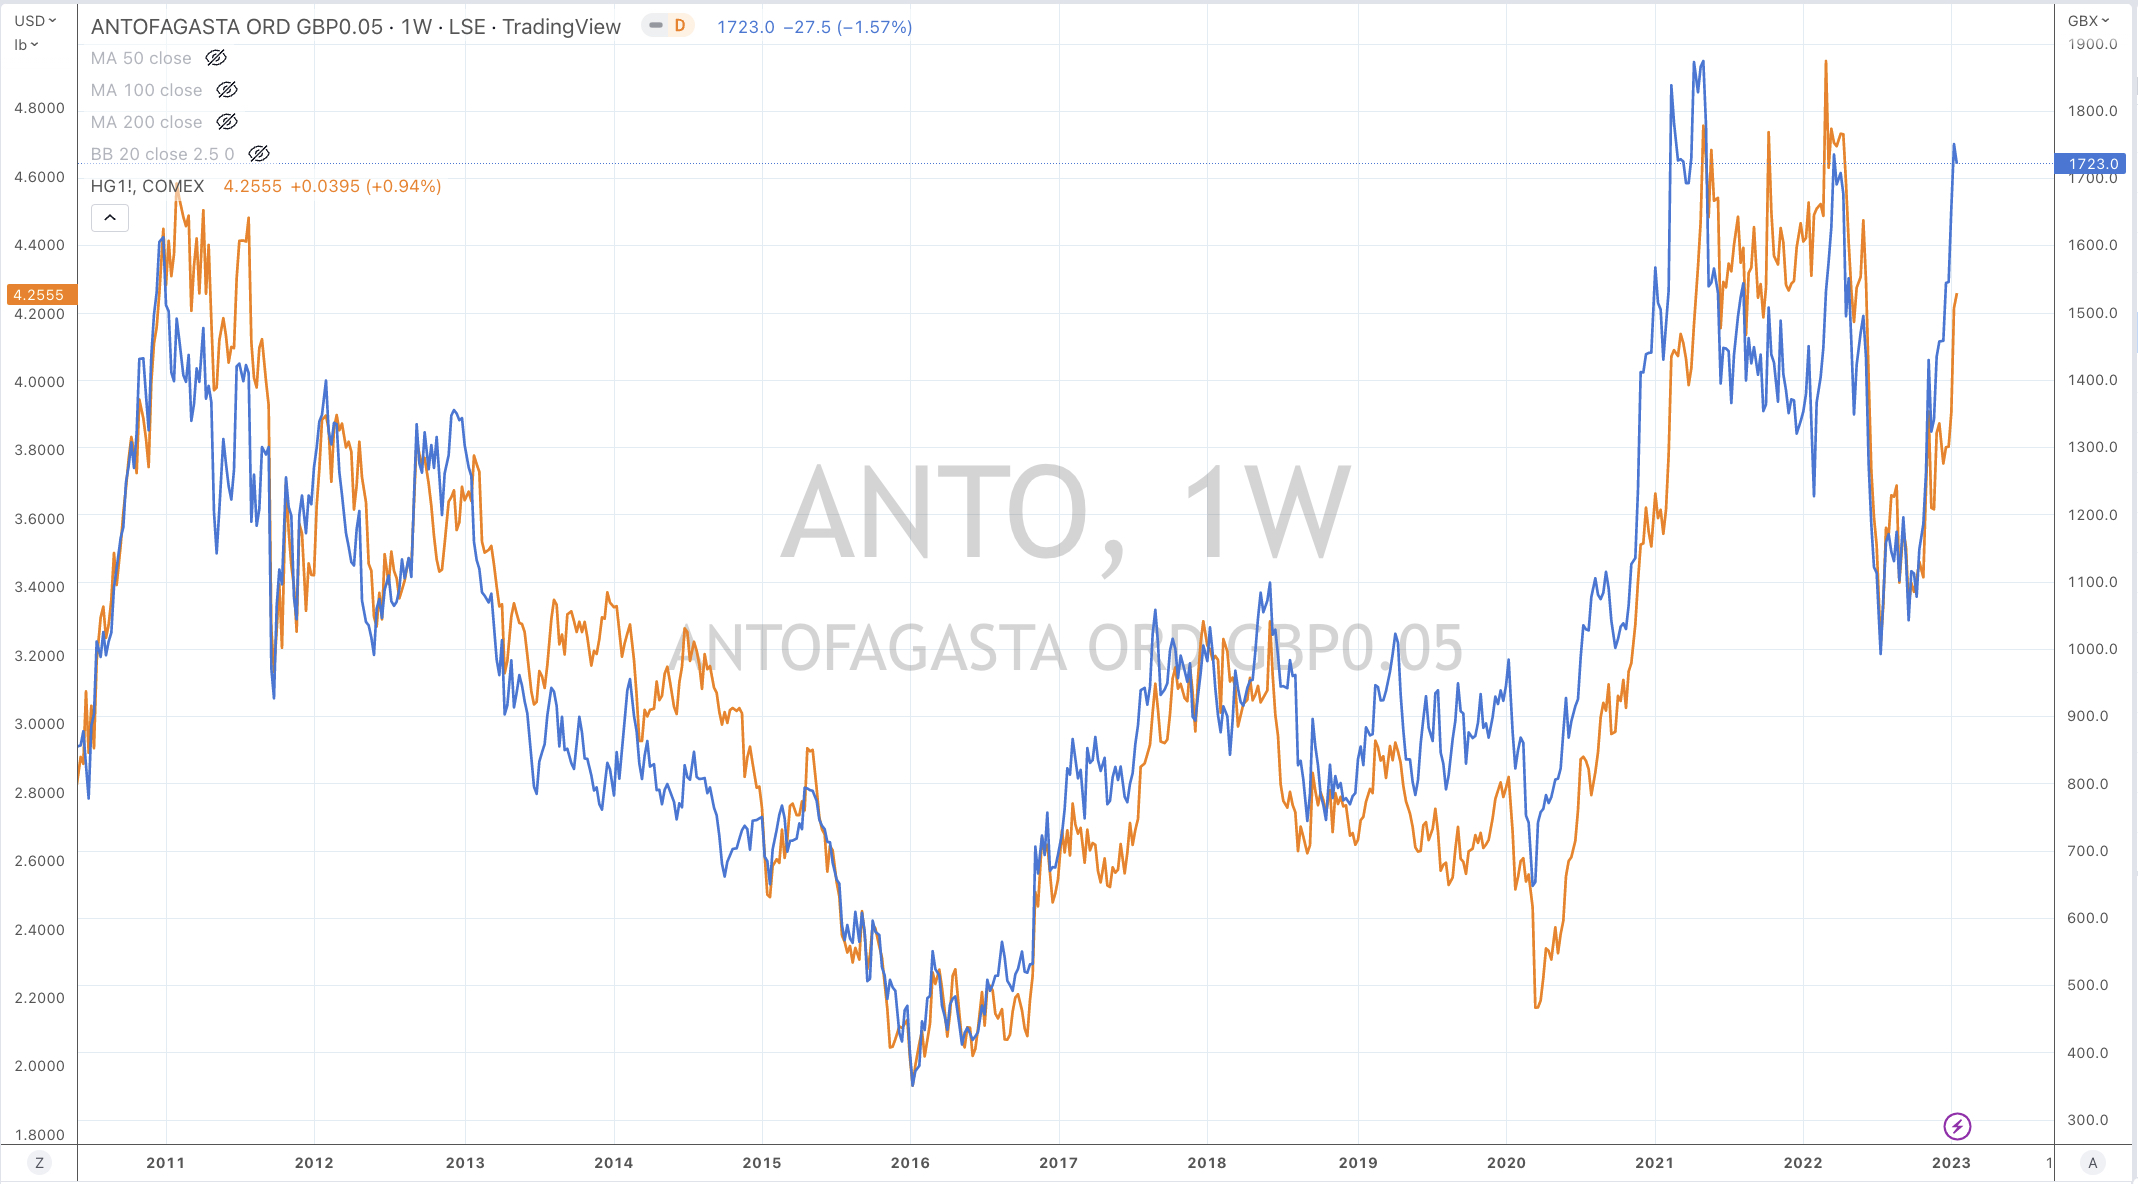
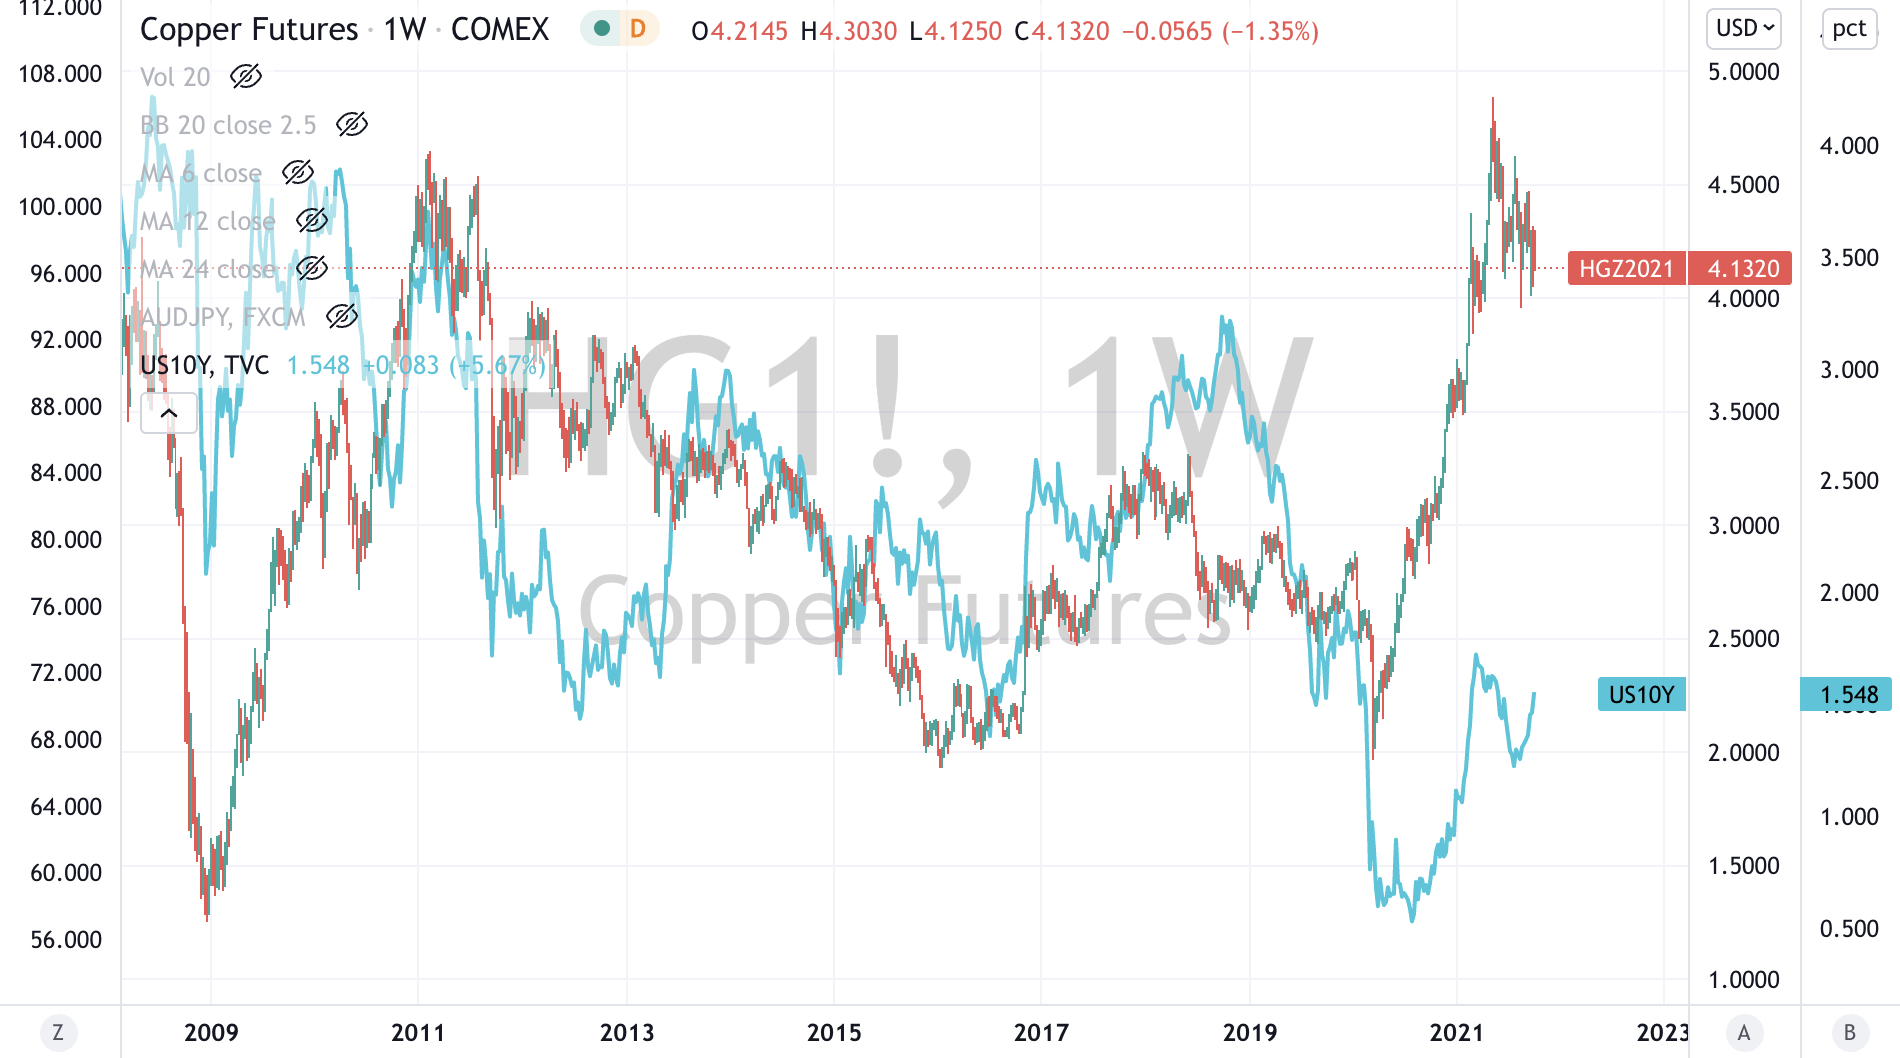
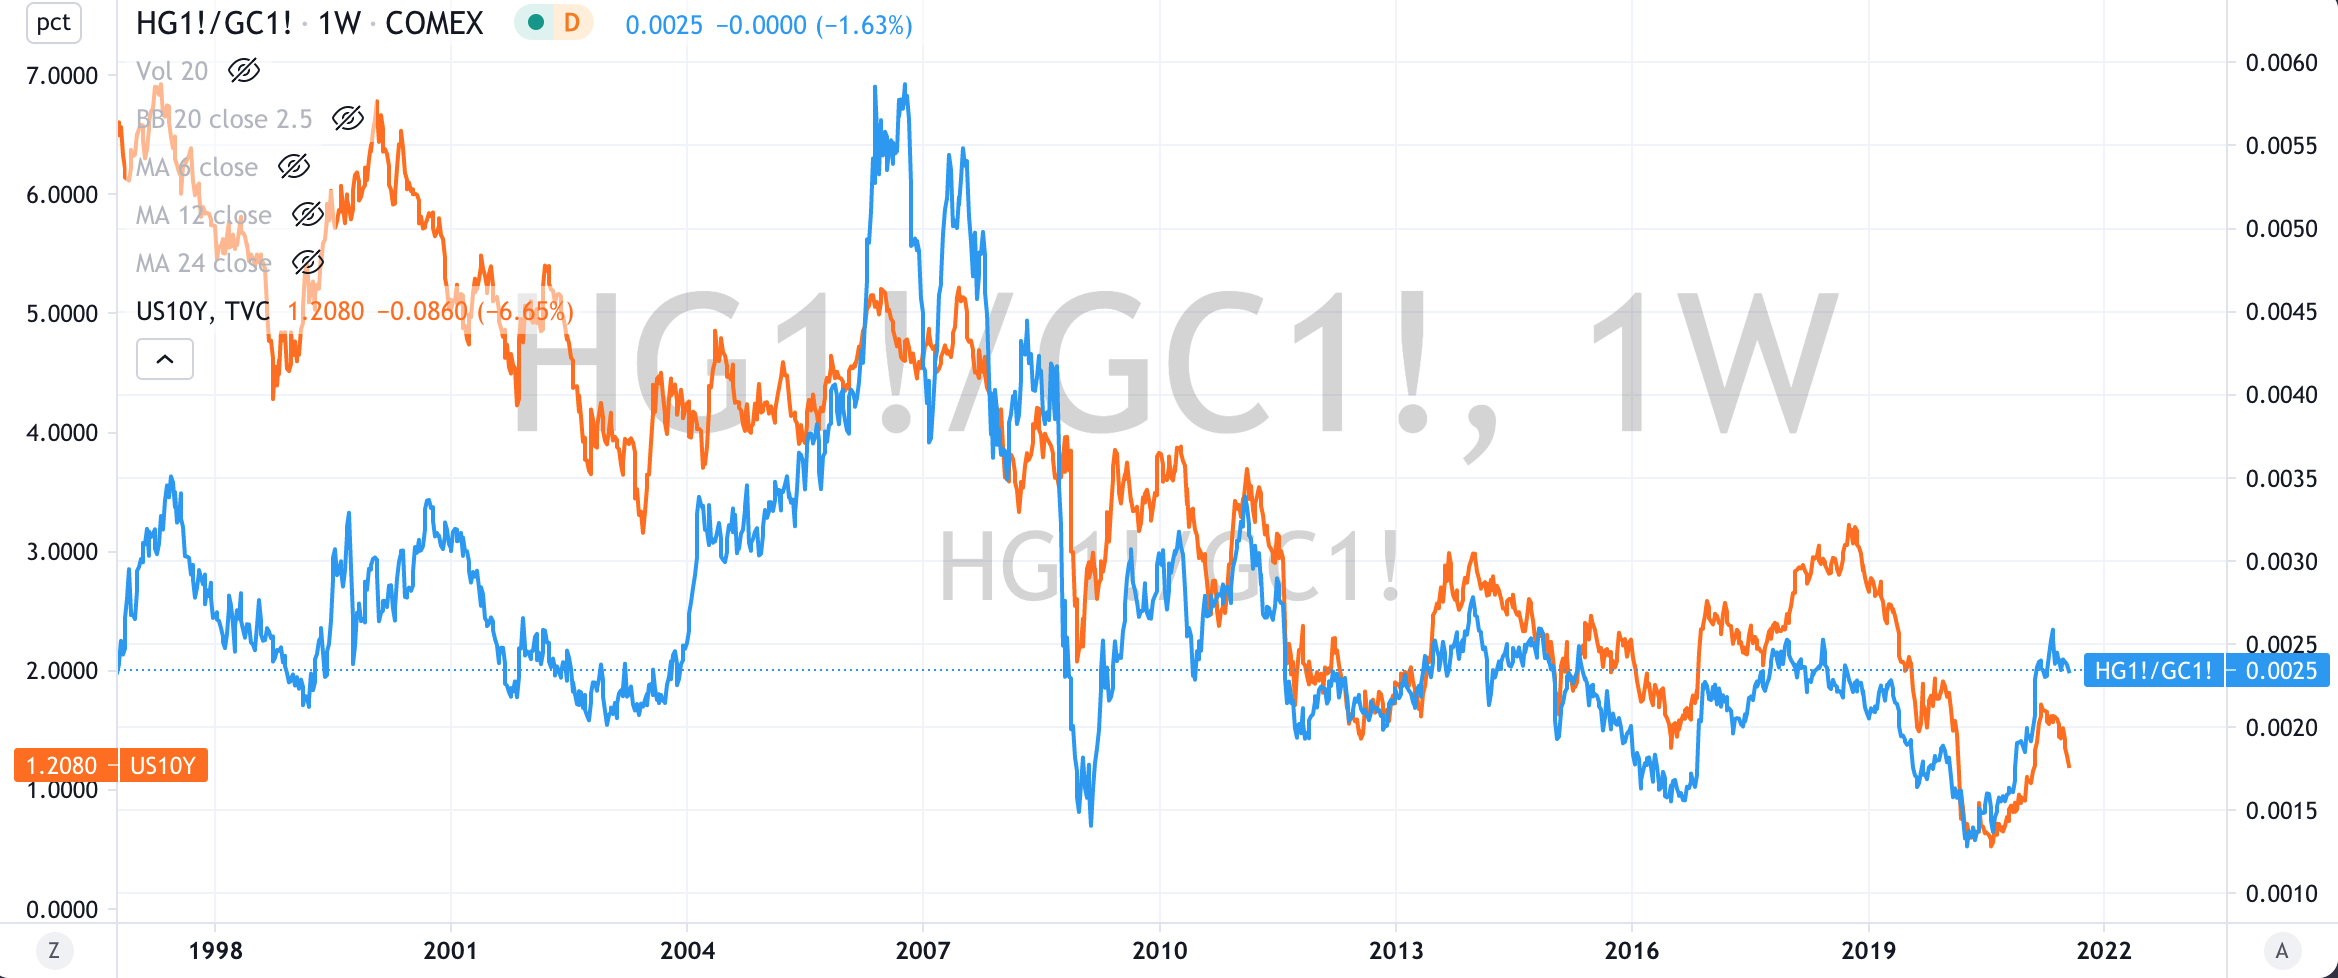
Incidentally, the stock price of Sandfire Resources correlates well with the price of Copper……and Copper correlates closely with other currencies, inflation, bond yields and gross domestic product readings.

* still not personal advice.

April 17, 2023

by Rob Zdravevski

rob@karriasset.com.au

Sell Signal – Copper

On August 8, 2022, my writings about a low in the Copper price hinted at how investors could take participate in that view.

One stock that I favoured for various reasons (including being a beneficiary of a low Chilean peso) was to accumulate the equity of the Chilean copper mining company, Antofagasta

The listed London securities touched GBP 10.00 in the weeks preceding the publishing of that note, which was when clients received the buy advice. Below GBP 11.00 remained fertile ground to acquire the shares.

But there are times when I sell.

Beyond the subjective observation of the price action resembling a parabola coupled with a 63%+ advance within 6 months……….

Last week, Antofagasta simultaneously registered to a weekly Overbought reading, traded up to 2.5 standard deviations above its rolling weekly mean and its price was greater than 50% above its 200 Week Moving Average.

This moment was triggered at any price above GBP 18.00

Then I take a look at correlation between Antofagasta’s stock price and that of Copper. This is shown in the next chart.

This should prompt readers to ponder the correlation, effect and representation the price of Copper has with Equities, Oil, GDP and Interest Rates.

Indeed, there are times when to sell.

January 20, 2023

by Rob Zdravevski

rob@karriasset.com.au

When are commodities cheap?

Commodities are cheap when the CRB Index trades below its 200 week moving average and registers a weekly Oversold reading.

Presently, the heavy weighting of the energy complex is keeping commodity indices at elevated levels.

In fact, todays pricing is at levels exhibiting similar stretched moments prior to the CRB Index converging towards its 200 week moving average.

Keep in mind, that this is a study of the CRB Index, for selected commodities are in their own ‘cheap’ territory such as Copper and Iron Ore.

November 10, 2022

by Rob Zdravevski

rob@karriasset.com.au

My current picture of the price of Copper.

Resistance lines are being flirted with.

I expect the new yet weak short term rising daily trend to exhaust itself between $3.56 – $3.61 level.

This should see the S&P 500 and AUD/USD mimic this directional short-term move.

I’m watching out for a ‘bull trap’.

The downward medium term trend in Copper remains intact.

I would need to see Copper trade above $3.79 for that bearish medium term trend to wane.

October 24, 2022

by Rob Zdravevski

rob@karriasset.com.au

Health Check – the Copper/Gold Ratio

Checking in on the Copper/Gold Ratio and if it is Oversold on a Weekly basis because its coincides with a “low” in the S&P 500.

We saw the most recently occurrence in June 2022.

We can also look at the Copper/Gold Ratio as an indicator of the economy’s health.

A glass half-full suggests the economy currently isn’t ‘too sick’

A glass half-empty view ponders that the economy is heading into sickness.

There is no written rule that the Copper/Gold Ratio needs to ‘double dip’ into Oversold territory again. It may already have done its ‘sickness’ signalling and we haven’t seen it make such a double dip before.

Would would it take to do so?

One scenario would be to see the Copper price trade to $3.00 (12% lower than today) while the price of Gold remains steady.

My studies suggest this is plausible while Copper’s medium term trend remains downward.

It’s worthy to note that the Copper/Gold Ratio (HG/GC) correlates well with the direction of interest rates and currently there is a notable divergence occurring, with U.S. 10 year bond yields drifting higher and apart from the HG/GC.

That’s for another post.

October 17, 2022

by Rob Zdravevski

rob@karriasset.com.au

Copper

The Copper scarcity theme remains intact. Timing and how you express your investment view will be my focus.

It was wrong to chase copper related equities and an equivalent Chicago copper price a $5.00.

“They” are now, somewhere between 30% and 60% lower than the price was 3 months ago.

https://www.bloomberg.com/news/articles/2022-09-21/copper-prices-fall-despite-signs-of-looming-crucial-metal-shortage?sref=qLOW1ygh

Watching correlations

Yesterday I posted charts showing the correlation between the

a) AUDJPY vs U.S. 10 year bond yield

and b) AUDJPY vs the CRB (commodities) Index

Today (below) you can see how a) Copper vs AUSUSD

and b) Copper vs the U.S. 10 bond yield are ‘tracking’ each other.

September 7, 2021

by Rob Zdravevski

rob@karriasset.com.au

Economy Health Check

I’m watching the Copper/Gold Ratio (HG/GC)

Its direction tells me about the health of the economy.

The direction of the HG/GC also helps confirm the direction of interest rates. More specifically, the U.S. government 10 year bond yield.

In the chart below, I’ve overlaid a price chart (in blue) of the S&P 500 against the HG/GC.

You can see that the general direction of both the SPX and the HG/GC follow each other.

At this moment, the HG/GC is nearing a point where it breaks either way.

We’ll need to wait and watch in the coming week or so.

In my earlier post today, I imply that interest rates may rise.

This, then suggests that the HG/GC breaks higher (meaning Copper rises and Gold declines) which translate into the S&P 500 rising further.

A ‘melt-up’ in the S&P 500 is not a perverse idea, especially against the grain of many who are calling the top, let alone a crash.

It may seem odd to think, but markets often move to where they can do the most damage…..

and going higher can damage those who have been on the sidelines or sold up recently.

Missing out can also hurt investors.

September 10, 2021

by Rob Zdravevski

rob@karriasset.com.au.

Copper on verge of breaking lower

Carrying on from my May 2021 call and reiteration in June 2021, Copper continues its laddered decline closer to its longer term mean.

Today, Copper is perilously poised.

It is trading at $4.24 on the front Comex contract and a break below $4.17 could see a swift decline to the $3.65-$3.43 level.

Your stop loss on a new short entered here would be $4.37, while a move above $4.45 will help wane the strength of the current downtrend.

August 18, 2021

by Rob Zdravevski

rob@karriasset.com.au

The economy is still healthy

The direction of the Copper/Gold Ratio (HG/GC) is a good indicator for checking on the health of the economy. Think of it as a thermostat.

It is also well correlated to the direction of the U.S. 10 year (the 10’s) bond yield. Often, the HG/GC precedes the move in interest rates.

In a recent post I wrote about the HG/GC’s relationship to the S&P 500.

Today, the short-term direction of the Copper/Gold Ratio has been down and so the 10’s (and S&P 500) have mimicked that.

The longer trend upward trend of the Copper/Gold Ratio remains intact.

Where this ratio trades to and its effect on the 10’s will determine the size of, and where the allocation of capital moves to.

Separately, (on a weekly basis) the 10’s have traded down to 3 standard deviations below its mean. Such a 3-sigma event has foreshadowed higher equity prices.

It’s at an acute point, however the equities bull market continues.

July 21, 2021

by Rob Zdravevski

rob@karriasset.com.au