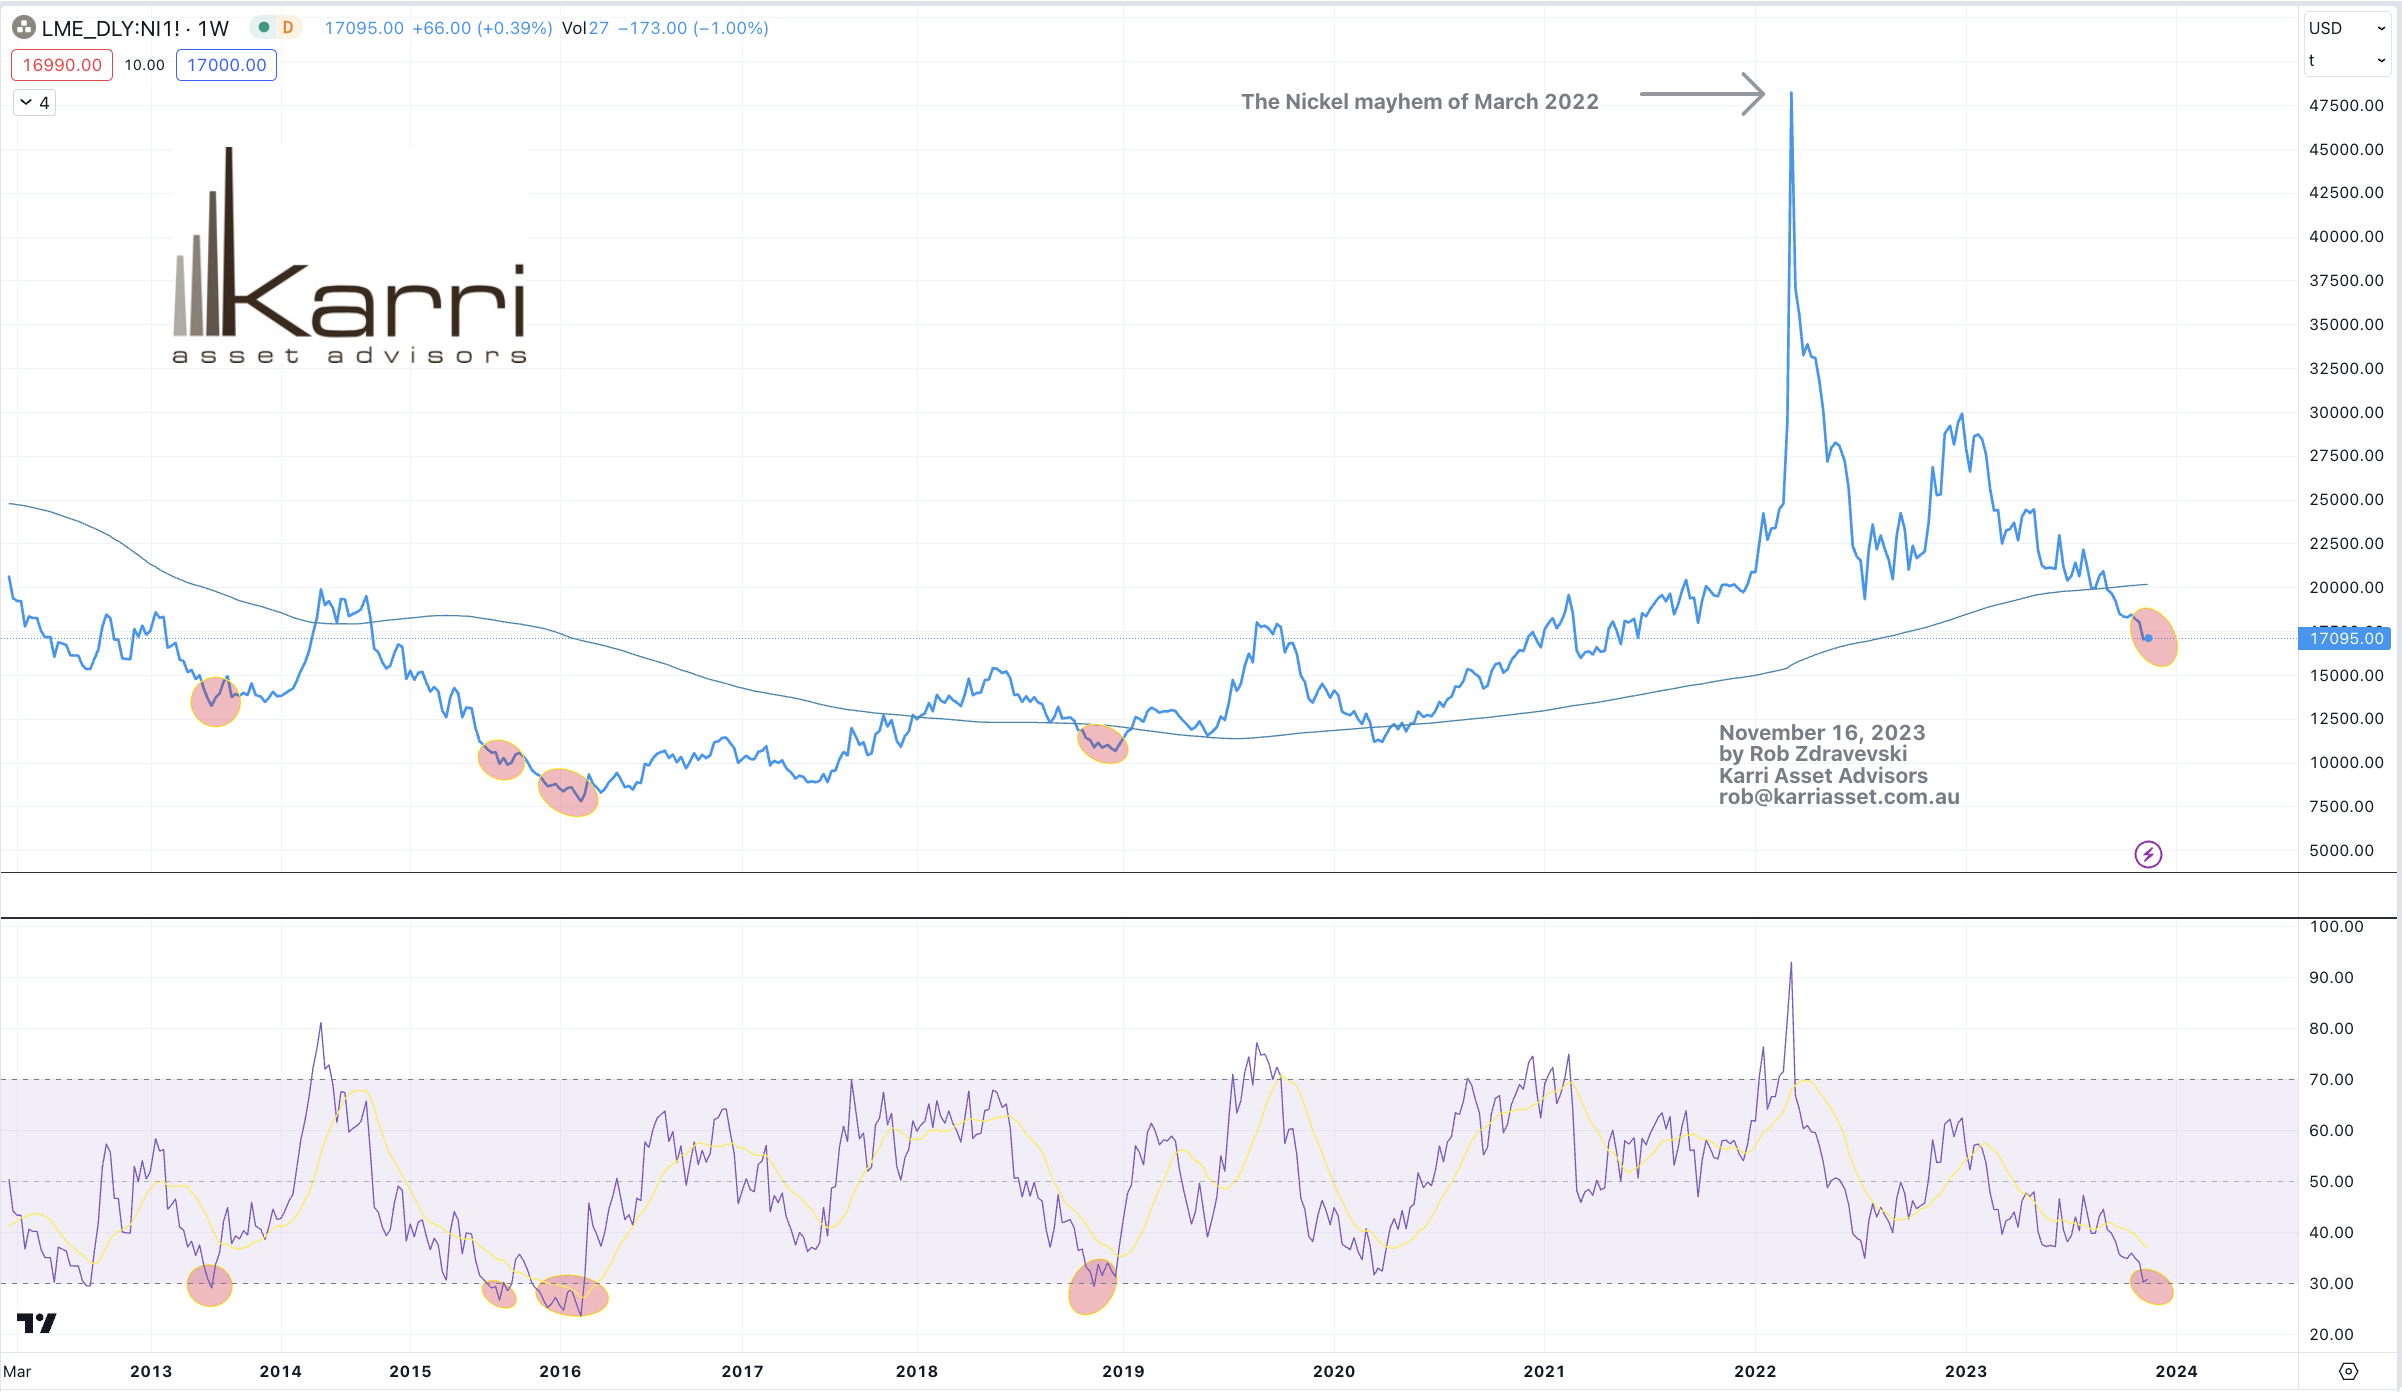
Readers of my weekly Macro Extremes newsletter may have noticed that the Nickel price is appearing in the Oversold category.
It doesn’t happen all that often.
And so how to position for this view may come in the form of owning Nickel mining producers, or those hoarding Nickel reserves, perhaps it’s an opportune for buyers of Nickel (stainless steel) to lower their input costs or just buy Nickel itself.
There is a preface within my latest newsletter ‘Warming To Commodities’, that I have been a bearish on commodities and their related stocks for the past 2 years.
2 years ago, I wrote this note about Australian mining company, Chalice Mining (CHN:ASX) and it was an example of my bearish views.
Following that near-term August 2021 timeframe, the stock price danced between both ends of its ‘extreme pendulum’.
This week, Chalice Mining’s stock price finally mean reverted back to (and below) its 200 week moving average. This satisfies my criteria of an ‘oversold’ extreme where it’s also oversold on a weekly basis and trading 2.5 standard deviations below its weekly mean.
Whilst the downward price trend is strong suggesting further weakness (and there are gaps way below), the lesson is more about observing where the upper end of the ‘extremes’ range was and how the ‘mean’ rolls and morphs over time.
For example, back in August 2021, the 200 week moving average for Chalice sat at $1.49……now that mean is at $4.82.
Now, it’ll be important to watch if the stock price holds $3.37, which was its June 2022 trough.
Interestingly, nearly 15% of the company’s shares outstanding have been traded in the past 4 weeks of weakness.
Providing that ‘nothing is broken’, this is also an example where ‘weaker hands’ are throwing their stock away, into the hands of ‘stronger hands’.
Readers of my posts may note that I’ve been bearish commodities for about 15 months, which was soon after the Russian invasion of Ukraine.
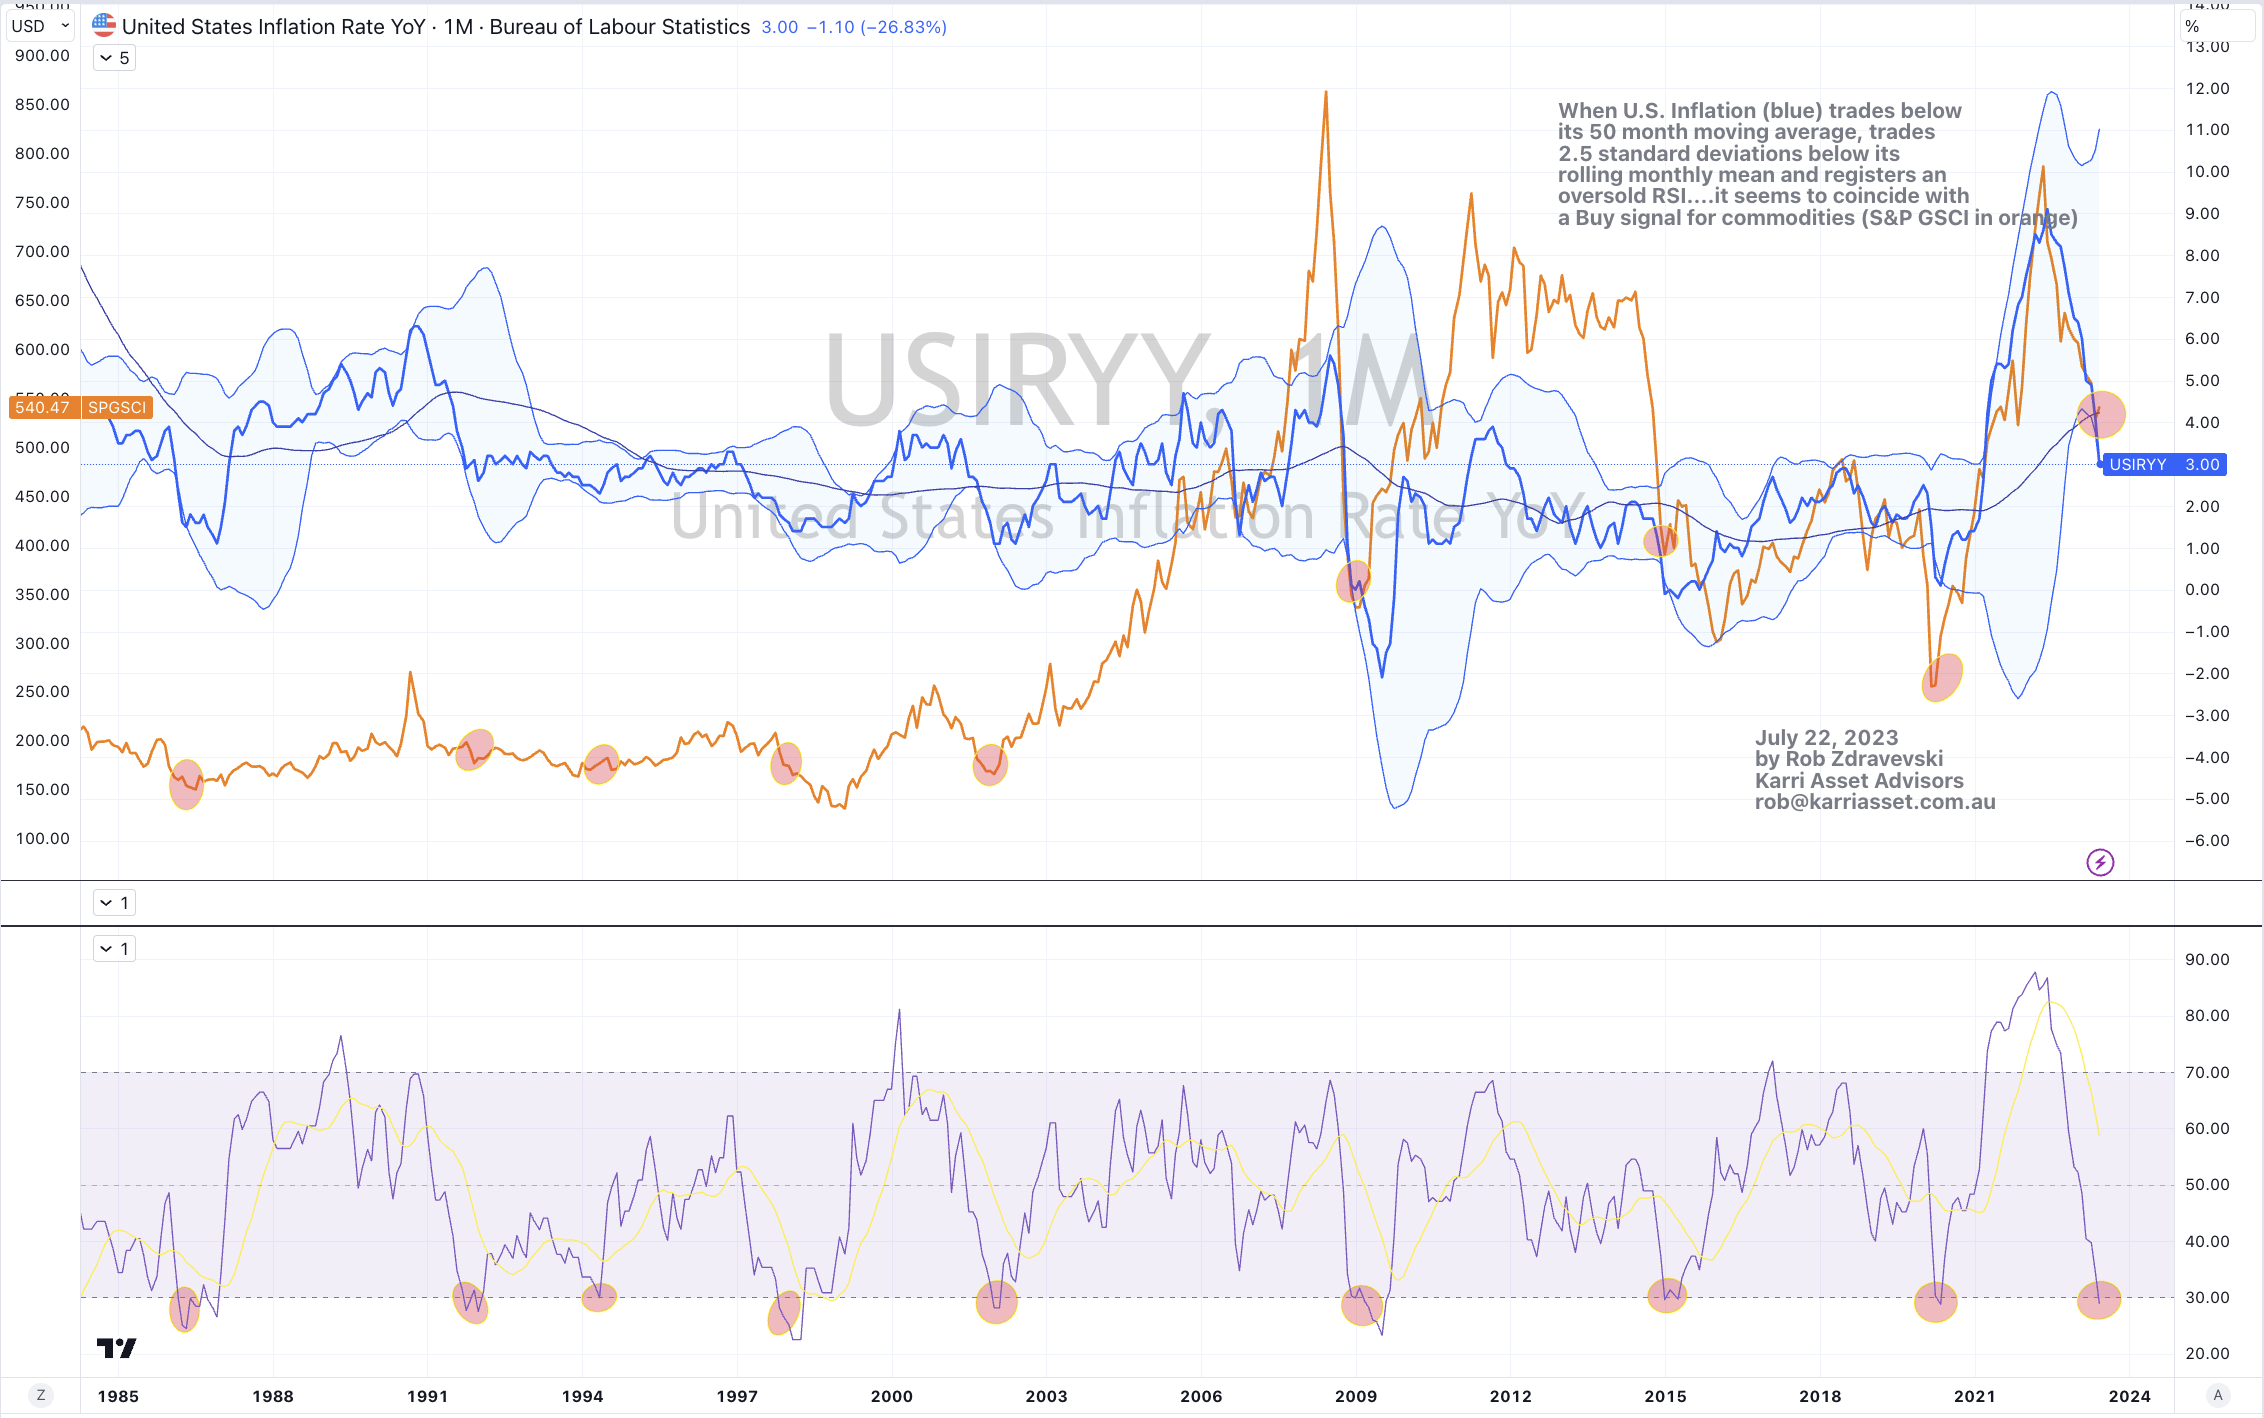
I have a host of reasons for my commodity bullishness but the study below helps paint a correlated picture to support my broader thinking.
When the U.S. Inflation Rate (blue) ventures below its 50 month moving average, it trades 2.5 standard deviations below its rolling monthly mean and also registers an oversold RSI reading….it seems to coincide with a Buy signal for commodities, with the S&P Goldman Sachs Commodity Index represented in orange.
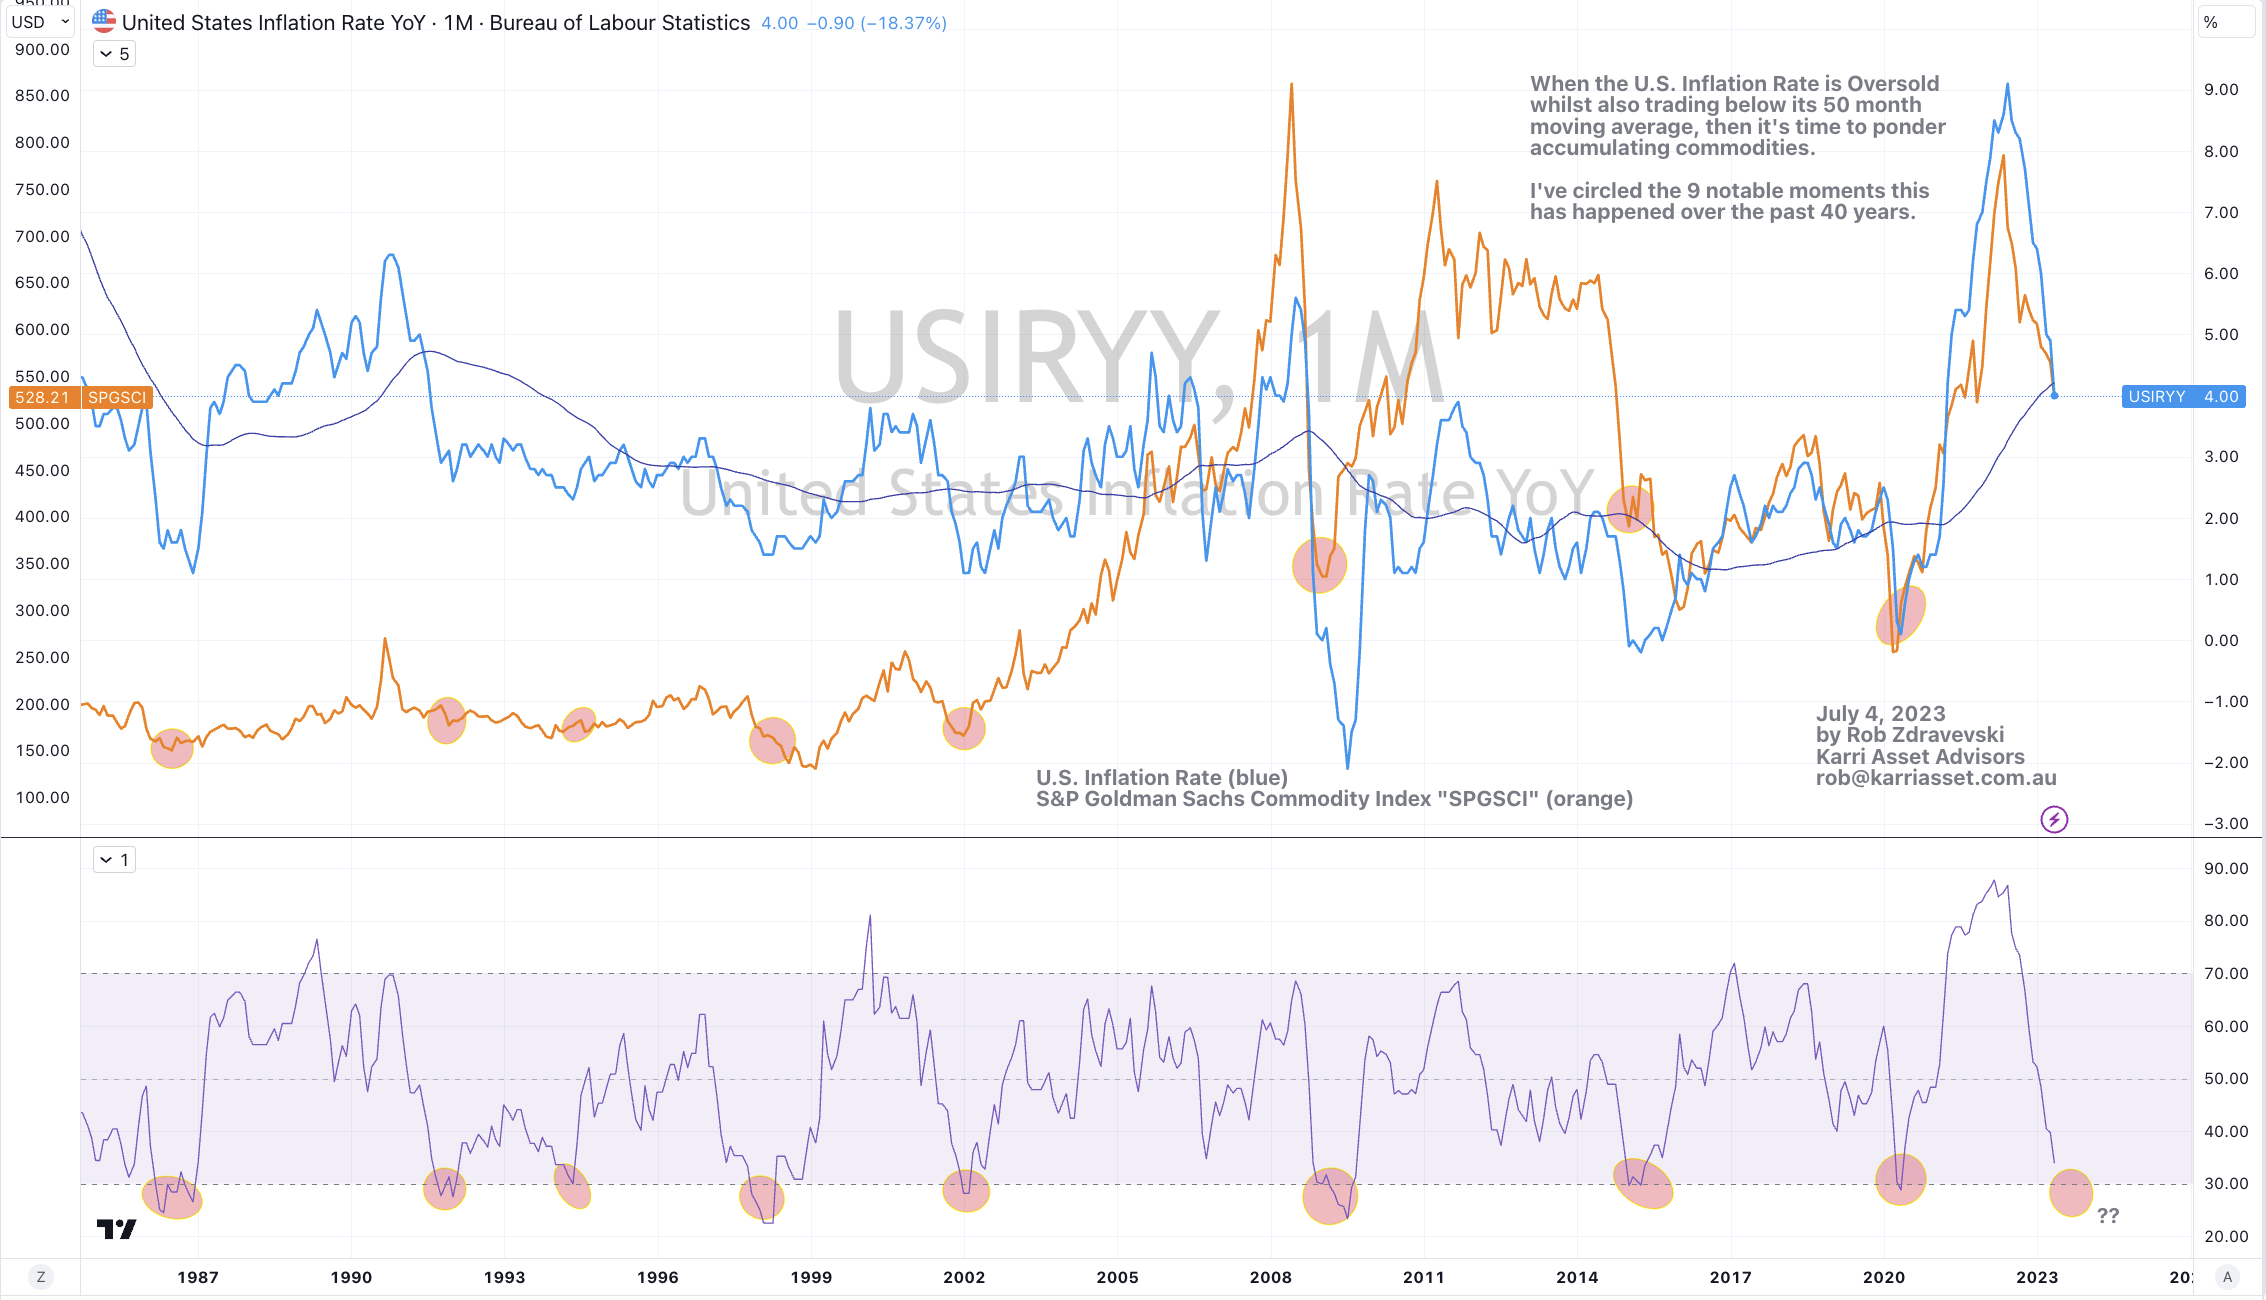
When the U.S. Inflation Rate is Oversold whilst also trading below its 50 month moving average, then it’s time to ponder accumulating commodities.
I’ve circled the 8 notable moments this has happened over the past 40 years.
We may be approaching another such moment.
My recent writings muses that U.S. inflation may have one more dive to the 3.5% region in the coming monthly reports and this should be enough for the stars to align.
The chart below plots the U.S. Inflation Rate (blue) against the S&P Goldman Sachs Commodity Index “SPGSCI” (orange).
I use this ratio (in blue), being the Wilshire 5000 Total Market Index divided by the S&P Goldman Sachs Commodity Index (SPGSCI) to help identify when equities are either cheap or expensive relative to commodities.
Readers may piece together that I have bearish on commodities for the past 15 months or so.
I have circled 13 notable periods over the past 30 years when this ratio was overbought on a weekly basis.
Commodities are now entering such a period of being relatively attractive compared to equities.
Furthermore, it has risen 50% from a low seen on November 1st, 2022.
The chart below shows an empirical study of the percentage that the price of sugar has traded above its 200 week moving average.
Ordinarily, such rising inputs would normally affect the margins of chocolatiers, confectioners and soft drink manufacturers, however it seems these companies have managed to pass on higher costs under the story of wide spread inflation.
Many of their stock prices are performing very well.
The rising price of sugar is also a boon to sugar cane growers (with Brazil and India being the world’s two largest producers) and those around Mackay, Queensland.
Today, the price of sugar is trading in rarified air.
It is also registering overbought tendencies.
And when my analysis incorporates the outsized ‘long’ positions in the Commitments of Traders then I will recognise it as the momentum trade that it is.
In other words, the probability of higher prices diminishes under the current conditions and any unwinding of those non-commercial ‘trading longs’, can see a sharp drop and test of that 200 week moving average.
I am constructively bullish about commodity prices, however that opinion is not broad nor blindly so.
I’m working on how to express my best ‘absolute’ view in a specific commodity or theme. Buying scarcity and those who have capacity will be a key criteria.
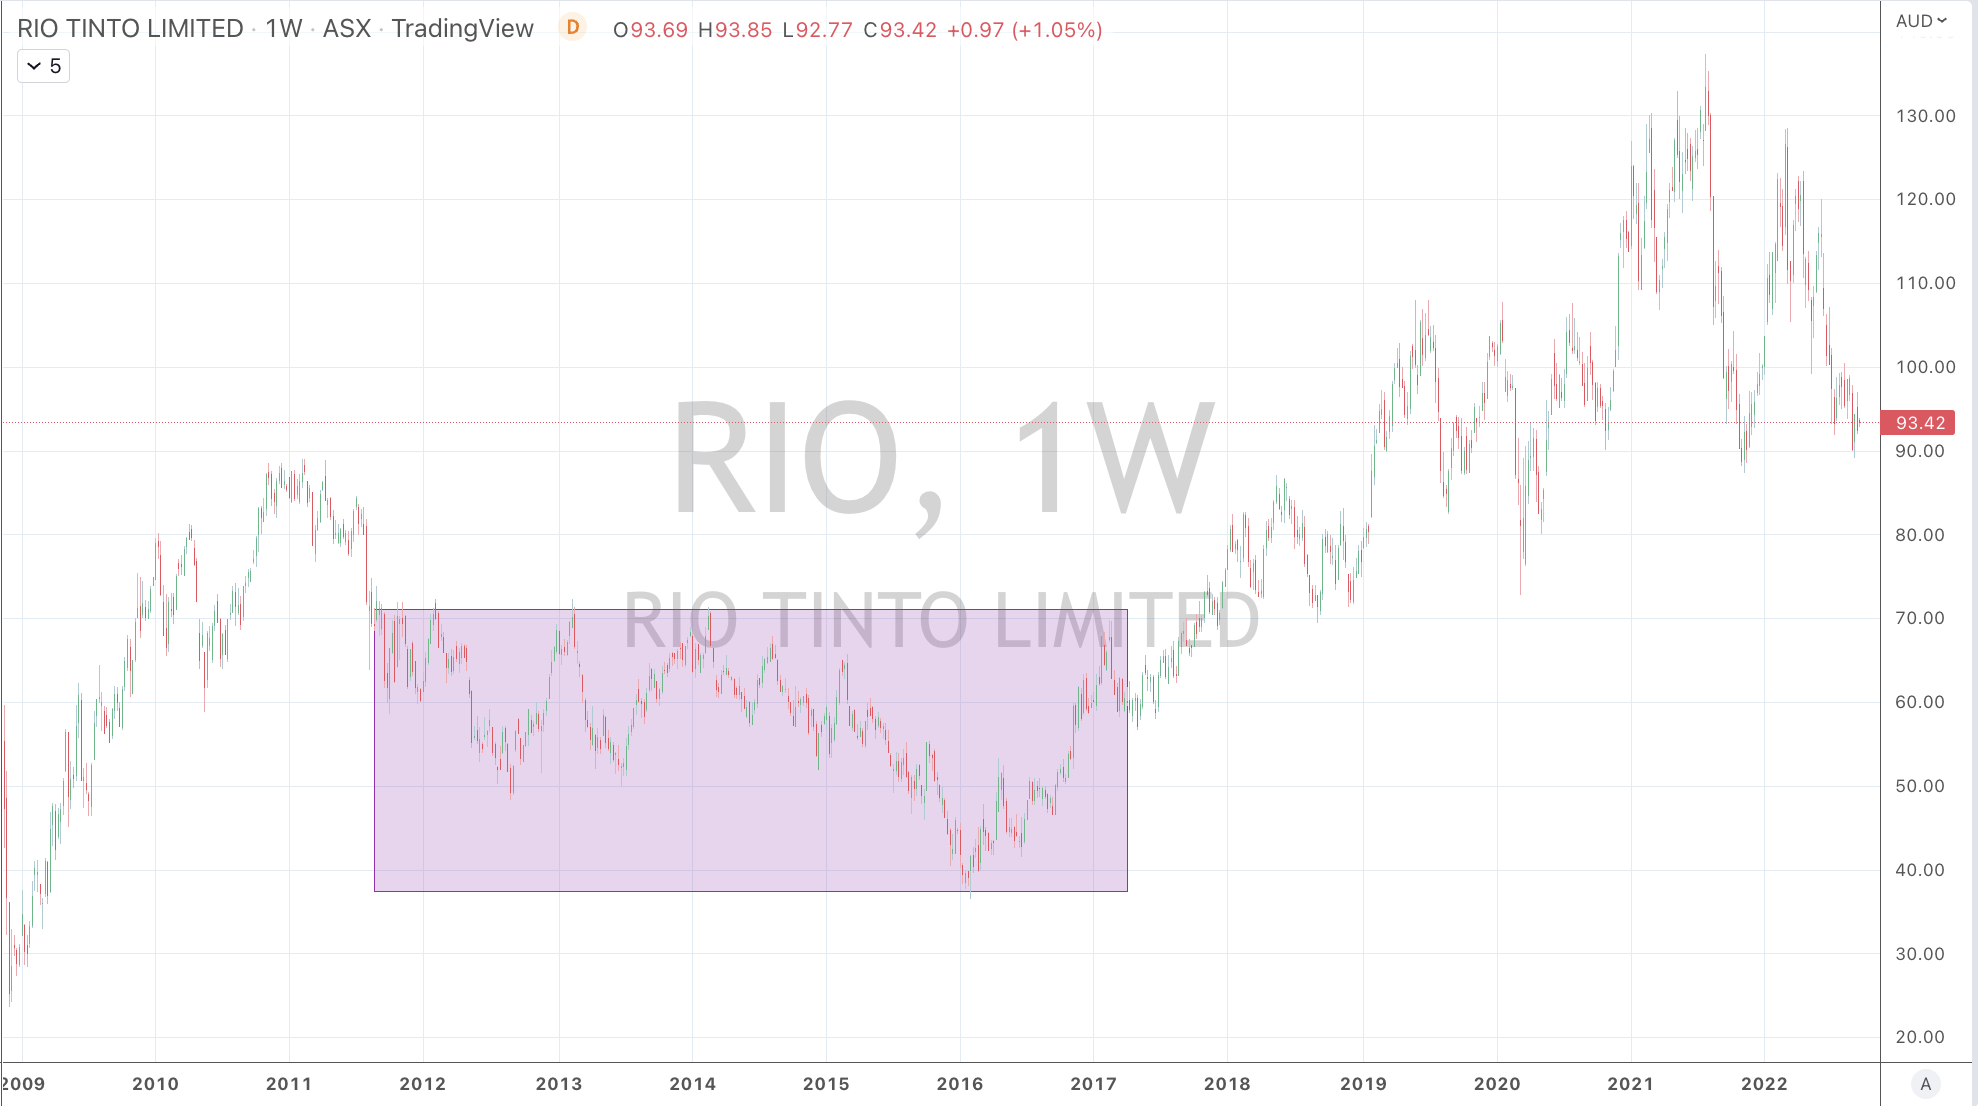
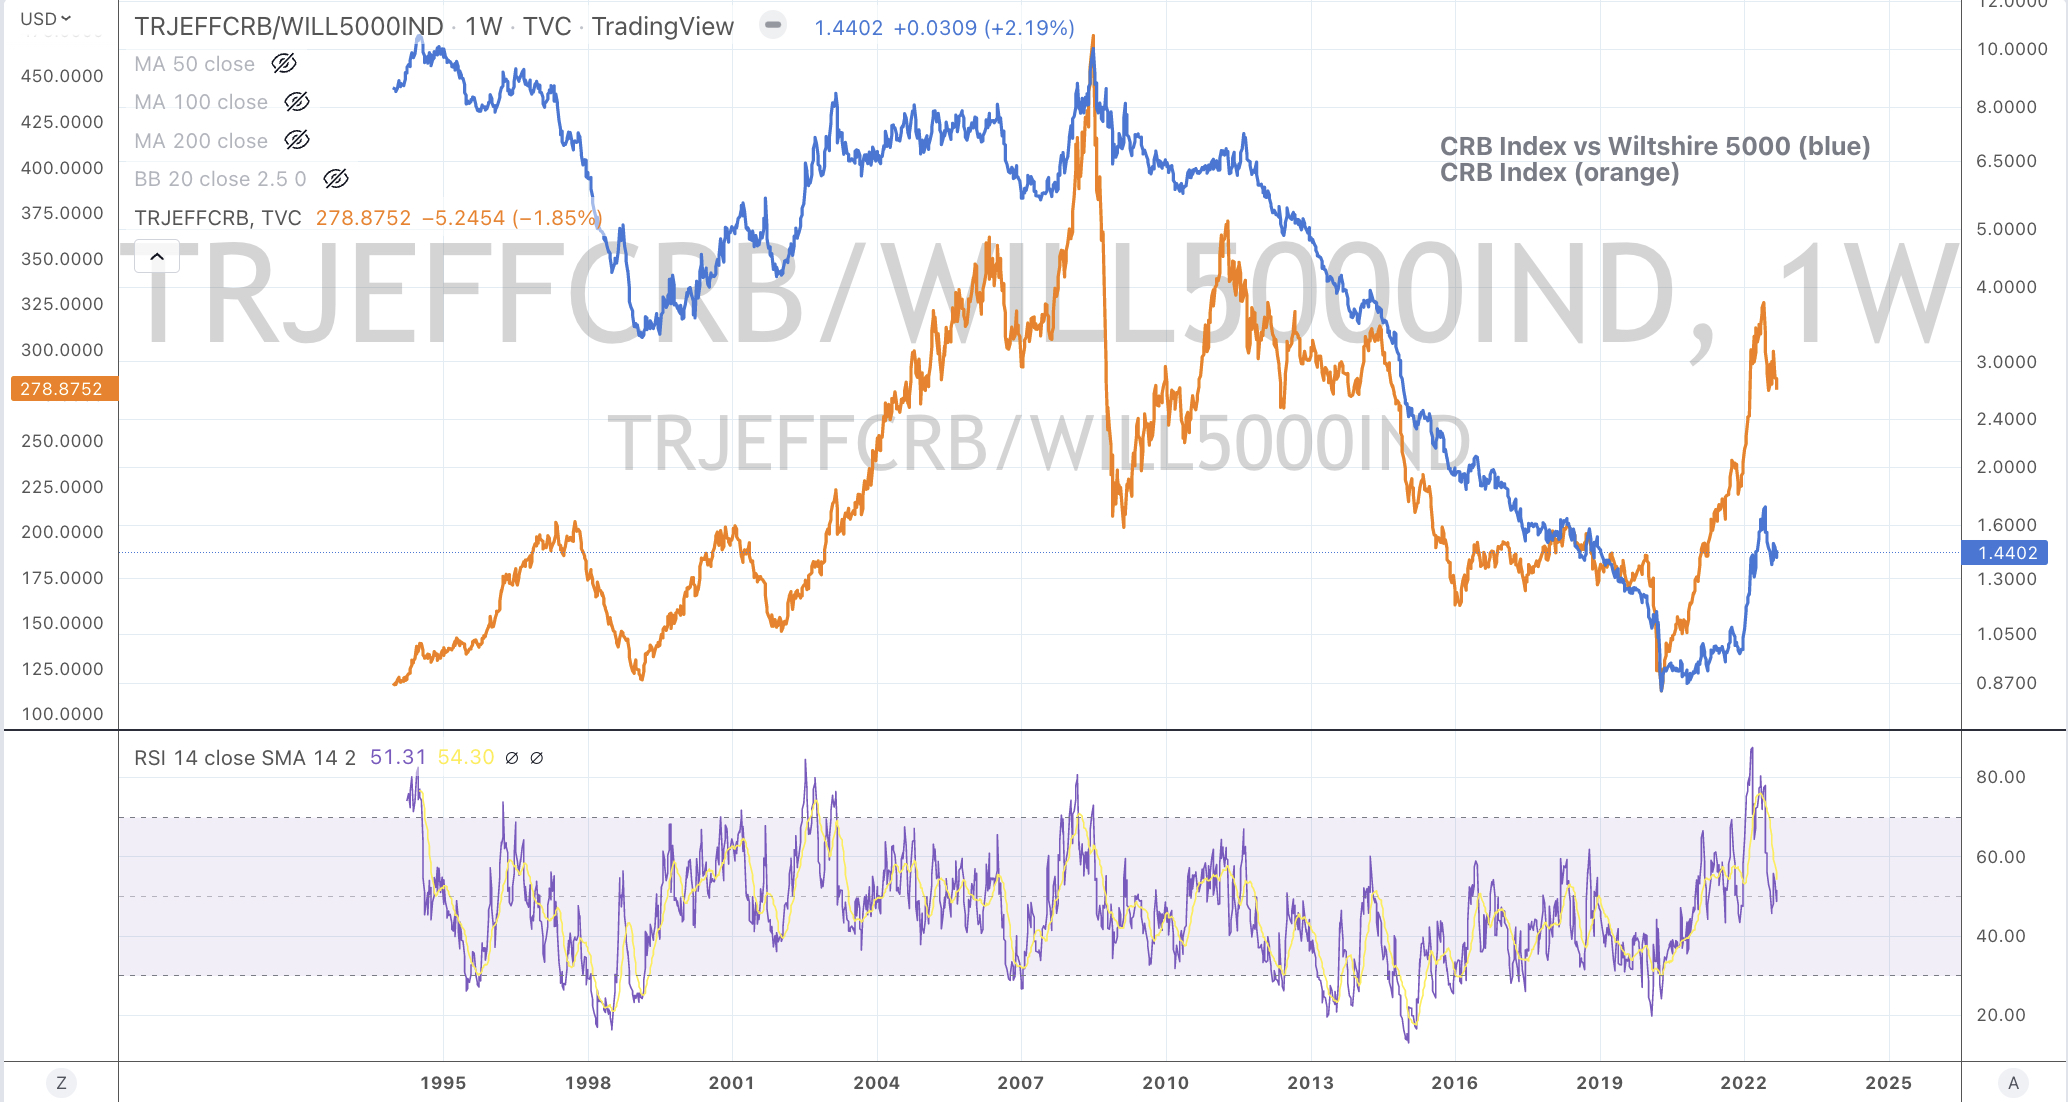
I remind myself that commodities can trade sideways (as Rio Tinto did for 7 years) and the broader CRB Index had for a 10 year bear market.
While I find analysis on a ‘relative basis’ irksome, commodities are nearing another visit to being inexpensive relative to equities, as the CRB Index to Wilshire 5000 chart shows.