However, the context is that we are nearing the end of these moves, rather than the start of a new trend.
If it turns out to be an extension of the existing trend, I remind myself that the last 10% of a ‘trade’ is often the most difficult part to be involved with.
The Bearish USD ETF is exhibiting extremes including being at the higher quintile of historical percentages which it’s trading below its 200 week moving average.
Anecdotally, all I am hearing is about U.S. Dollar strength. Now (the financial media) are calling referring to it as “King Dollar”.
Remember when 2 years ago, they were calling the demise of the U.S. Dollar?
I don’t think the market is about to break but many money managers may.
Peers are speculating whether there are big funds unwinded losing and problem positions.
Perhaps so but that often coincides with the ‘straw which broke the camel’s back’.
Many thought buying government bonds yielding 0.60% for 10 years to be a good bet.
In fact, many thought buying German bonds for a NEGATIVE 0.60% (as shown in orange in the chart below) was somewhat appropriate.
And their reward is………..a 20% loss of capital (with no interest coupon paid), as shown by the blue line of a German Bond (SDEU) ETF.
When you consider that “balanced” funds including those in the pension or insurance business may typically follow a model of allocating 60% of monies to equities and 40% to bonds, they may be double hurting as Germany’s DAX equities Index has fallen 24% from its peak.
That’s the reporting of what happened bit.
Now, many think this is ‘forever’. Many think trends and streaks don’t end, wane or reverse.
Consider the contrarian view to the extremes we are seeing?
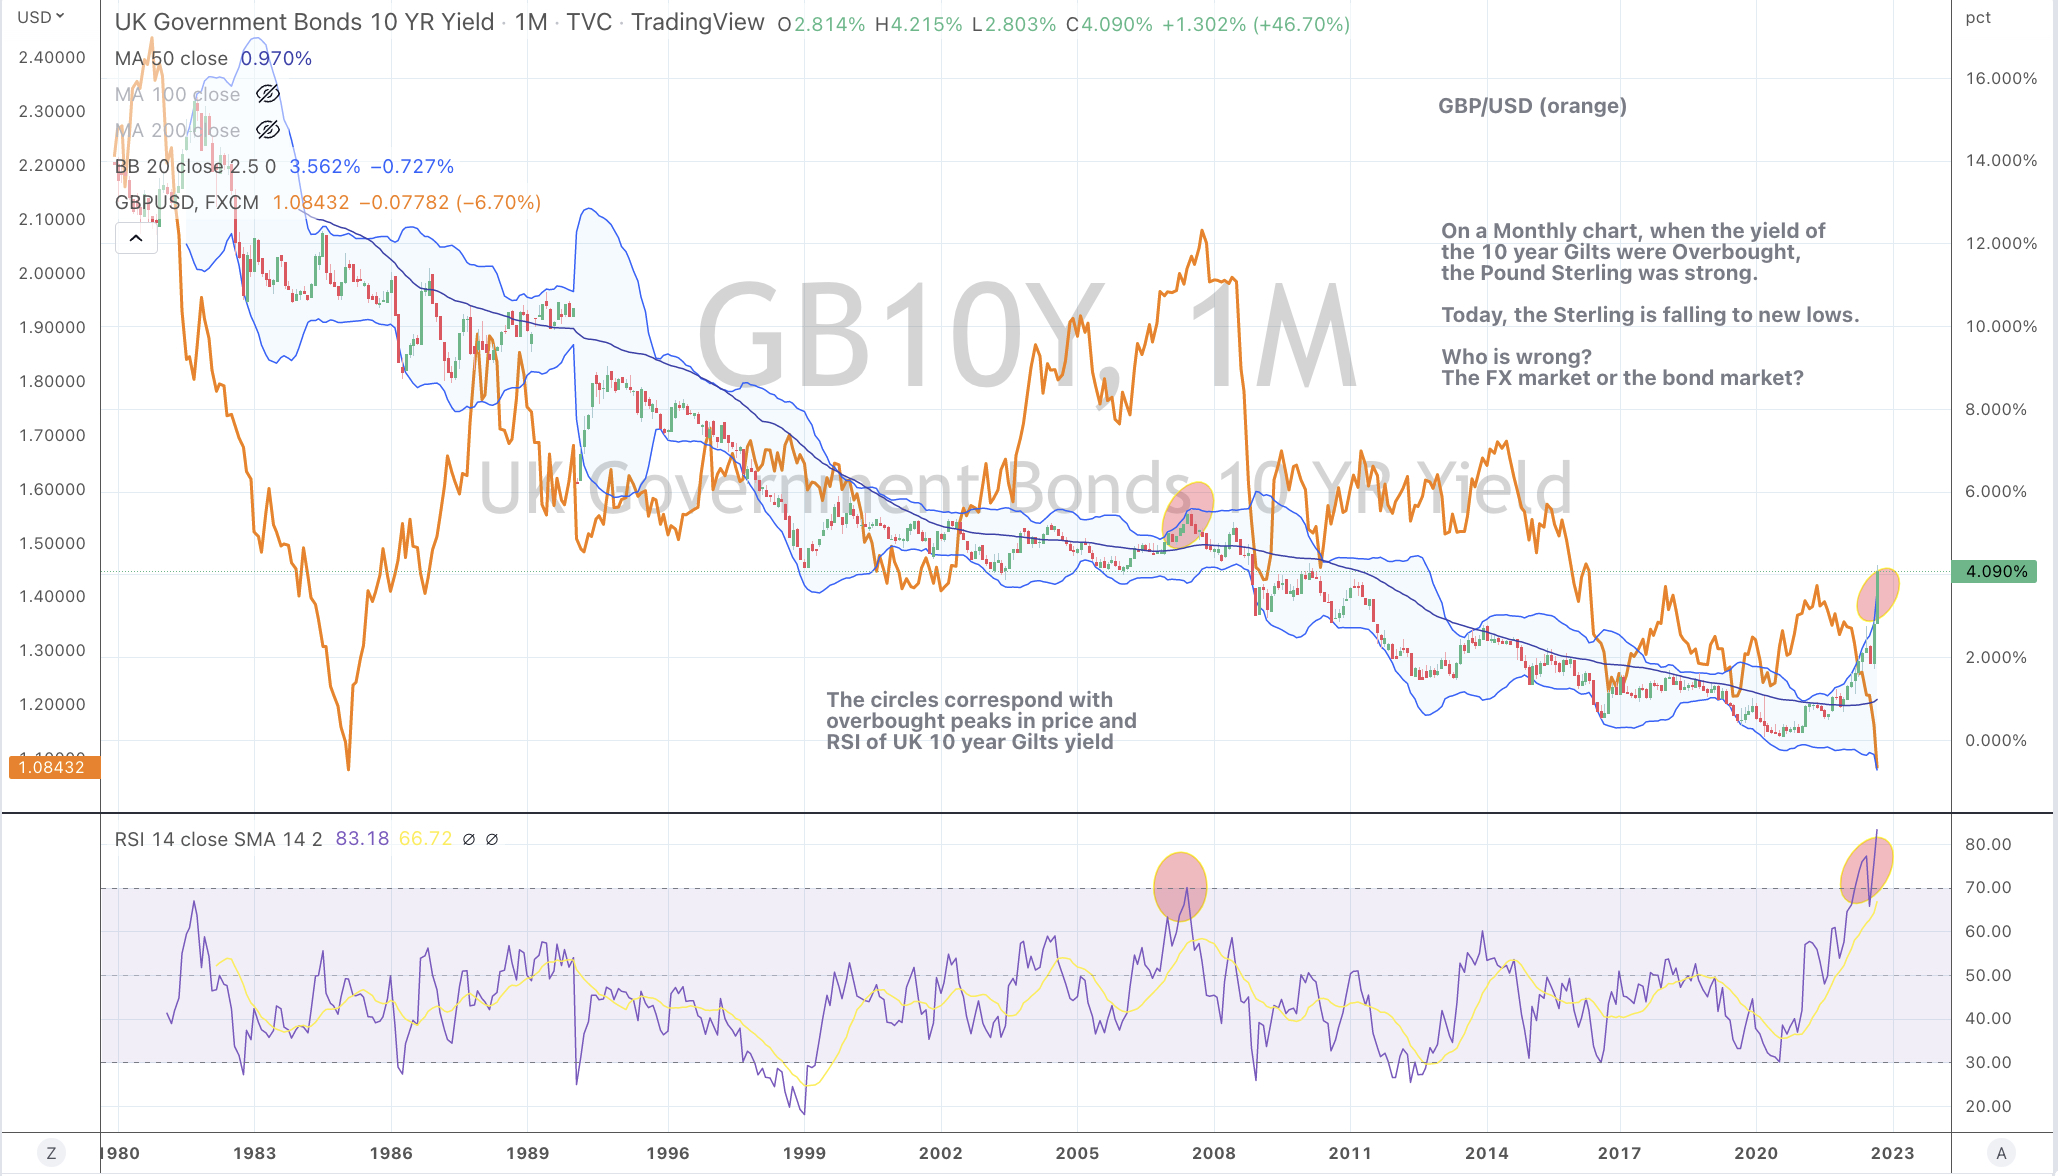
On this Monthly chart, when Gilts yield were Overbought, the Pound Sterling was strong.
Today, Gilts are Overbought BUT Sterling is falling to new lows.
Who is wrong?
The FX market or the bond market?
Whilst FX is the most liquid market, the bond market is more believable.
However, have British economic woes decoupled where this traditional symbiotic relationship of a weak currency and higher bond yields is now resembling what we see in emerging market economies?
Albeit this is a dramatically painted scenario, I don’t think this is the case.
The long term strategy is to Buy British Pounds (GBP).
If you are in the business of needing to own debt, then buying U.K. 10 year Gilts at this juncture (the highest yield seen in the past 12 years) is worth considering.
Inversely, I don’t know why you would initiate a new short at 4.10%?
I haven’t seen any of the ’talking heads’ on business TV suggest shorting Gilts at 0.15% but now they are concurring that it goes higher.
Keep in mind that many are simply ‘reporting’ what is happening today but few seldom make a call identifying the extreme end of the pendulum.
Time will tell but I can’t help think many are doing the wrong thing, at the wrong time.
U.S. year bond yields have never seen 8 consecutive weeks of rising yields. Stocks and Commodities tend to see streaks lose steam in the 7th or 8th consecutive week.
We are closer to the streak ending.
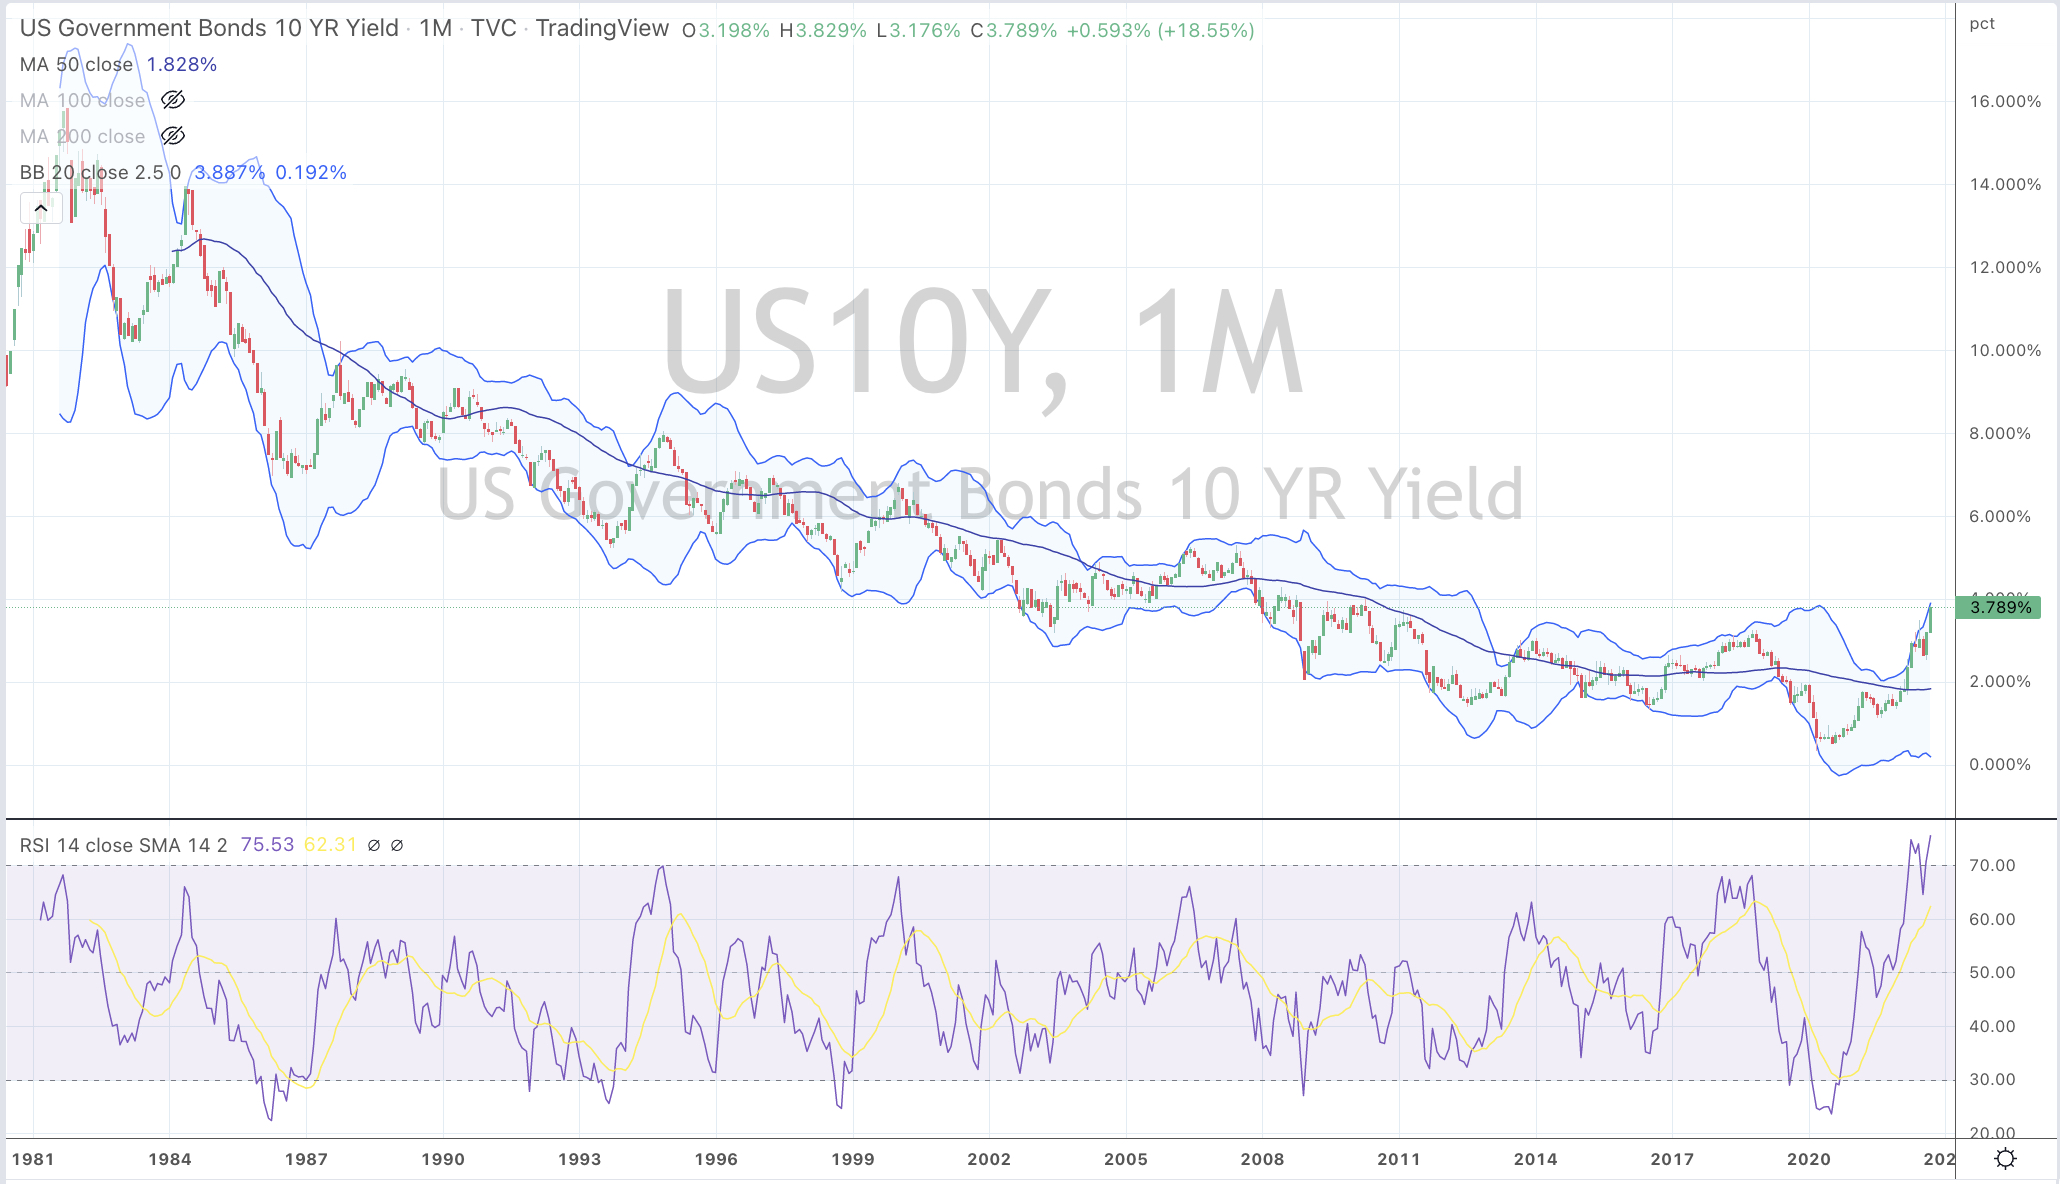
The U.S. 10 year bond yield has never been Overbought on a Monthly basis, until now.
The U.S. 10 year bond yield has never been extended this many percentage points above its 50 month moving average.
The U.S. 10 year bond yield is near to trading up to 2.5 standard deviations above its rolling monthly mean for only the 5th instance in 40 years.
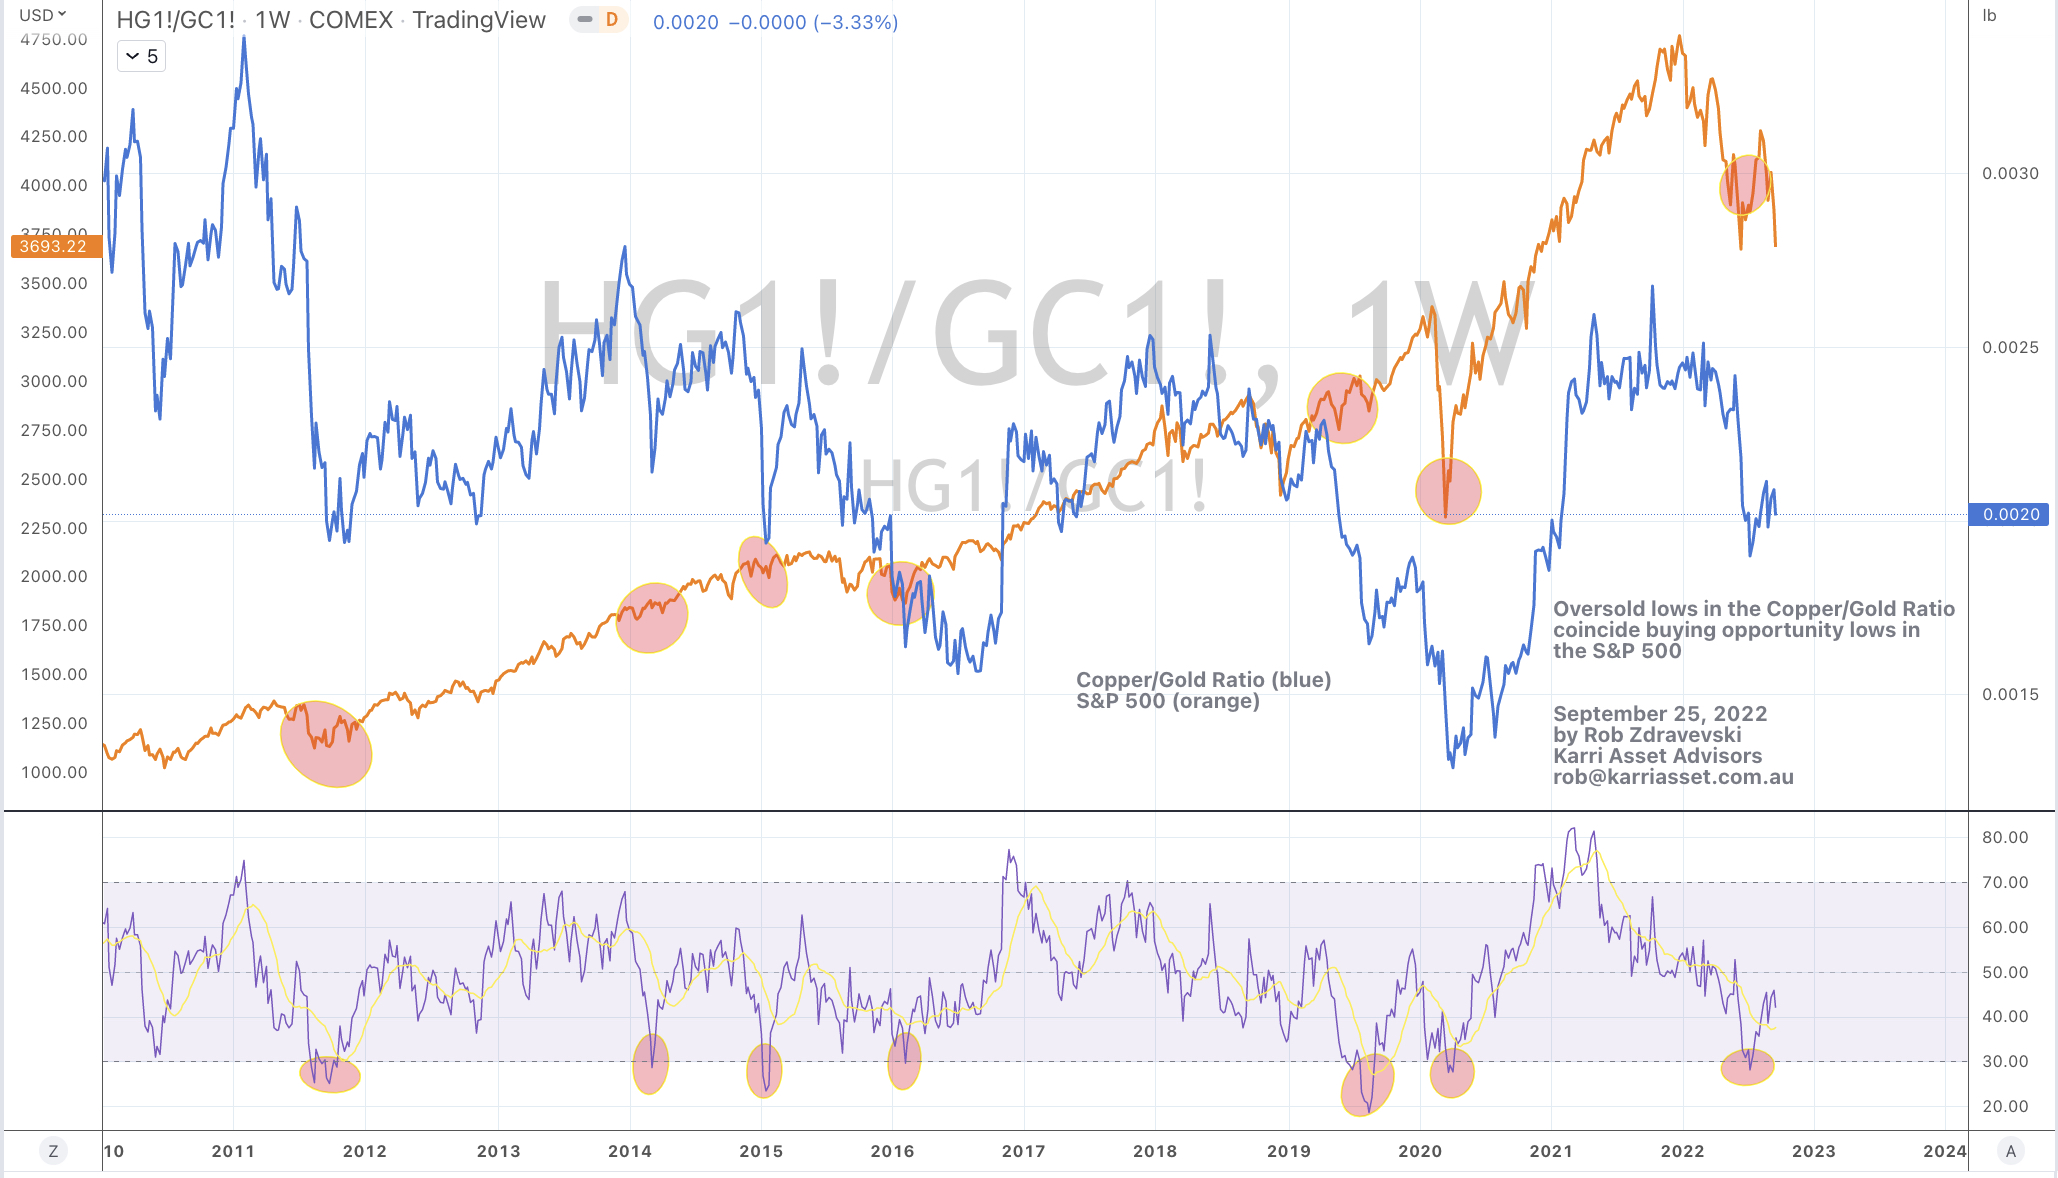
In early July 2022, the Copper/Gold Ratio registered its 7th weekly oversold reading within 12 years.
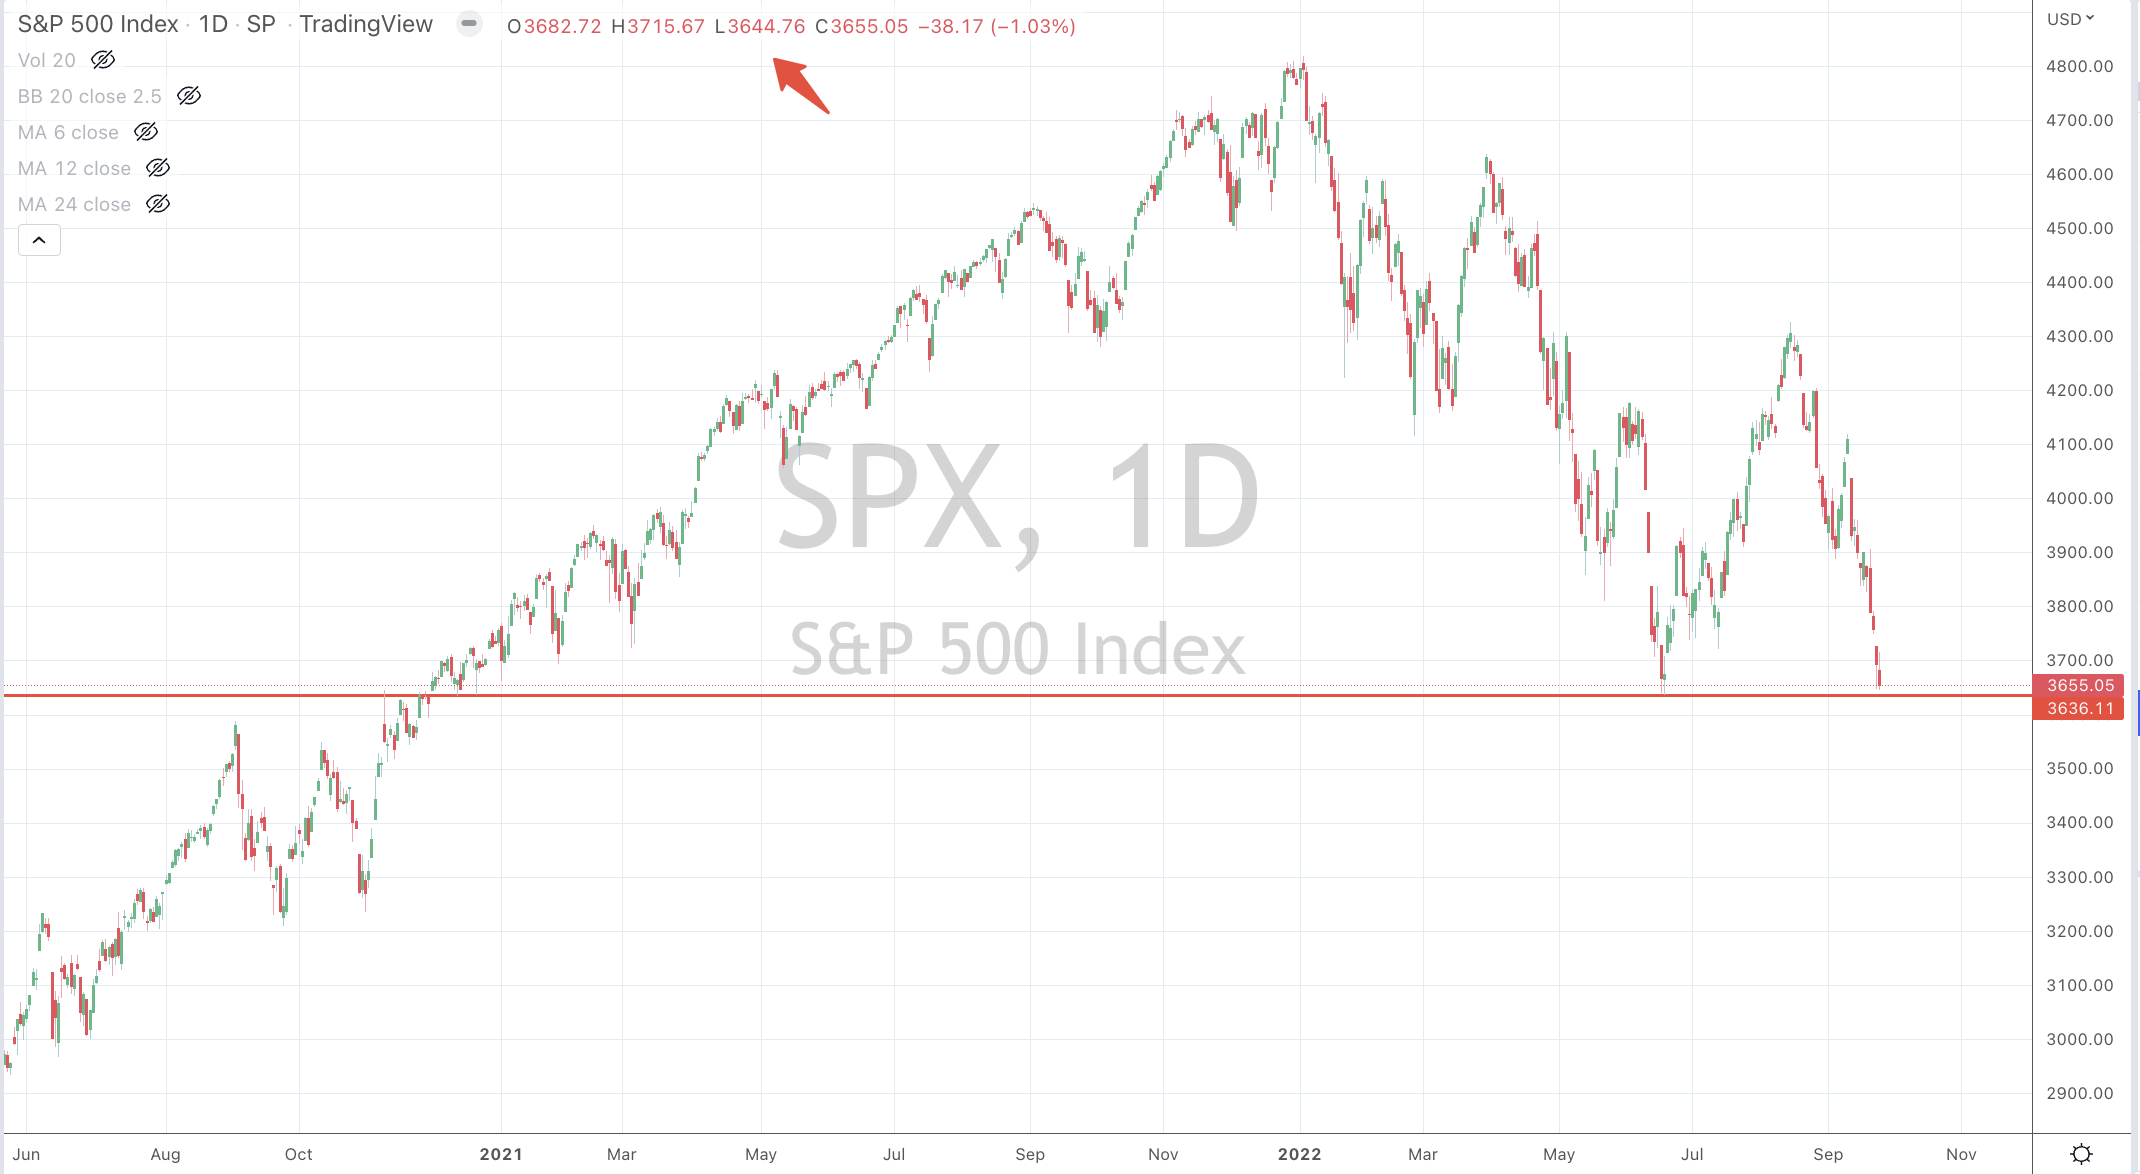
This occasion coincides with a notable low, or at least safer, longer term buying opportunity in stocks…..or as the chart below implies, in the S&P 500 Index.
In other posts I have mentioned how the monitoring of this ratio is also helpful in tracking the direction of interest rates.
In the meantime, I’ll watch if the Copper/Gold ratio re-visits the oversold region in the coming 3-8 weeks.
The following assets (on a weekly timeframe) registered an Overbought or Oversold reading and/or have traded more than 2.5 standard deviations above or below its rolling mean.
Extremes “above” the Mean (at least 2.5 standard deviations)
Australian 3 year government bond yield
U.S. 10 year minus Australian 10 year bond yield spread
Overbought (RSI > 70)
Greek, Spanish, Portuguese, Italian and U.K.10 year government bond yield
U.S. Dollar Index (DXY)
The Overbought Quinella – Both Overbought and Traded at > 2.5 standard deviations above the weekly mean)
U.S. Dollar Index (DXY)
Australian 2 year government bond yield
U.S. 2. 5, 10, 20 and 30 year government bond yields
German 2, 5 & 10 year government bond yields
French, U.K., Korean and Swedish 10 year government bond yields
TBT & TBX
AUD/GBP
EUR/GBP
Extremes “below” the Mean (at least 2.5 standard deviations)
U.S. 10 yes minus U.S. 5 year bond yield
AUD/USD
CAD/USD
Copenhagen and Helsinki equity bourses
Oversold (RSI < 30)
Tin
Hot Rolled Coil Steel (HRC)
EUR/USD
DKK/USD
JPY/USD
Taiwan’s TAIEX and H.K.’s Hang Seng equity indices
The Oversold Quinella – Both Overbought and Traded at > 2.5 standard deviations above the weekly mean)
GBP/USD
KRW/USD
NZD/USD
SEK/USD
SGD/AUD
IEF, IEI & TLT
Switzerland’s SMI equity index
Notes & Ideas:
The big news for the week is broad.
Government bond yields reached extreme peaks with all of the major U.S. durations doing so.
The CRB (commodities) Index fell 4%.
Equity bourse declined between 4% – 7%.
The fall in equities honoured the preceding weeks observation about Bearish Outside Reversals.
The S&P MidCap 400 and SmallCap 600 have fallen 11% in the past 2 weeks. I had warned that the markets were about to play a cruel trick on those who believed in the previous rally.
A couple bourses went into Oversold territory and TAEIX has done it for the 2nd time within 3 months.
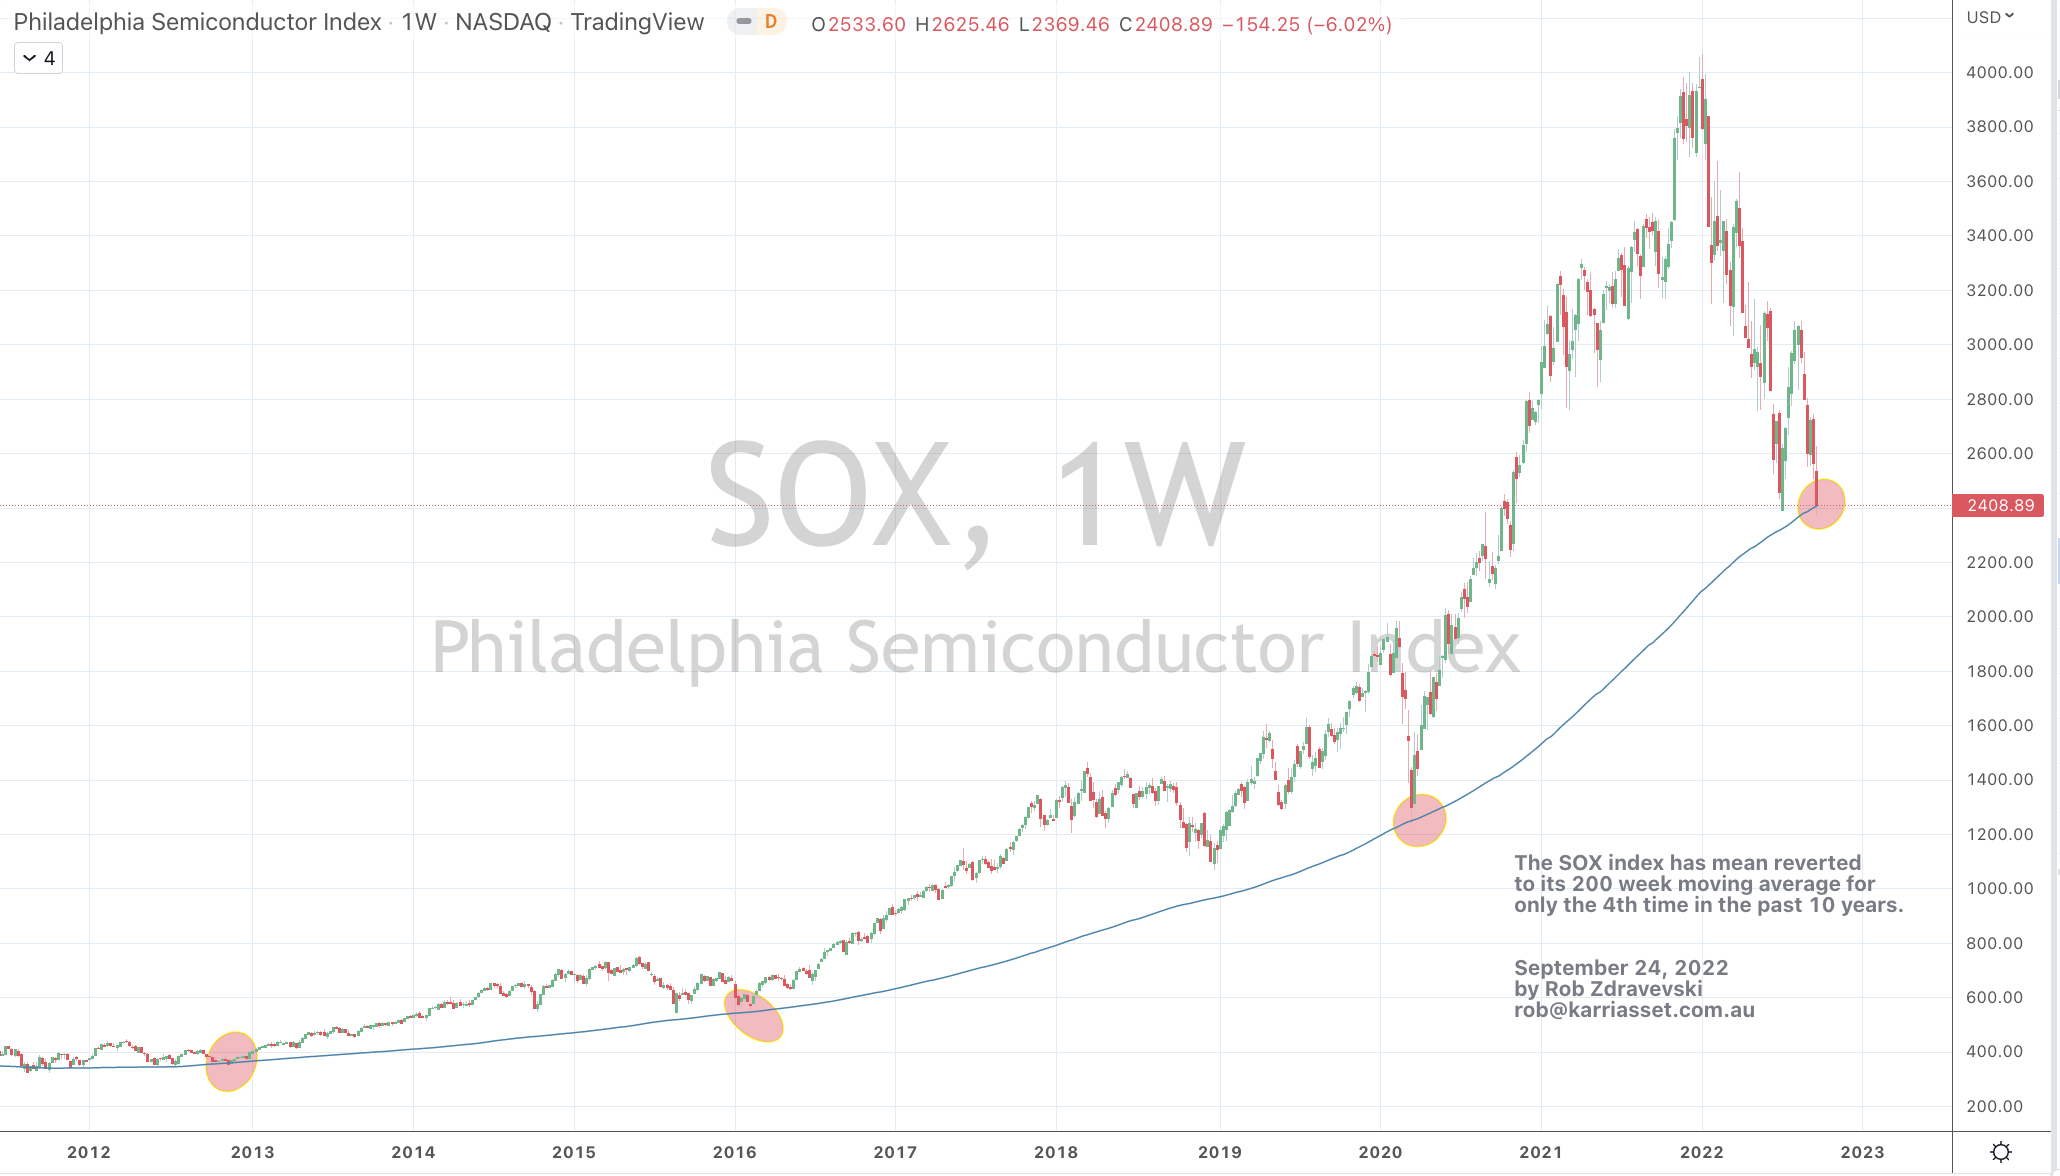
While many bourses complete their mean reversion to their 200 week moving average, such as Copenhagen, CAC, S&P Midcap 400, the SOX……the ASX 200 and Nasdaq Composite have double dipped to their 200 WMA.
The S&P 500 is 108 points (or 3%) away from visiting its 200 WMA. The Nasdaq 100 is 153 points or 1.4% above its 200 WMA. That’s something to watch for this coming week.
Chinese and H.K. indices continued to make lower lows with the Hang Seng (HSI) ‘going’ oversold.
Currencies continue to be in the news, in particular the strength of the U.S. Dollar and the corresponding weakness in others.
The Aussie divergence continues as cited in this post.
So, I’ll watch for how the AUD/USD and WTI Crude symbiotically test their next respective levels of 0.6464 and $77.50, as neither ‘daily’ downtrends are confirming continuing strength.
Hint: probability is rising that we are at the tail-end (+/- 3%-6%) of the downdraft in both assets.