Macro Extremes (week ending September 30, 2022)

The following assets (on a weekly timeframe) registered an Overbought or Oversold reading and/or have traded more than 2.5 standard deviations above or below its rolling mean.

Extremes “above” the Mean (at least 2.5 standard deviations)

Australian 2 year government bond yield

Swiss 10 year government bond yield

U.S. 10 year minus Australian 10 year bond yield spread

Overbought (RSI > 70)

U.S. 2 year government bond yield

The Overbought Quinella – Both Overbought and Traded at > 2.5 standard deviations above the weekly mean)

U.S. Dollar Index (DXY)

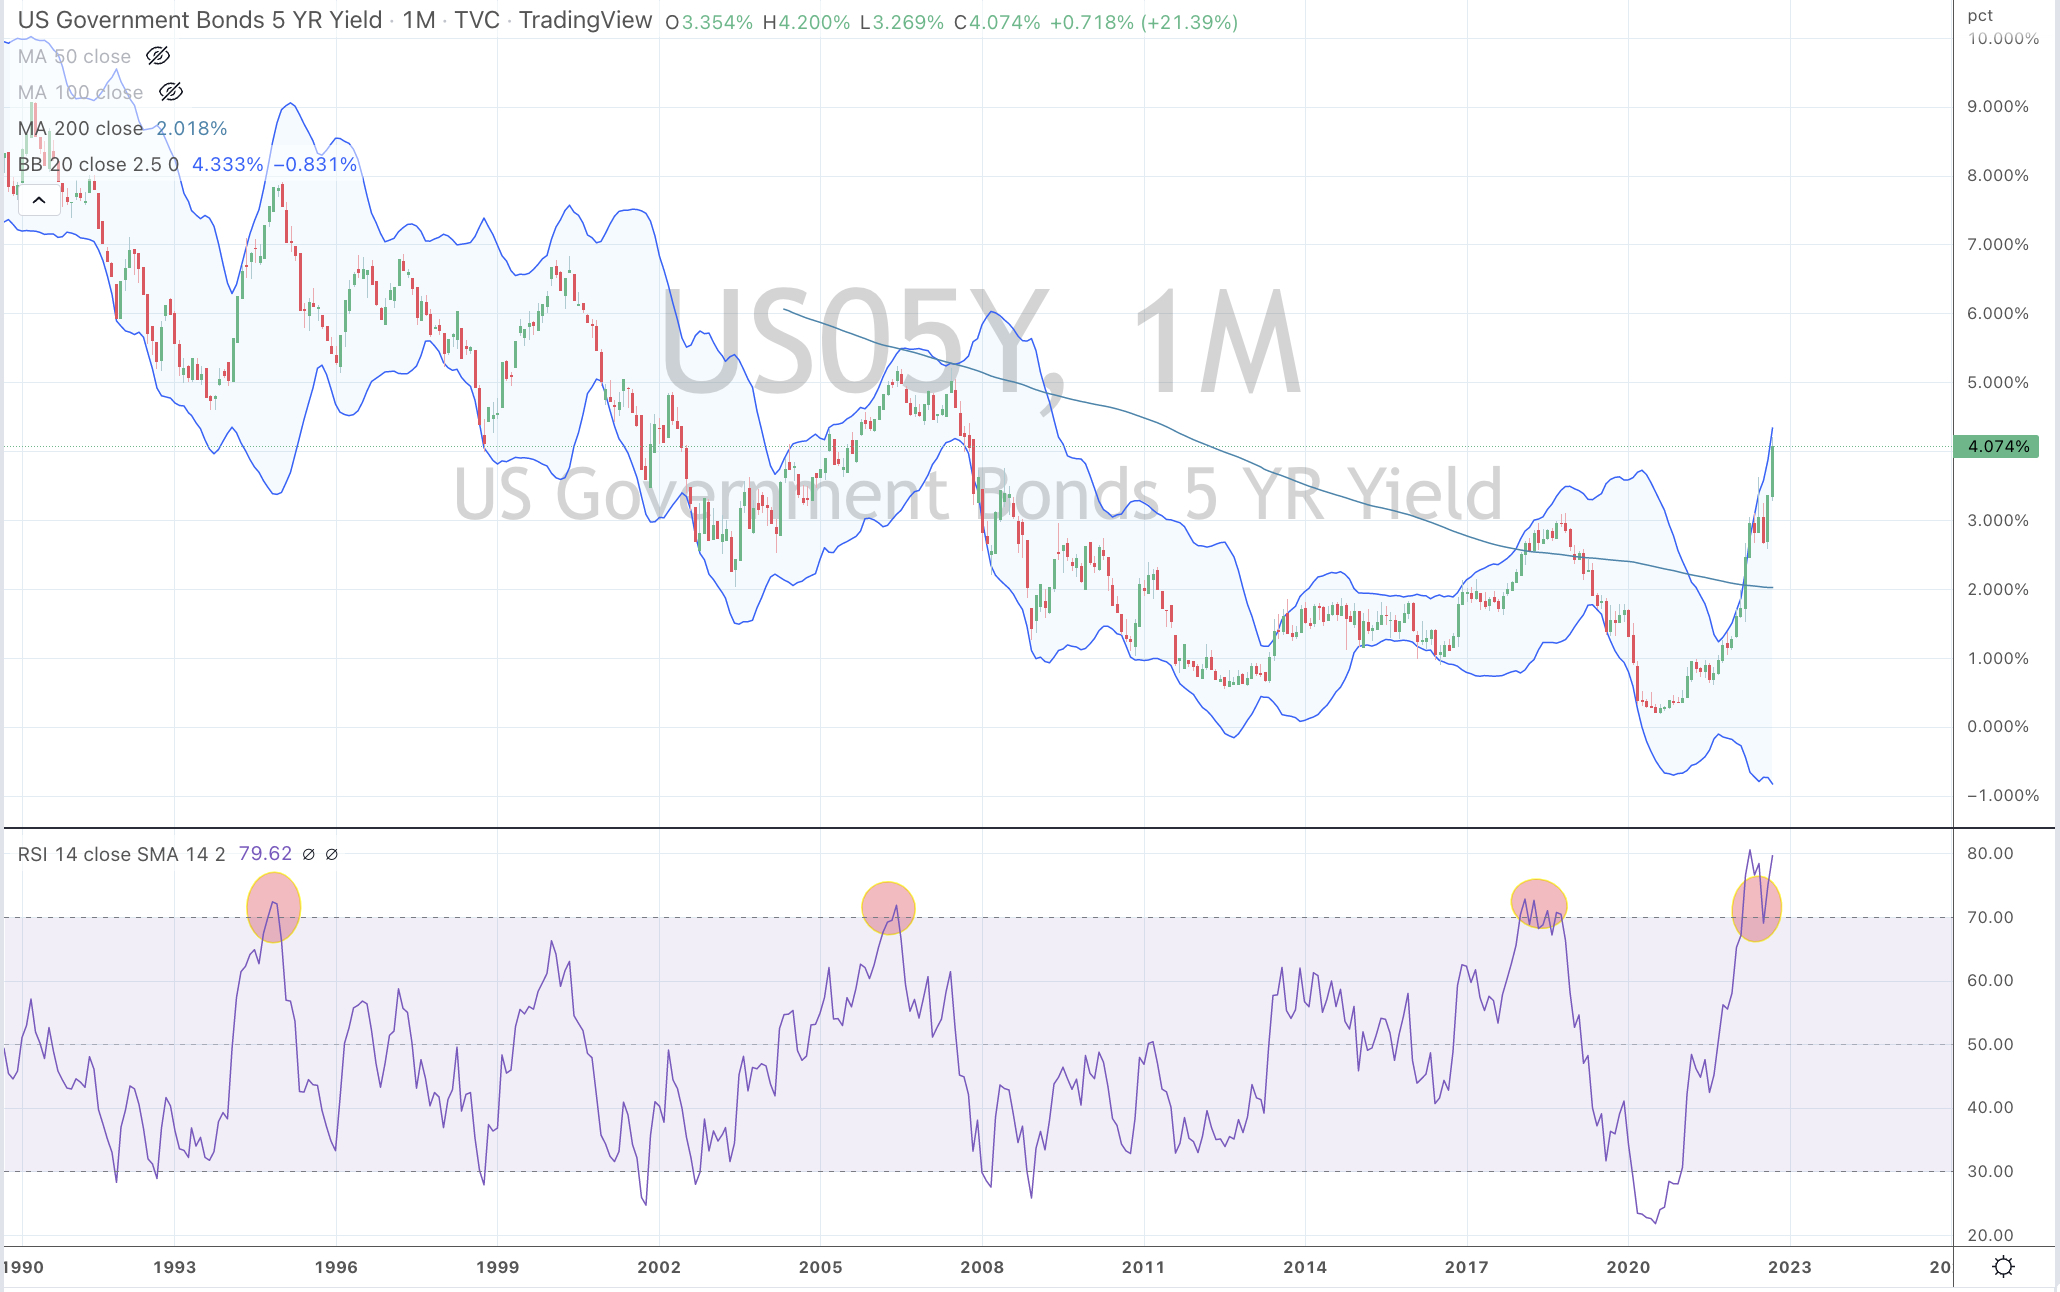
U.S. 5, 10, 20 and 30 year government bond yields

German 2, 5 & 10 year government bond yields

British 5 year government bond yields

Spanish, French, British, Greek, Italian, Korean, Portuguese and Swedish 10 year government bond yields

TBT & TBX

Extremes “below” the Mean (at least 2.5 standard deviations)

U.S. 10 year minus U.S. 5 year bond yield

Cocoa

AUD/USD

CAD/USD

SEK/USD

AUD/INR

AUD/SGD

Oslo, Copenhagen and Helsinki equity bourses

Spain’s IBEX

The FTSE 100 and the Swiss SMI equity indices

Oversold (RSI < 30)

Tin

Hot Rolled Coil Steel (HRC)

JPY/USD

KRW/USD

HSCEI

Taiwan’s TAIEX, South Korea’s KOSPI and the HSCEI equity indices

The Oversold Quinella – Both Overbought and Traded at > 2.5 standard deviations above the weekly mean)

CAD/USD

NZD/USD

SGD/USD

NZD/AUD

IEF, IEI & TLT

Notes & Ideas:

The big news for the week was the whipsawing action seen in the foreign exchange markets.

The British Pound bounced and made up nearly all of the weakness seen early in the week.

I write this note about the perspective and figures behind the move.

In that note, I highlighted that this week the AUD lost 3.1%, 4.7% and 1.9% versus the EUR, GBP and USD respectively. Along with the AUD/JPY, these currency crosses all appeared in the past week editions showing the AUD trading at ‘extremes’ to each of them.

Yet, we don’t hear the word crisis’ used when the Aussie tanks 5% against Sterling??

For additional comparison, this past week the FTSE 100 equities index fell 1.8% whilst the ASX 200 declined an almost equal 1.5%.

The Aussie stockmarket wasn’t labelled as being in crisis.

Perhaps, we can say, not all crises are same?

In equities, on a closing weekly basis, we mostly saw consolidating and benign moves especially amongst the Small and Mid Cap indices. 

However, intra-week also saw plenty of movement.

And we are now seeing some in Oversold territory again.

The larger losers for the week appear in the list below along with a host of idea generators.

We saw the S&P 500 mean revert to its 200 week moving average (WMA) for the first time since March 2020 and last week’s visitors to the 200 WMA stay around it, including the Nasdaq 100, CAC, Russell 2000 and U.S. small and mid caps.

The DAX, SOX and Dow Jones Industrials are nearing that mark, as are a few others

We also saw subdued moves in many other markets. The U.S. Dollar Index only fell 0.8% and the CRB Index snoozed at (0.07%).

All the larger moves (+/- 2%) for the week appear in the list below, which has featured the smallest amount of securities in some weeks.

The larger advancers over the past week comprised of; 

Australian Coking Coal 3.2%, Cocoa 4.8%, Gasoil 3.1%, Copper 2.1%, Heating Oil 4.1%, JKM KNG 3.1%, Orange Juice 4%, Palladium 54%, Dutch TTF Gas 1.8%, Silver in AUD 2.9%, Gold in AUD 3%, Wheat 4.7%, Nasdaq Biotech 2.1%.

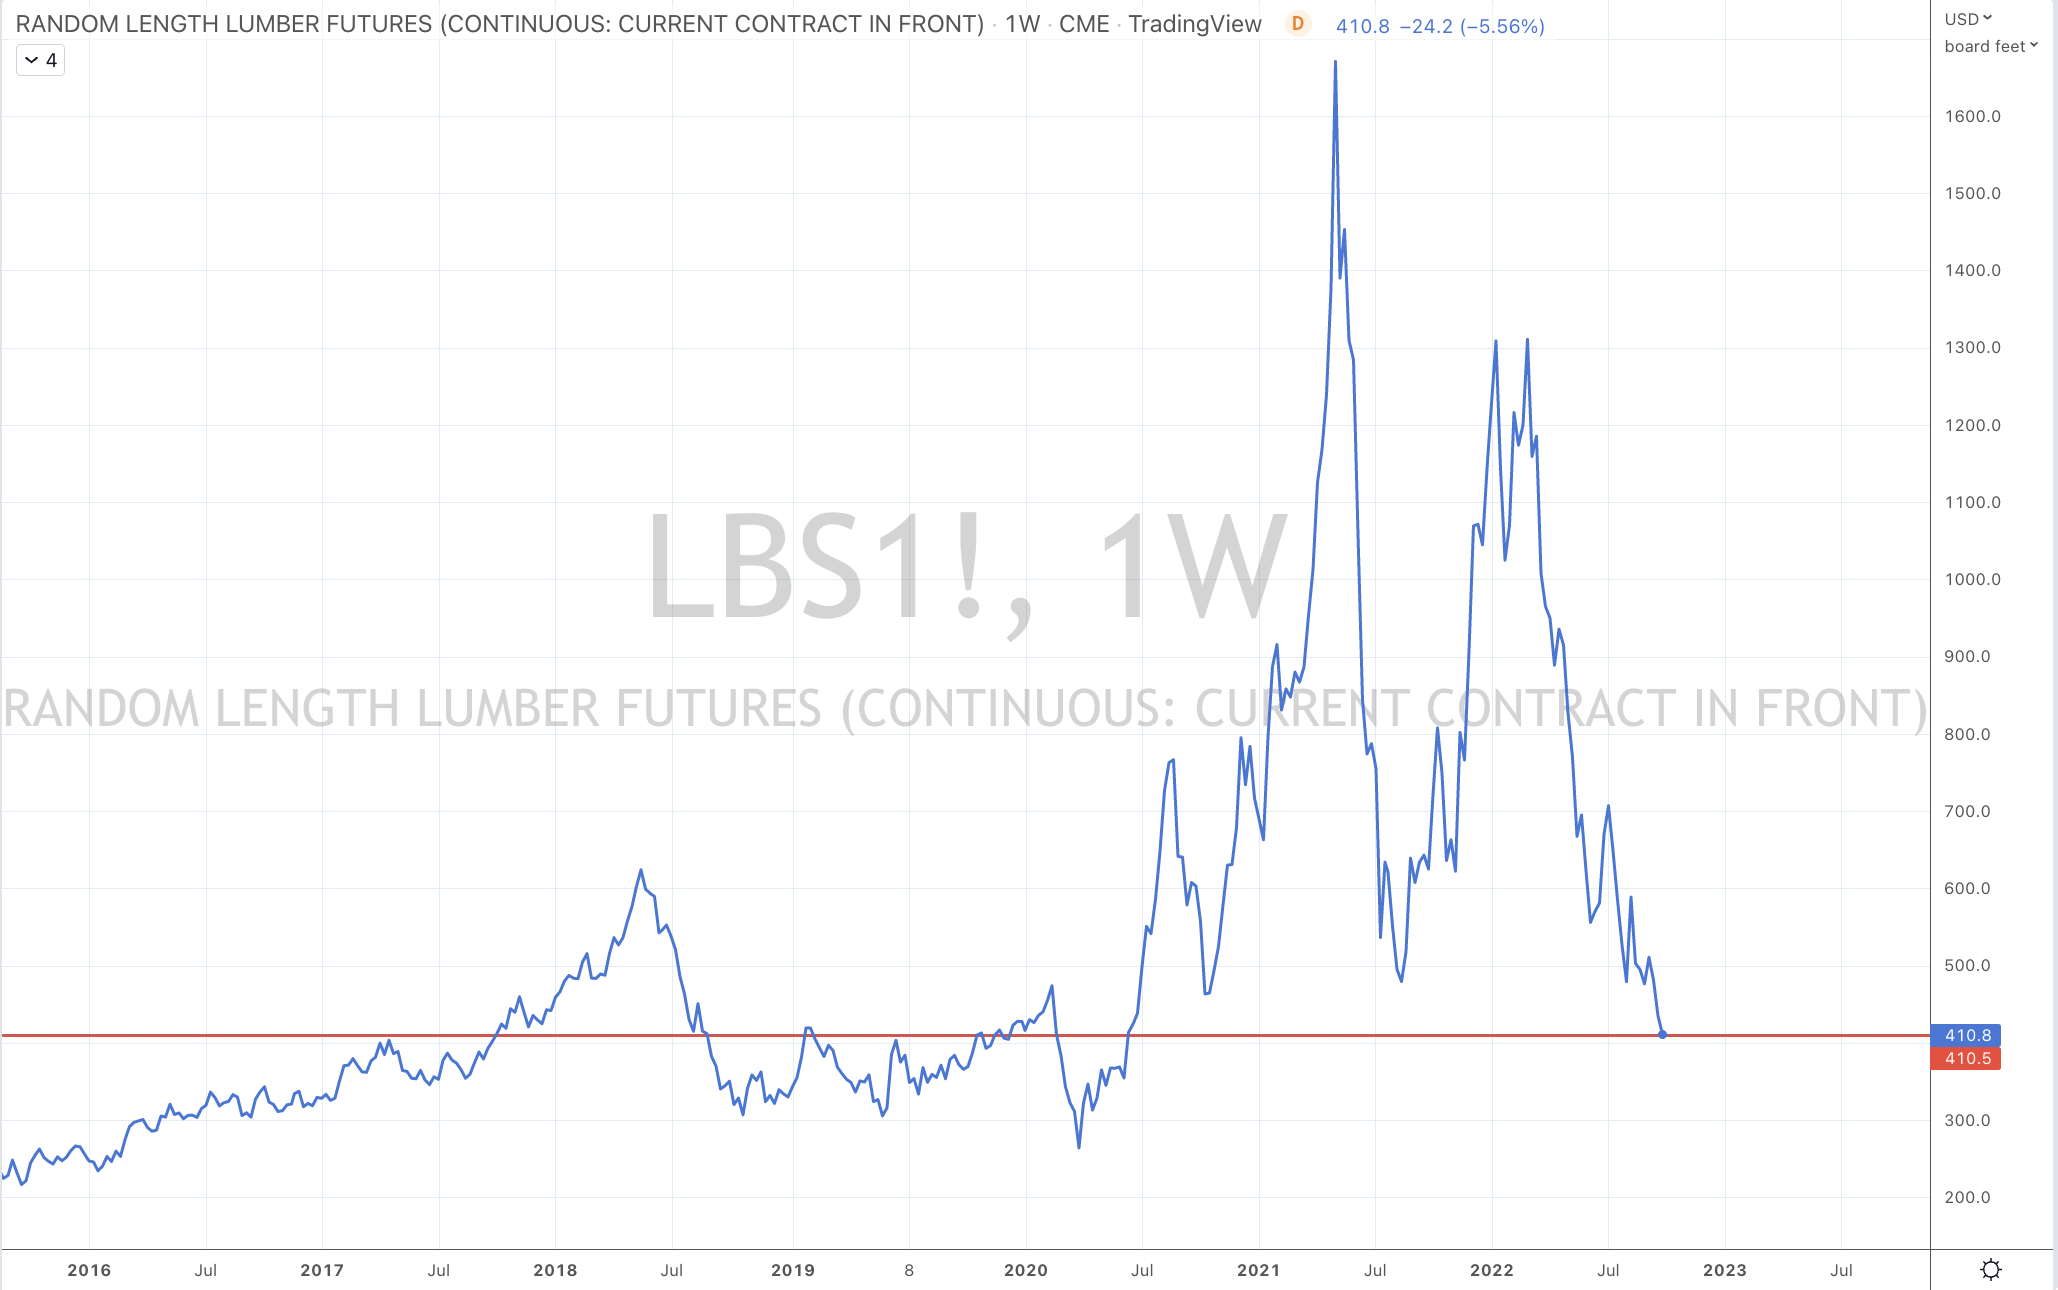
The group of decliners included;

Rotterdam Coal(3.5%), Baltic Dry Index (3.1%), China Coal (4.9%), Lean Hogs (3.7%), HRC (3.2%), Lumber (2.9%), Tin (2.3%), Nickel (6.5%), Sugar (3.3%), Cotton (7.8%), Florida Urea (6.1%), Brent Crude (1.6%), Middle East Urea (11.3%), Soybeans (4.3%), Shanghai Composite (2.1%), KBW Banks (3.1%), DJ Industrials (2.9%), MIB (2%), HSCEI (33%), HSI (4%), IBEX (2.9%), Nasdaq (3%), Nikkei (4.5%), SOX (4.2%), S&P 500 (2.9%), Strait Times (3%), TAIEX (4.9%), FTSE 100 (1.8%), Nasdaq Composite (2.7%) and Australia’s ASX 200 declined 1.5% for the week.

October 2, 2022

By Rob Zdravevski

rob@karriasset.com.au   

Putting the use of the word ‘crisis’ in context

Last Friday September 23rd, the British Pound started seeing accelerated weakness against various currencies and most prominently against the U.S. Dollar. The ‘noise’ of calling it a crisis continued on Monday September 26th.

Readers of the September 24th edition (last week’s) of ‘Macro Extremes’ would have seen the GBP was already featured in the Oversold section.

From its close of 1.1256 on Thursday September 22nd it has fallen to an intra-day low of 1.04. Albeit a 7.5% move within 2 days is worthy of note.

Today, the GBP/USD is almost back to its price seen (1.1168) on that Thursday. Quite a roundtrip but hardly a crisis and more appropriately a reminder to taking a look if prices were already at an extreme and understanding if this is a continuation of an existing downtrend or an exhaustive move which catches the ‘noise-worshippers’ out?

On the week, the GBP/USD rose 2.8%.

Yet….we don’t hear the word ‘crisis’ being bandied about.

Some FX traders have lost 6% in a week, shorting the British Pound against the USD, at its lowest ever level.

Cleverly, I hope there were many bought Sterling at Sterling at what was nearly a 4-sigma event.

The previous all-time low vs USD was 1.0545 seen in March 1985.

Inversely, this past week we saw the Australian Dollar fall 3.1% against the Euro, it sank 4.7% versus the British Pound, declined 1.9% compared to the USD and has fallen 5.2% against the Yen in the past 3 weeks.

Once again, perspective and context is advised.

October 2, 2022

by Rob Zdravevski

rob@karriasset.com.au

Balance Sheet adjustments

Cut your inventories and receivables numbers by 30%.

If you are analysing publicly listed balance sheets of companies selling ‘non-critical’ products, it may be advisable to lower the ‘current assets’ as seen in the past quarterly reports.

Many companies won’t receive their full quota of monies owed (receivables) nor the full price of their inventory on offer.

This also puts pressure on the cycle of honouring your payables.

Nike reports high inventories and coming discounting in their latest quarterly financial report.

Nike held 19% of its revenues as inventory.

Its total inventory last quarter was touching $9 billion.

This shouldn’t be a surprise but the market is acting as if it is.

Nike’s share price is trading 10% lower in today’s pre-opening market.

In May 2022, I painted a scenario of how falling demand results in higher inventories.

Through July 2022, I wrote, cited and warned of rising inventories and coming ‘discounting wars’. 

The markets were critical of Target and Wal-Mart’s inventory levels with the latter’s inventory ‘only’ touching 8% of its revenue.

September 30, 2022

by Rob Zdravevski

rob@karriasset.com.au

Newsletter – Preparing for the last decile

My latest newsletter has been published.

You can subscribe to this periodical by visiting for the current edition.

https://mailchi.mp/karriasset/preparing-for-the-last-decile-1

Stubbornness Kills

Whenever market observers write about their views, they often publish prices (targets, support lines, entry points) which reflect their predictions.

I do that too. 

I figure that the readers and myself need some reference or measuring point and there is also the sport of trying to ‘pick it’.

However, I anticipate moments in the coming months where my timing to deploy capital will revert to “NOW”

Swinging at a ball in a nice part of my strike zone is often better than ‘hoping’ for that perfect pitch.

Digging in my heels and waiting for that perfect price means my stubbornness will result in missing many investments opportunities or costing money.

Participating in the ‘fat part of the trade’ is an aim of mine 

I remind myself that getting the first and last 10% of any trade is quite difficult.

September 29, 2022
by Rob Zdravevski
rob@karriasset.com.au

Calling for a V or W may be upsetting

I think it’ll be difficult for many investors, managers and financial advisors to buy in the current downdraft and any approaching lows.

Buying discipline and all the ‘Buffett-esque’ euphemisms aside (be greedy when others are fearful etc)

I say this because markets and prices may trade sideways or continue to ‘digest’ recent declines.

In turn, this will bore people in terms of expected quick rewards and impatience.

I don’t think it is advisable to paint pictures about shapes.

Expecting bounces that resemble the letter ‘V’ or ‘U’ or ‘W’ may disappoint.

September 28, 2022

by Rob Zdravevski

rob@karriasset.com.au

The cratering in stock indices is afoot.

HSI and HSCEI today are doing so.

Opening gains in stocks are being given up as the past 2 days of trading is occurring.

Pessimism is growing amongst a host sentiment and survey indicators.

Really long term mean reversions are occurring or nearing.

Smaller investors seem jittery.

The AUD/USD is plunging. A visit to 0.6320 would be a 3 standard deviation event.

On September 9th, 2022, I wrote;

“I think prices will jump a little, drag in a few more people and then spit them out again in the coming week or three followed up with another swoon.”

And here we are…..

For a bit of sport, I think S&P 500 has a terrible day during Wednesday’s session and the Aussie market will give up its early gains then sink further on Thursday before traders swoop in and start buying 2 hours before Thursday close not before they dump the same stock into Friday’s close before their long weekend on the Australian east coast.

That’s the sort of market we have currently.

September 28, 2022

by Rob Zdravevski

rob@karriasset.com.au

Bonds are a Buy !

It’s important to keep things simple.

With all this palaver about interest rates, people want to hear what the action is.

How is one expressing their investing view about the topic?

Bond yields are so stretched, that on a monthly basis, they are ‘this’ Overbought for only the 4th time in 35 years (as expressed in the U.S. 5 year bond yield chart with those circles on it)

If you like fixed interest, then you may consider buying a Bond ETF which owns a spread of such bonds…..

because, inversely those bond prices are at extremely Oversold levels, as the Monthly chart below shows.

I have posted a chart of one of those U.S. traded bond ETF’s

This is the case across the 5, 10, 20 and 30 year maturities.

Disclaimer: not personal advice, do you own research or speak to a licensed professional.

September 27, 2022

by Rob Zdravevski

rob@karriasset.com.au

Update: Monthly U.S. Dollar Overbought

This chart updates the percentage which the DXY Index is trading above its 200 Month moving average.

Rare air indeed !

This may be the 7th inning, 8th or 9th….but it’s not the top of the 1st.

Incidentally, We are days away from closing the quarter and U.S. corporate earnings will be reported soon after. A reminder to look for management commentary in their earnings call about the effect the strong U.S. Dollar is having on their results.

The strong dollar is something the United States needs to be wary of because prolonged strength is adding to the probability of sustained inflation.

Commercial and military aircraft are costing the rest of the world let alone other U.S. goods and services.

More importantly, the majority of the major commodities are priced and traded in U.S. Dollars.

Rather than the Bank of Japan intervene and spend $21 billion (which is slightly more than the $15bn in U.S. aid sent to Ukraine) to buy and support their Yen…..

and rather than wait for the U.K. government or the Bank of England to crank up rescue packages to support the British Pound…

perhaps the U.S. Treasury (Janet Yellen) should start making announcements designed to weaken their currency?

Such action may possibly help your ‘friends’ in the G-10; help your own bond market (your cost of capital) and make the world a better place.

Keep in mind that a U.S. 10 year bond yielding 3.85% in isolation isn’t a concern until you ponder that the bonds of other nations are seemingly trading a ‘better creditworthiness’ of 3%.

But then again, the market may end up fixing it all for you.

September 27, 2022

by Rob Zdravevski

rob@karriasset.com.au

Inflation reports are a lagging indicator

Lumber prices have fallen 70%.

They are back to pre-pandemic pricing and the same as 2019 and 2018.

This is deflationary. These falling prices are seen amongst many other commodities.

I have written about Aluminium, Iron Ore, Copper, Hot Rolled Coil Steel, Natural Gas and Oil….all doing the same.

WTI Crude Oil was $120 only 3 months ago. It is now $78 per barrel.

Don’t be tricked into believing whatever pricing you are seeing or experiencing today is forever.

September 27, 2022

by Rob Zdravevski

rob@karriasset.com.au