A weekly Macro, Cross Asset review of prices trading at extremes which may generate future investment ideas and opportunities.
The following assets (on a weekly timeframe) registered an Overbought or Oversold reading and/or have traded more than 2.5 standard deviations above or below its rolling mean.
Extremes “above” the Mean (at least 2.5 standard deviations)
U.S. 2 year government bond yield
Australian Coking Coal
Overbought (RSI > 70)
German 2 year government bond yields
Cattle
Italy’s MIB, France’s CAC and Spain’s IBEX equity indices
The Overbought Quinella – Both Overbought and Traded at > 2.5 standard deviations above the weekly mean)
None
Extremes “below” the Mean (at least 2.5 standard deviations)
None
Oversold (RSI < 30)
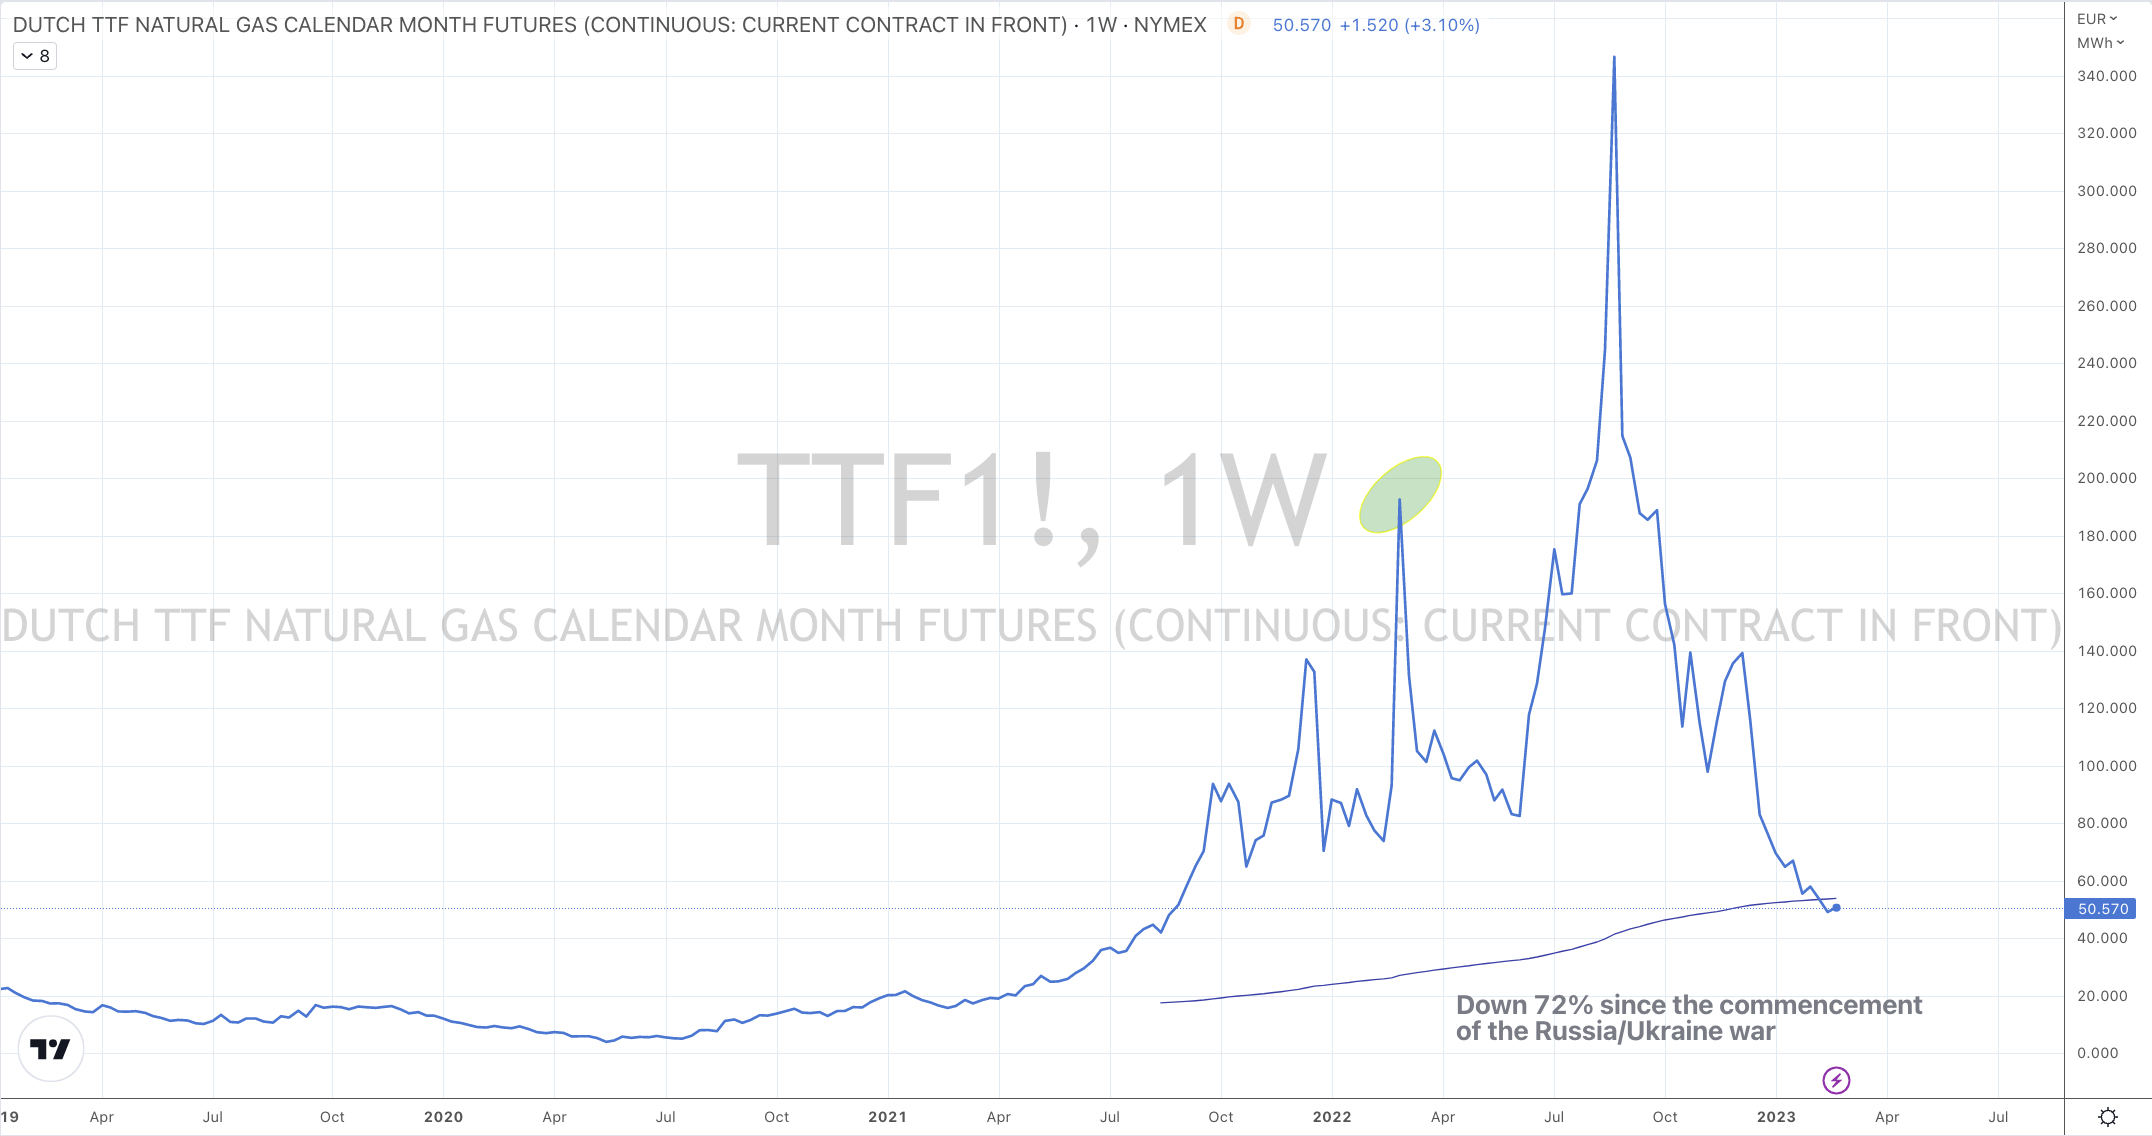
Natural Gas
Urea (U.S. Gulf)
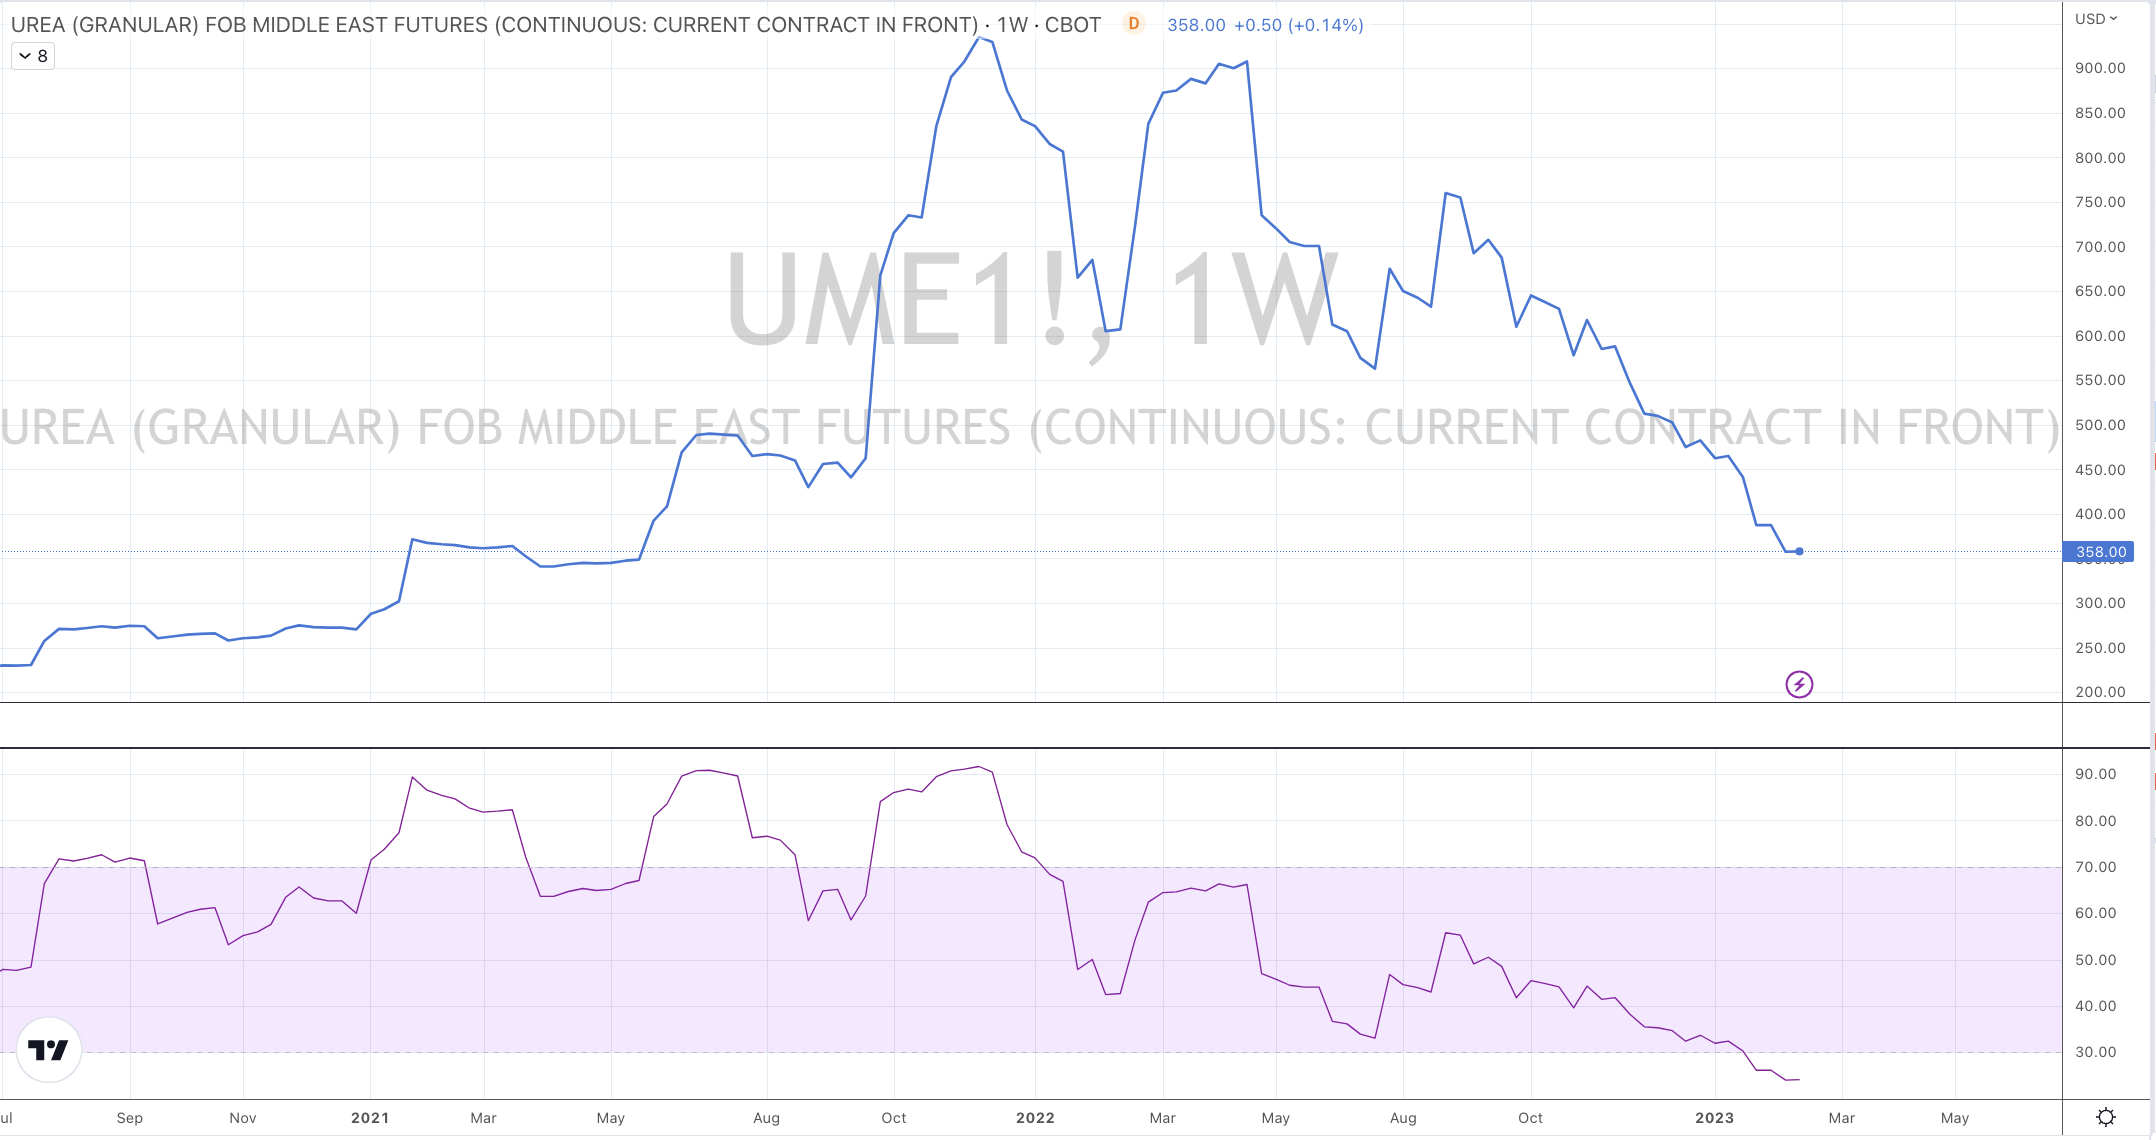
Urea (Middle East)
Baltic Dry Index
The Oversold Quinella – Both Overbought and Traded at > 2.5 standard deviations above the weekly mean)
None
Notes & Ideas:
This past week seemed to appear as some consolidation and digestion was taking place while I think we saw some “rotation” also occur.
Equities had a quiet week. Some western European indices were amongst the better performers as the started entering Overbought extremes. That’s something for tactical ETF allocators to take note of.
The Nasdaq isn’t overbought anymore and just as media stories jump on the Chinese equities bandwagon, the HSCEI has fallen 10% in the past 3 weeks. Such a decline in western markets would spook many.
But that matters little since the HSCEI has risen 50% from its Oversold Extremes seen in October 2022.
Amongst bonds, yields generally rose. The U.S. 2 year closed at its highest level since October 31, 2022.
The Australian yield curve is the lowest since March 2020.
Something else to watch is the possible change in trend (downward) in the U.S. 10 year minus Australian 10 year yield spread. It has a healthy correlation with the S&P 500.
The U.S. 5 year yield minus U.S. 3 month bill yield spread is no longer Oversold.
I’m also watching BAML 5-7 year corporate bond yield, the U.S. 5 year breakeven and the ‘real return’ of the 5 year minus 5 year breakeven yield.
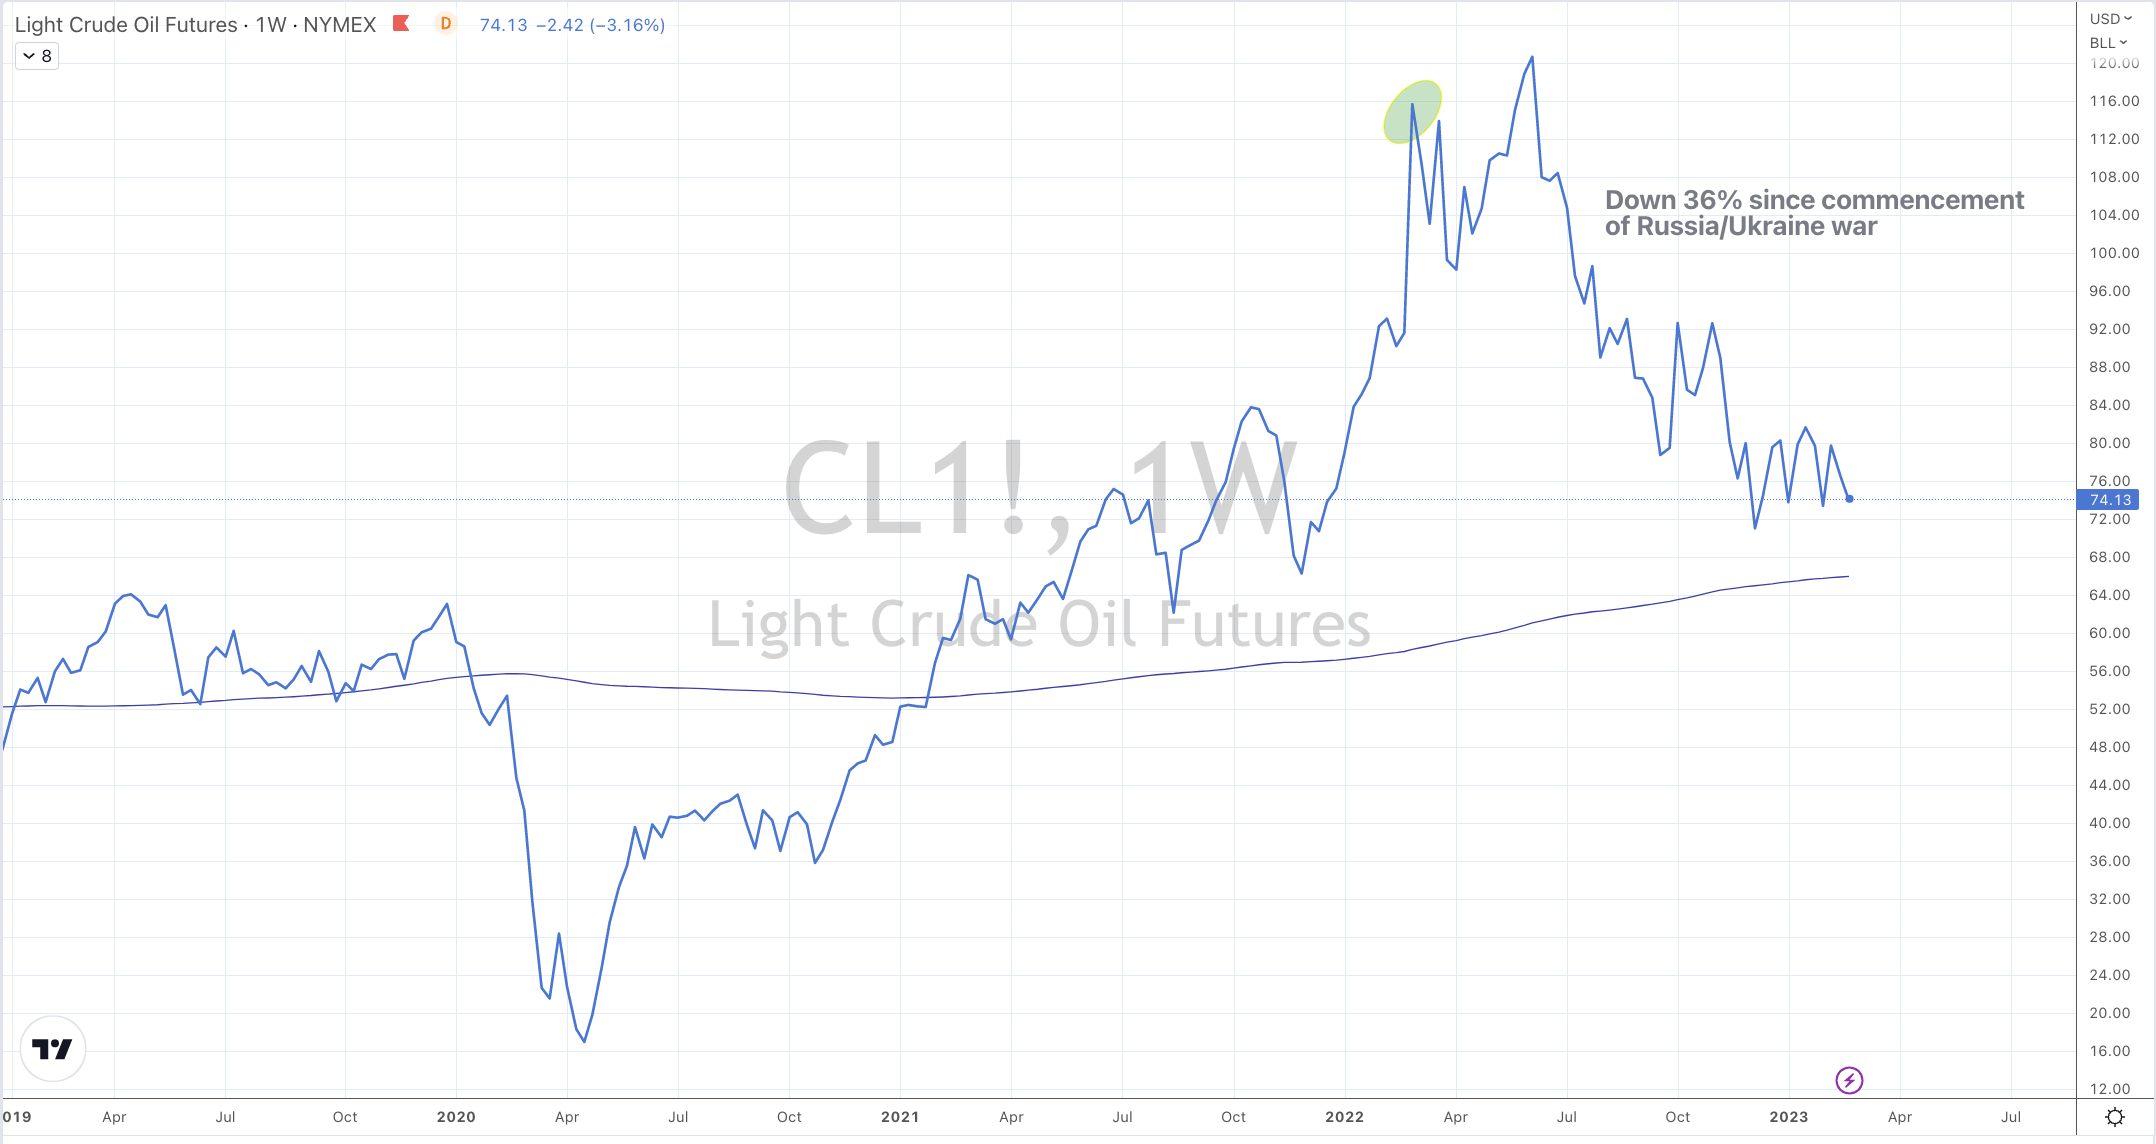
In commodities, we generally saw softs rise and hards fall. Energy was weaker.
Urea broke its 9 losing weeks by rising 0.4% for the week.
Palladium and Platinum prices have fallen 18% and 17% respectively over the past 6 weeks.
Cattle is Overbought for the 19th consecutive week.
Orange Juice isn’t Overbought anymore, Cotton had a bearish outside week while Silver and Platinum are in the midst of 5 and 6 consecutive losing weekly streaks, respectively.
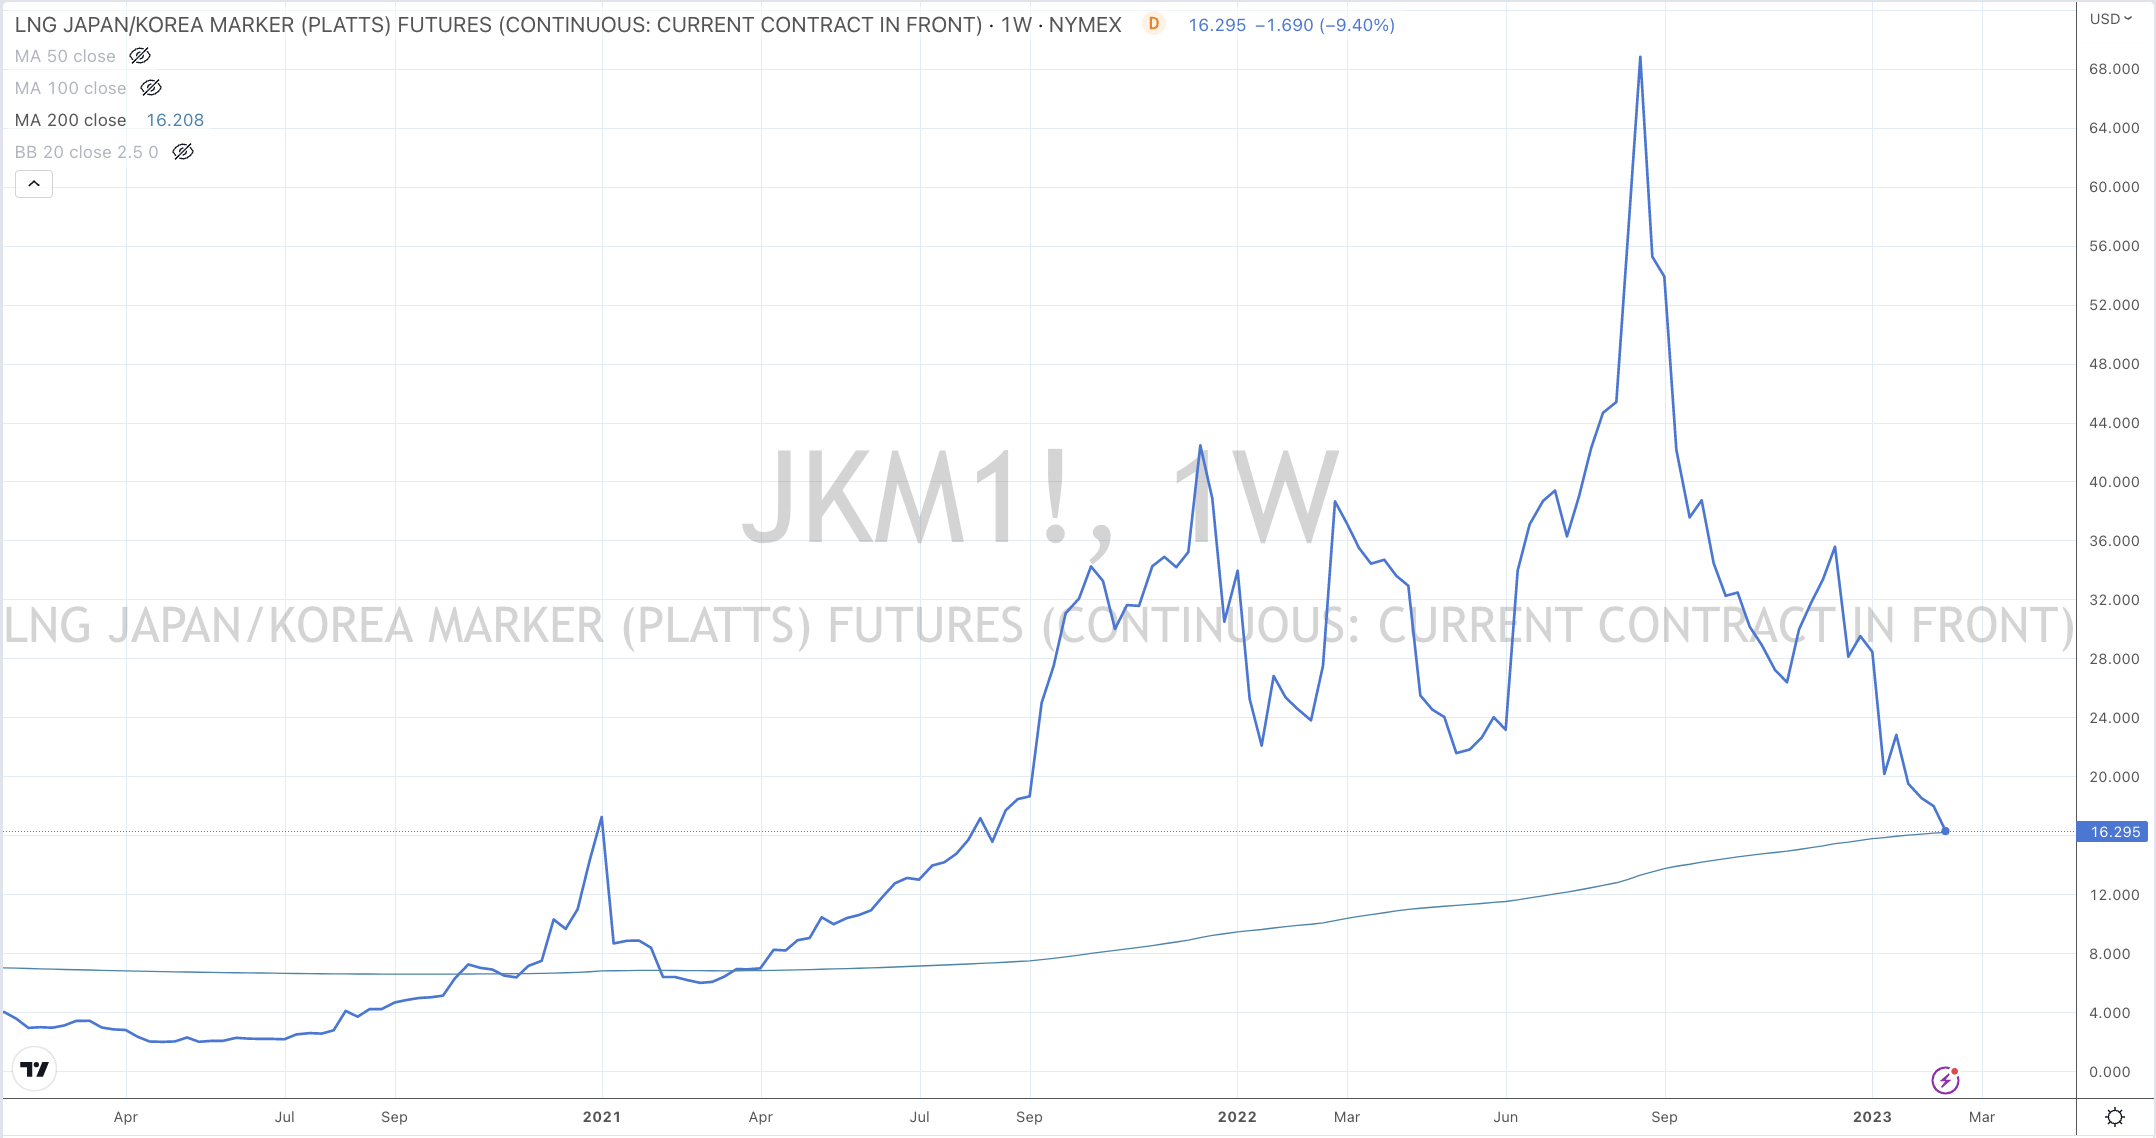
The Japan Korea LNG Marker (JKM) touched its lowest price since August 30th, 2021 and mean reverted back to its 200 week moving average.
Shipping Rates weakened further with the Baltic Dry Index notching up a 8 week losing streak.
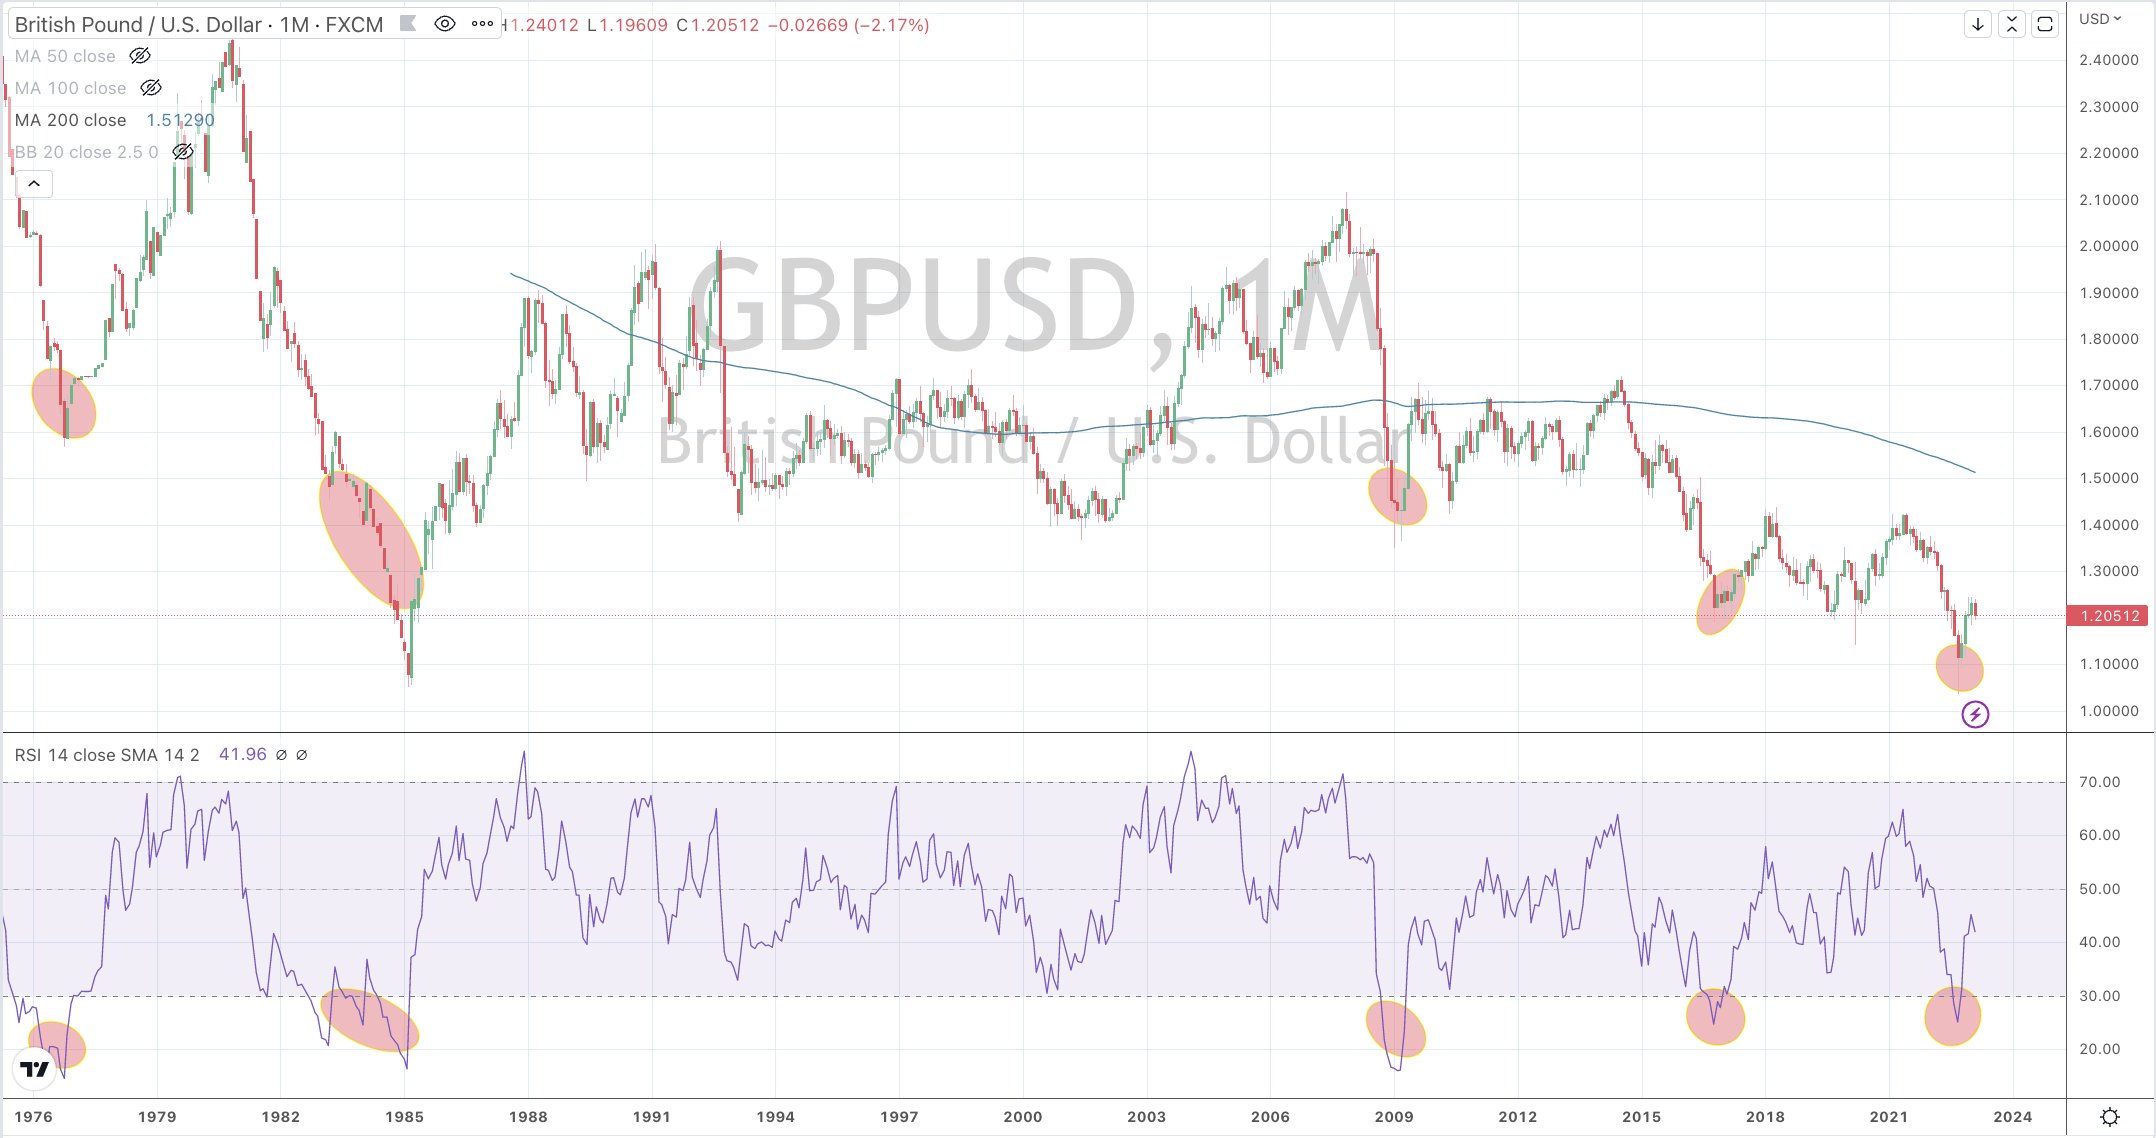
In currencies, had another boring and benign week. Generally, the AUD was lower against many while the USD was slightly firmer. The CAD/USD had an outside bearish week though.
The larger advancers over the past week comprised of;
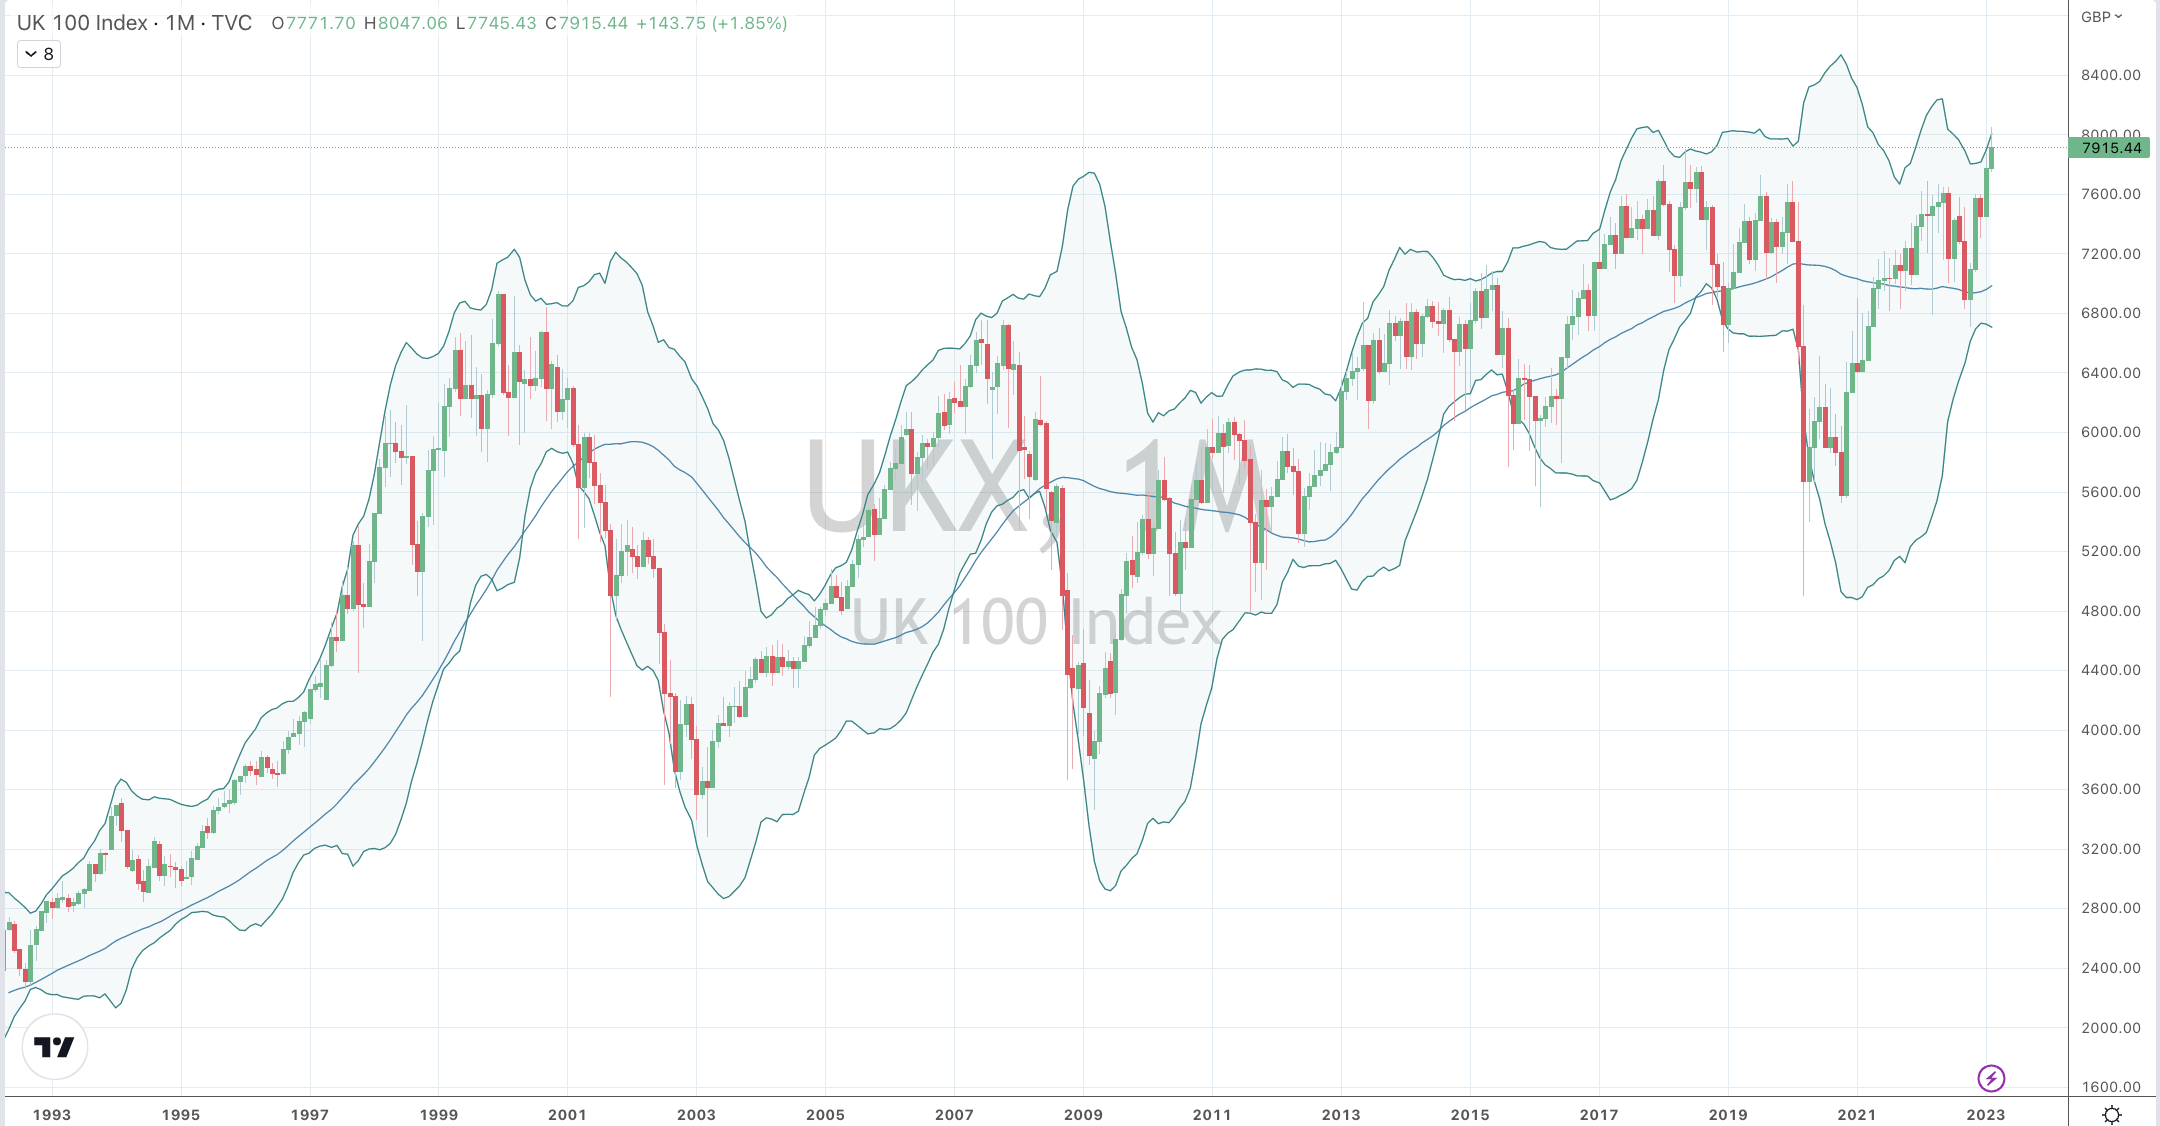
Australian Coking Coal 2.2%, Rotterdam Coal 3.4%, Cocoa 6.3%, Lean Hogs 12.4%, Copper 2.3%, Copper/Gold Ratio 3.6%, Coffee 6.4%, Uranium 2.5%, AEX 1.7%, CAC 3.1%, MIB 1.7%, IBEX 2.4%, Stockholm 2.2%, FTSE 100 1.6%, Istanbul 7.2%, Mexico 2.5% and Argentina’s MERVAL rose 5.1% (it’s up 20% over the past 5 weeks)
The group of decliners included;
Aluminium (3.5%), Bloomberg Commodity Index (2%), Baltic Dry Index (10.6%), WTI Crude Oil (4%), Gasoil (5.3%), Heating Oil (5.3%), JKM (11.5%), Lumber (3.4%), Tin (3%), Natural Gas (9.5%), Nickel (4.7%), Orange Juice (4.9%), Palladium (2.1%), Platinum (3.2%), Gasoline (3.8%), CRB Index (1.9%), Cotton (4.4%), Dutch TTF Gas (9.1%), Brent Crude Oil (4%), Oats (3.5%), CSI 300 (1.8%), HSCEI (1.9%) and Hong Kong’s HSI fell 2.2%.
For reference, the S&P 500 fell 0.3%, the DJ Industrials eased 0.2%, the Nasdaq Composite rose 0.6%, the S&P MidCap and SmallCap hovered around gains of 1.4%, Toronto’s TSX fell 0.5%, the ASX 200 declined 1.2% and the ASX Small Caps were unchanged at 0.1%.
February 19, 2023
by Rob Zdravevski
rob@karriasset.com.au