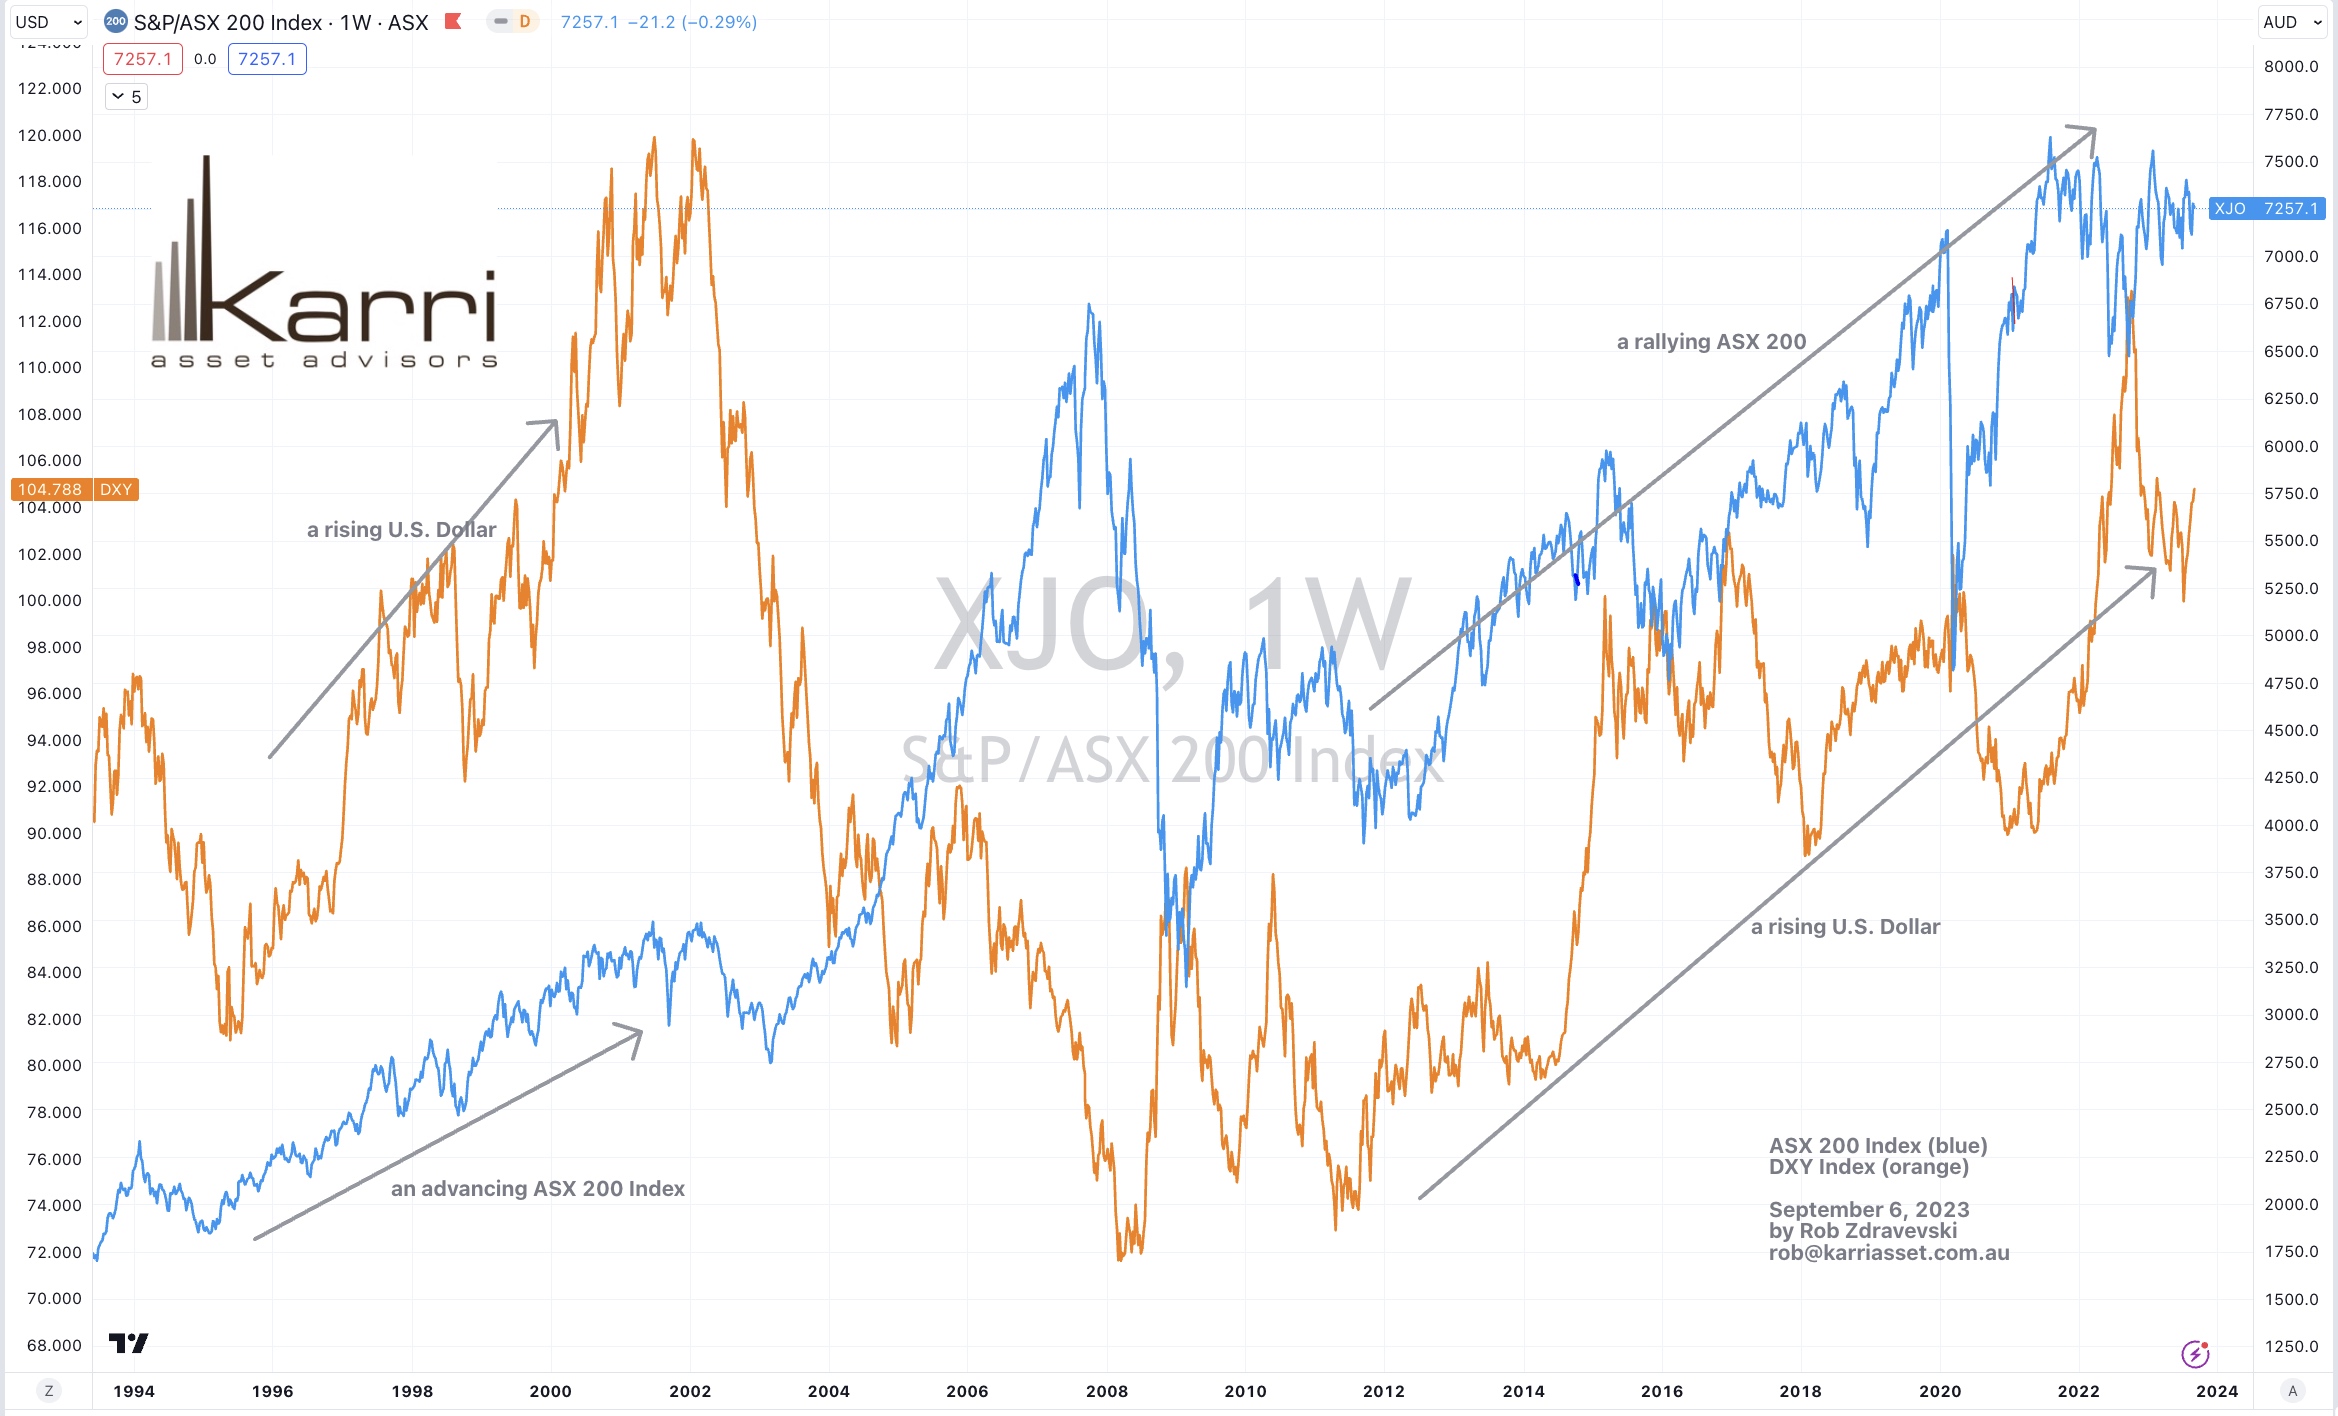
Mirages & Correlations

I love a good correlation.

Not to be confused with a chlorination nor a coronation.

Putting any dyslexia aside……

correlations should not be used in isolation when forecasting asset prices and sometimes a correlation doesn’t always exist.

Whilst the ASX 200 carries notable weightings in commodity related companies, it doesn’t automatically relate to a correlation with the inverse travel in the U.S. Dollar.

(it is common logic that a declining USD translates into higher commodity prices)

The study below shows that the ASX 200 can rally while the U.S. Dollar is also rising.

Beyond the other companies of meaningful market capitalisation within the ASX 200, factors such as a weaker AUD can be a positive for the earnings of the commodity related stocks.

September 6, 2023

by Rob Zdravevski

rob@karriasset.com.au

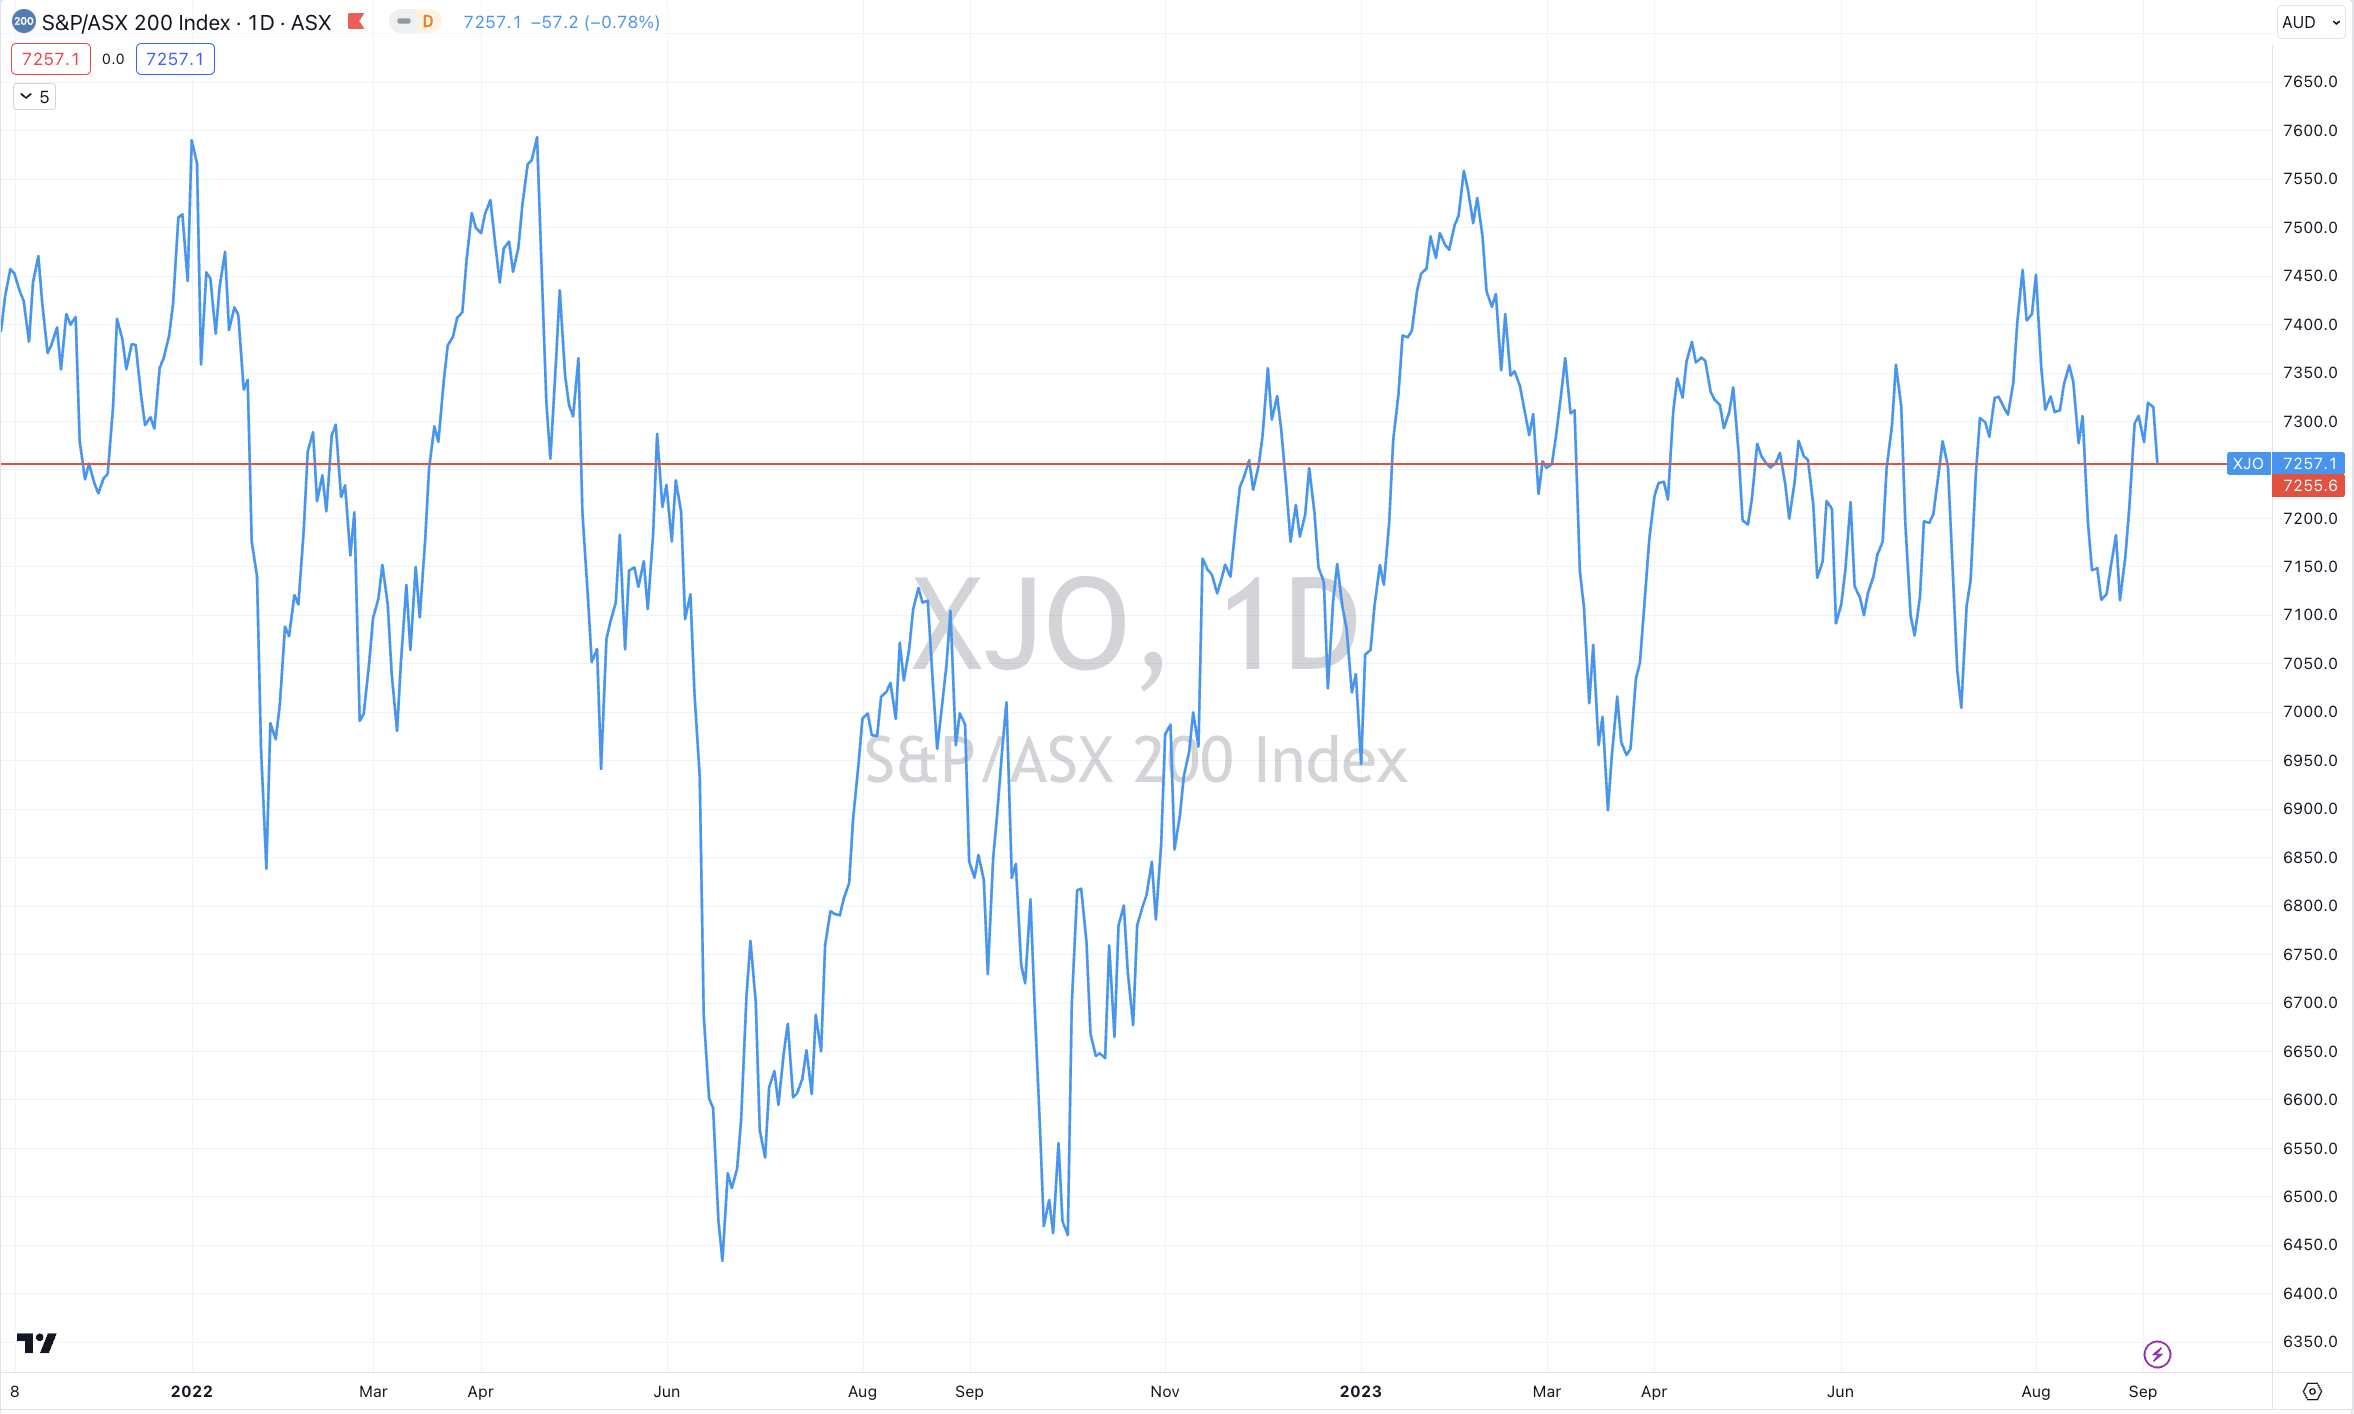
ASX 200 – boring, sideways travel until now?

The ASX 200 equity index is not any higher than 3 months ago.

On May 25, 2023, I wrote a note forecasting ‘weakness’ in the ASX 200.

For 2 months since then, we saw general weakness.

In fact, todays’ price is the same price as seen in May ’23, March ’23, December ’22 and May 2022.

The past 15 months or so will surely disappoint those passive ETF indexers who can’t ‘read the tape’ or don’t believe in timing entry and exits.

But today, there are early develops in a new upward trend for the ASX 200.

September 6, 2023

by Rob Zdravevski

rob@karriasset.com.au

When the U.S. Dollar was king….

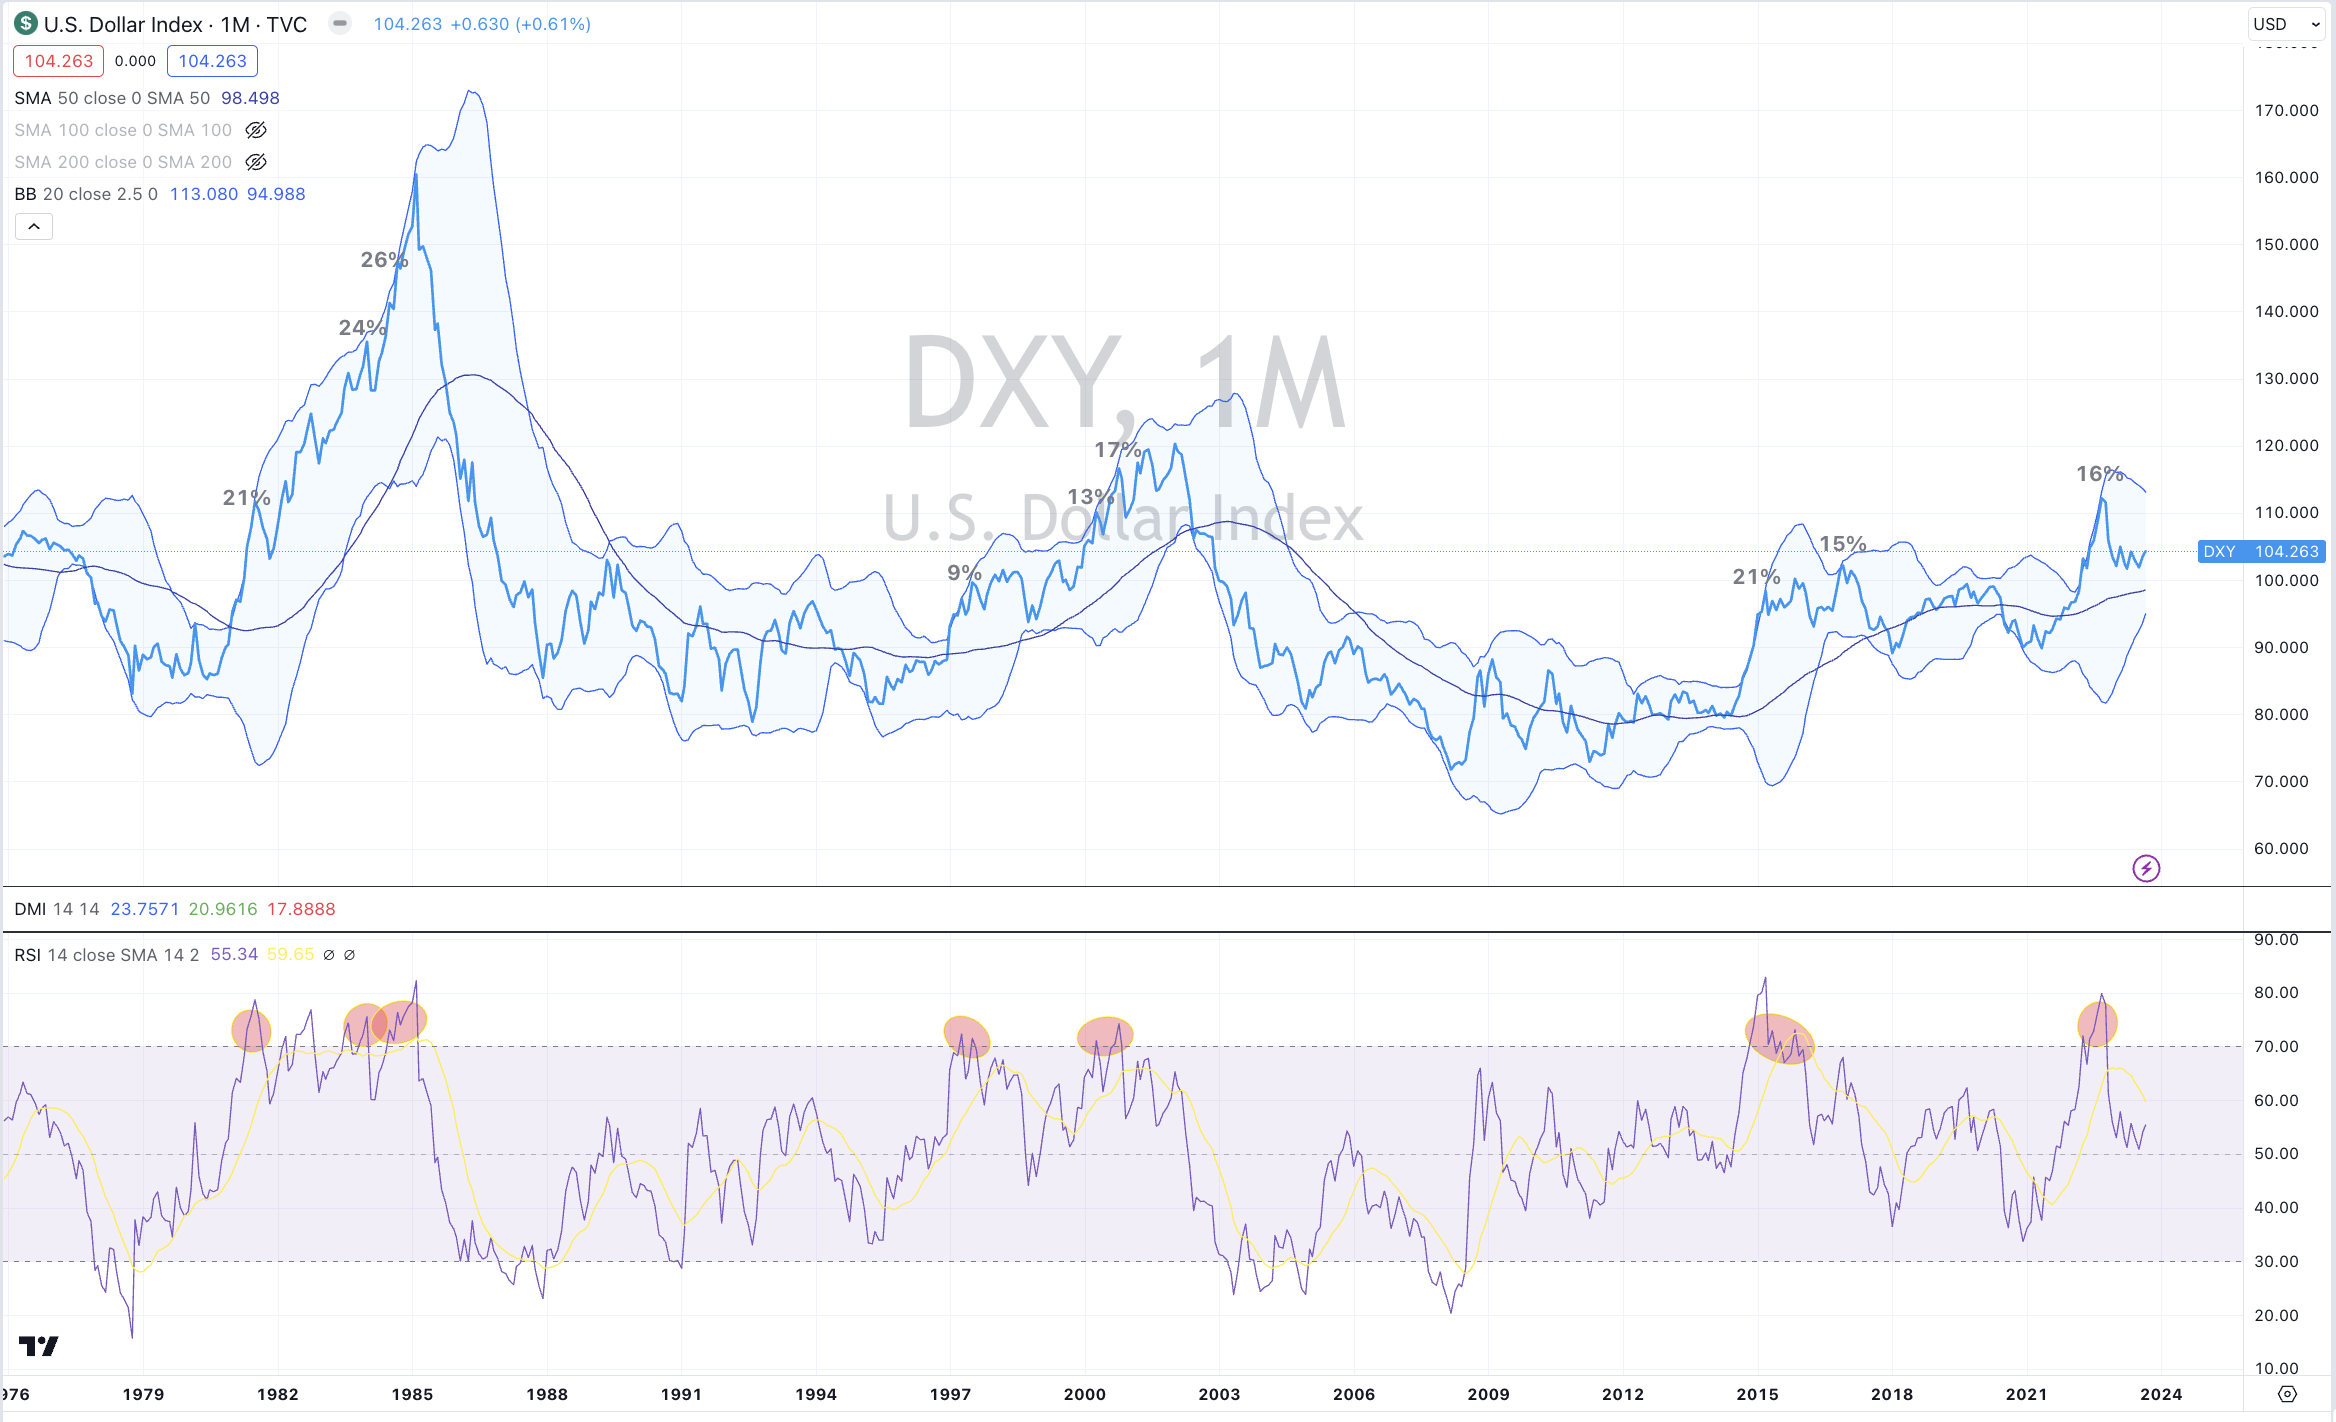
One year ago, I wrote a note when the U.S. Dollar Index (DXY) was at an overbought ‘extreme’.

The chart below reflects on that moment and those previous.

There have been 7 such times over the past 50 years.

Separately, this occurrence also has correlations to commodity prices and other assets.

The study below shows the percentages that the DXY Index was trading above its 50 month moving average whilst also registering a monthly overbought reading along and when the price was also 2.5 standard deviations above its rolling monthly mean.

And at various points in the past year or so, we still heard pundits calling for the demise of the U.S. Dollar.

September 4, 2023

by Rob Zdravevski

rob@karriasset.com.au

Macro Extremes (week ending September 1, 2023)

A weekly Macro, Cross Asset review of prices trading at extremes which may generate future investment ideas and opportunities.

The following assets (on a weekly timeframe) either registered an Overbought or Oversold reading and/or have traded more than 2.5 standard deviations above or below its rolling mean.

Extremes “above” the Mean (at least 2.5 standard deviations)

Rubber

Overbought (RSI > 70)

U.S. 3 month bill yields

Russian 10 year bond yields 

Cocoa

MOEX

And Turkiye’s BIST 100

The Overbought Quinella – Both Overbought and Traded at > 2.5 standard deviations above the weekly mean)

Uranium

Extremes “below” the Mean (at least 2.5 standard deviations)

None

Oversold (RSI < 30)

U.S. Mid West Hot Rolled Coil Steel

The Oversold Quinella – Both Oversold and Traded at < 2.5 standard deviations below the weekly mean)

Lithium

Notes & Ideas:

The government bond yields which appeared in the overbought list last week are no longer there as yields fell everywhere.

Chinese 10 year bond yields were the exception, for they rose and moved out of Oversold territory.

More interestingly, the U.S. 2 year bond yield posted an outside bearish reversal week.

All Equity indices were higher this week with many of them posting gains somewhere between1.4% to 1.6%, while the lost below features the over-achievers.

Copenhagen and Chile were the only two markets to decline for the week with the latter in a 5 week losing streak.

Last week’s losers (Chinese and U.S. banks) are this amongst this week’s winners and the Shanghai Composite & Hang Seng aren’t oversold this week.

While the Nasdaq Composite has climbed 5.5% over the past fortnight.

Commodities were mixed although rising metals and oil prices tipped the scales into the positive for the broader indices.

Amongst the energy sector, we saw Crude Oil, Gas and Coal prices rise while Gasoline, Distillates and Heating Oil fell. The latter giving up all of last weeks gain.

Over the past 2 weeks, Sugar, Aluminium, Platinum have risen 9%, 7% and 6% respectively, while Wheat has fallen 7% over the same time.

LNG and Oats aren’t overbought this week although Rubber entered this region for the first time in 16 months following its 16% rise over the past 3 weeks.

Uranium and Australian Coking Coal are in 8 week winning streaks. Iron Ore’s rising streak completes its 5th week while Heating Oil broke its 9 week consecutive climb.

Inversely, Lithium Hydroxide prices are in a 9 week losing streak while Middle East Urea prices have fallen for 5 consecutive weeks.

Cocoa is overbought again amidst a stellar 60% advance since late September 2022.

And U.S. Midwest Hot Rolled Coil Steel prices fell 10% and are now Oversold.

In currencies, the AUD rose and broke various declining streaks include that against the USD.

In turn, the USD was generally higher, seeing the DXY Index extend a 7 week winning streak.

The same streak exists in the USD/DKK with the exception of the USD/CAD which broke its 5 week winning run. 

CHF/AUD which featured in recent posts isn’t overbought this week.

Overall, the EUR weakened. Specifically, the EUR/USD pair is in a 7 week losing streak now trading at 1.07. Before this move, it was 1.12.

The GBP was flat while the JPY/GBP moved out of Oversold territory.

The larger advancers over the past week comprised of;

Australian Coking Coal 6%, Aluminium 4.7%, Cocoa 4%, China Coking Coal 5.8%, WTI Crude 7.5%, Cotton 3%, Iron Ore 1.8%, Lean Hogs 4.3%, Copper 2.3%, Newcastle Coal 14.7%, Natural Gas 8.9%, Platinum 2.2%, Sugar 4%, S&P GSCI 2.4%, Rubber 3.5%, CRB Index 2.2%, Dutch TTF Gas 2.4%, Brent Crude 5.7%, Uranium 3.9%, Corn 2.3%, Rice 3.3%, Shanghai 2.3%, CSI 300 2.2%, AEX 1.7%, KBW Bank Index 2.9%, DJ Industrials 1.6%, HSCEI 2.5%, Hang Seng 2.4%, Bovespa 1.8%, MOEX 2.3%, Nasdaq Composite 3.3%, Kospi 1.8%, S&P 500 2.5%, TSX 3.6%, ASX 200 2.3%, KRE Regional Banks 4.6%, S&P SmallCap 600 3.5%, BIST 4.4%, FTSE 250 2.2%, ASX Materials 3.2%, ASX Industrials 2%, S&P MidCap 400 3.6%, Nasdaq 100 3.7%, Nikkei 225 3.4%, Oslo 2.8%, Helsinki 3.7%, Stockholm 1.8%, Russell 3.6% and the Philadelphia Semiconductor (SOX) Index soared 5.4%.

The group of decliners included;

Rotterdam Coal (4.7%), Gasohol (2.8%), Heating Oil (5.8%), Hot Rolled Coil Steel (10.6%), Lumber 2.4%, LNG in Yen (6%), Lithium (146%), Tin (3.1%), Gasoline (2%), Urea U.S. Gulf (6.2%), Urea Middle East (9.9%), Oats (2.9%) and Wheat fell 4.2%.

September 3, 2023

by Rob Zdravevski

rob@karriasset.com.au
Spanish yields tell me inflation will bounce

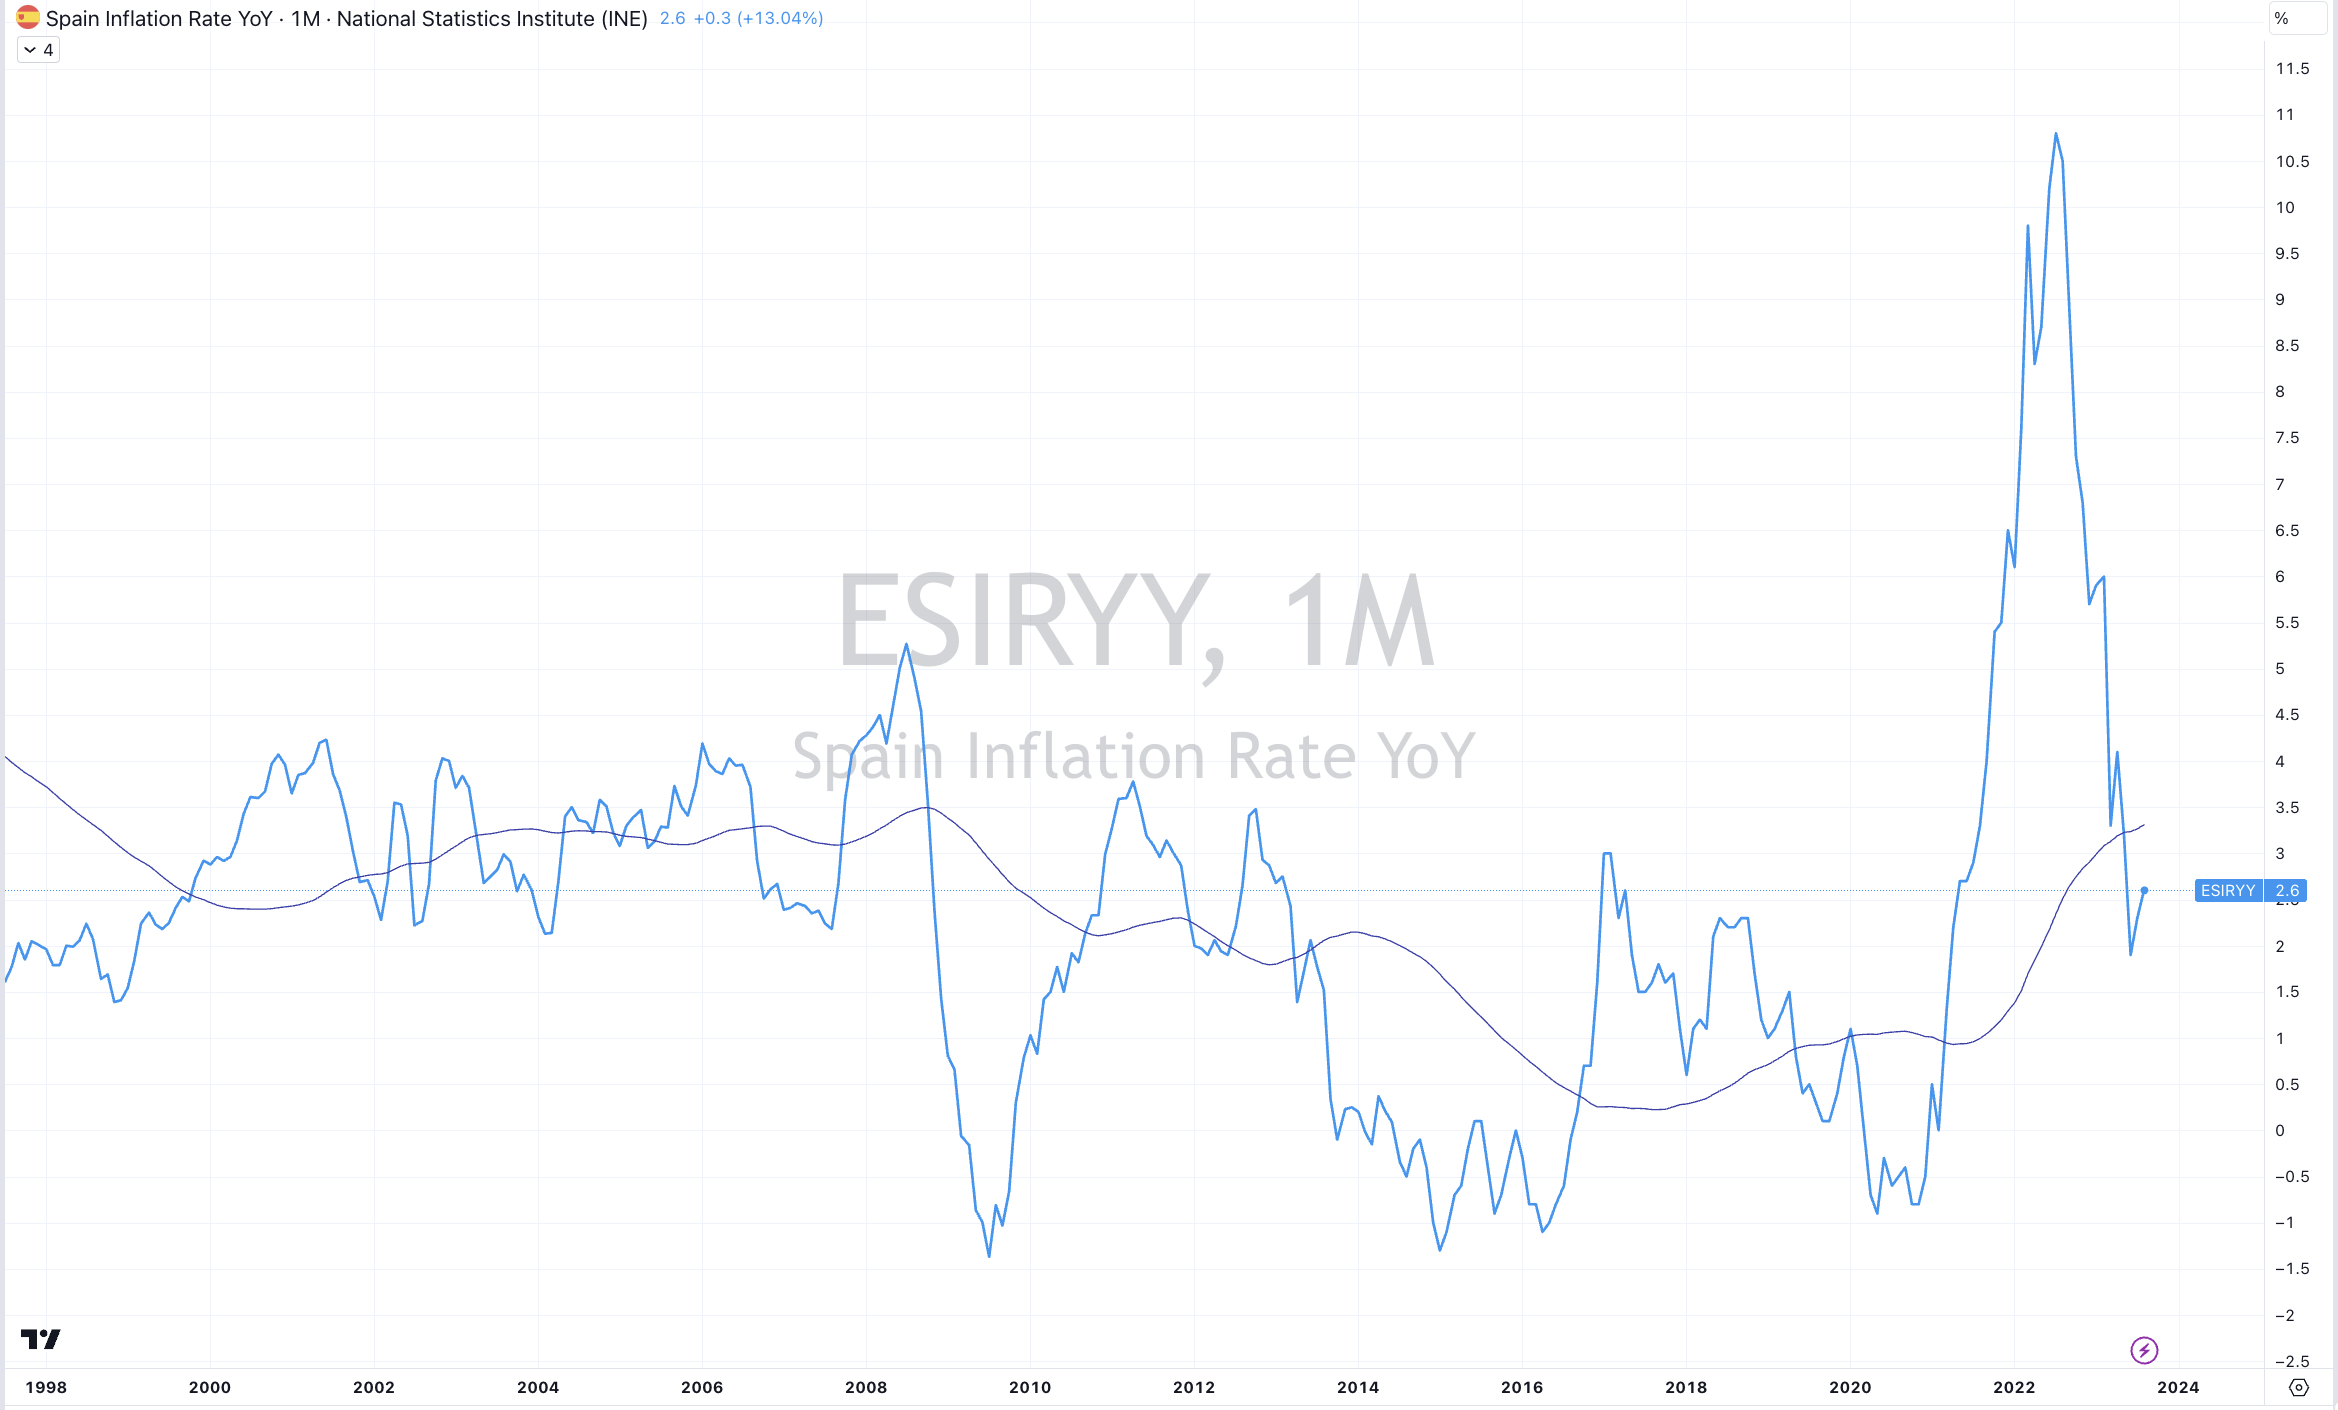
Spanish inflation was in the news this past week, reporting a rise from July’s 2.1% reading to 2.4% for the month of August 2023.

However, the main story of the Spanish inflation rate appears in the first chart below.

Mean reversion beckoned, especially following parabolic price moves.

The second chart shows the Spanish 2 year government bond yield compared to the same inflation rate.

The ‘stubbornness’ of the bond yield (in orange) holding up at 3.42% tells me that inflation move back higher.

I’ll watch for the 4.5% region as the first stop.

September 2, 2023

by Rob Zdravevski

rob@karriasset.com.au
‘No one’ is long Small Caps

While everyone is chasing ‘mega’ caps.

The study below shows the 4 notable times over the past 15 years that the S&P Small Cap 600 Index was oversold when compared to the S&P 500.

That ratio appears in blue.

The rectangles are 5 other moments when the RSI reading was 35 and ‘close enough’ to being 30.

September 1, 2023

by Rob Zdravevski

rob@karriasset.com.au
Chalice completes a reversion to the mean

There is a preface within my latest newsletter ‘Warming To Commodities’, that I have been a bearish on commodities and their related stocks for the past 2 years.

2 years ago, I wrote this note about Australian mining company, Chalice Mining (CHN:ASX) and it was an example of my bearish views.

Following that near-term August 2021 timeframe, the stock price danced between both ends of its ‘extreme pendulum’.

This week, Chalice Mining’s stock price finally mean reverted back to (and below) its 200 week moving average. This satisfies my criteria of an ‘oversold’ extreme where it’s also oversold on a weekly basis and trading 2.5 standard deviations below its weekly mean.

Whilst the downward price trend is strong suggesting further weakness (and there are gaps way below), the lesson is more about observing where the upper end of the ‘extremes’ range was and how the ‘mean’ rolls and morphs over time.

For example, back in August 2021, the 200 week moving average for Chalice sat at $1.49……now that mean is at $4.82.

Now, it’ll be important to watch if the stock price holds $3.37, which was its June 2022 trough.

Interestingly, nearly 15% of the company’s shares outstanding have been traded in the past 4 weeks of weakness.

Providing that ‘nothing is broken’, this is also an example where ‘weaker hands’ are throwing their stock away, into the hands of ‘stronger hands’.

August 31, 2023

by Rob Zdravevski

rob@karriasset.com.au
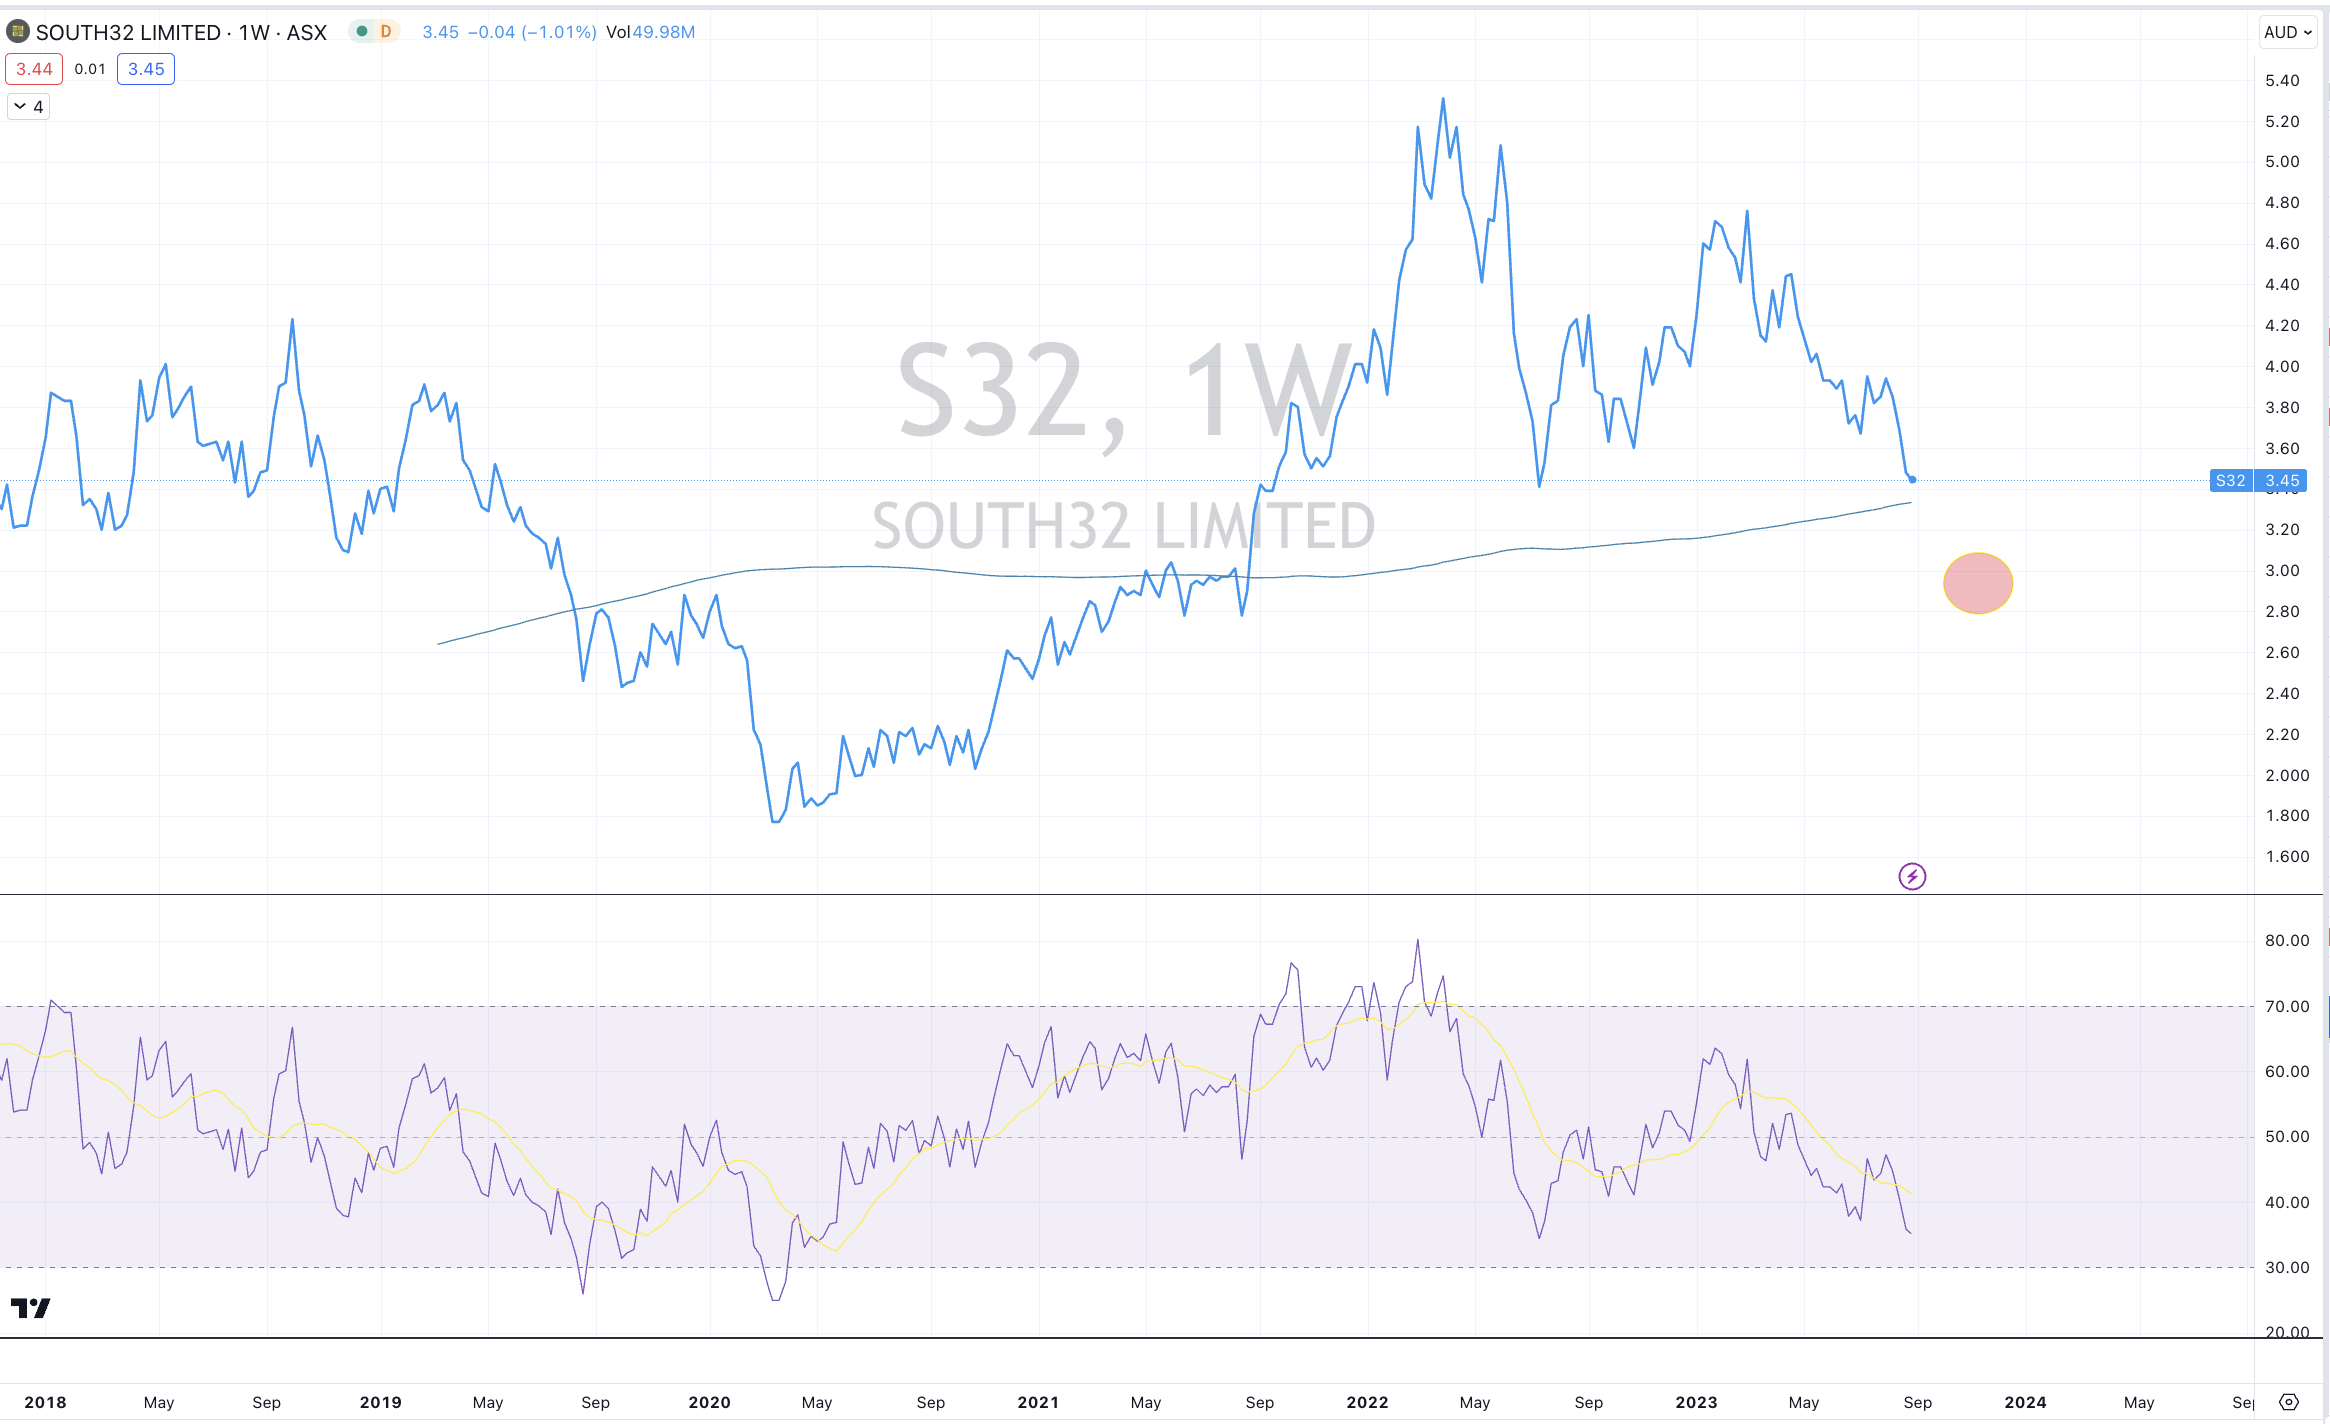
South32 closing in on mean reversion

This chart and study of Australian domiciled metals and mining company, South32 is an example of a stock price mean reverting back to its 200 week moving average.

This price action is mimicked across many commodity related stocks.

For now, I’ll wait for South32 (S32:ASX) to trade down to $2.95.

August 30, 2023

by Rob Zdravevski

rob@karriasset.com.au

Re-acquainting with the Copper/Gold Ratio

‘No one’ is ‘long’ bonds.

‘No one’ thinks bond yields will fall.

The divergence (and expected catch-up) between the Copper/Gold Ratio and U.S. 2’s and 10’s (as shown in the charts below) aids my thinking that bond yields will decline or at least converge toward their longer term means which are sitting much lower than the current ‘price’.

Once upon a time, not so long ago, I recall investors (in various meetings) telling that me “they would take 5% any day of the week”.

Today, the consensus isn’t content and wants to squeeze interest rates higher.

I’d guess that should interest rates fall notably, there is a move in consumer behaviour, asset pricing and business that many aren’t fathoming.

August 29, 2023

by Rob Zdravevski

rob@karriasset.com.au

Queuing off the AUD/USD

I’m watching the AUD/USD closely.

My previous notes have said it should hold 0.63-0.64 region and for now that remains valid……until it doesn’t.

Buying the Aussie weakness is one my larger macro trade ideas (even versus EUR and GBP)

I don’t subscribe to calls for it to trade below 0.6000 although my view could change.

The case for 0.63-0.64 support holding is because the weekly downtrend is lacking strength.

Here are some charts showing the dance between the AUD/USD and i) Australian Inflation, ii) Iron Ore prices and iii) the S&P Goldman Sachs Commodity Index.

August 29, 2023

by Rob Zdravevski

rob@karriasset.com.au