Part 2 of my July 2023 market views
July 13, 2023 Leave a comment
Part 2 attached of a presentation I’m speaking to a few about
Trying to hear what's not being said
July 13, 2023 Leave a comment
Part 2 attached of a presentation I’m speaking to a few about
July 13, 2023 Leave a comment
Part 1 attached of a presentation I’m speaking to a few about
July 8, 2023 Leave a comment
A weekly Macro, Cross Asset review of prices trading at extremes which may generate future investment ideas and opportunities.
The following assets (on a weekly timeframe) either registered an Overbought or Oversold reading and/or have traded more than 2.5 standard deviations above or below its rolling mean.
Extremes “above” the Mean (at least 2.5 standard deviations)
Dow Jones Transports
U.S. 7 year government bond yield
Learn Hogs
Oats
Overbought (RSI > 70)
Australia 2 & 3 year government bond yields
British 2, 3, 5 & 10 year government bond yields
U.S. 3 month bill yields
Cocoa
Cotton
GBP/JPY
Nasdaq 100
India’s Nifty 50 and Sensex
And Russia’s MOEX equity index
The Overbought Quinella – Both Overbought and Traded at > 2.5 standard deviations above the weekly mean)
U.S. 5 year minus U.S. 5 year breakeven inflation rate
Uranium
Extremes “below” the Mean (at least 2.5 standard deviations)
Brazil 10 year government bond yields
U.S. 10 year minus U.S. 5 year bond yield spread
Coffee
Oversold (RSI < 30)
Newcastle Coal
The Oversold Quinella – Both Oversold and Traded at < 2.5 standard deviations below the weekly mean)
None
Notes & Ideas:
After taking a break last week, Equities were generally weaker.
The Dow Jones Transports Index took turns with the Nasdaq Transportation Index being overbought
Nasdaq 100 is overbought for the 7th straight week while the Nikkei 225 isn’t overbought this week. This is the 2nd weekly decline for the Nikkei following its 10 week winning streak.
The KRE Regional Bank Index and Chile’s stock market have both risen 5% over the past fortnight.
The Nasdaq Biotechnology Index has fallen 6% over the past 3 weeks.
The Dow Jones Industrial Average had an ‘inside week’, leaving last week’s bullish outside reversal week ‘thesis’ intact.
The FTSE 100 has seen its lowest close since November 3, 2022.
Istanbul’s BIST Index makes new all-time highs.
While South Korea’s KOSPI, Switzerland’s SMI, Australian ASX 200 and Frances’ CAC-40 all performed outside bearish reversal week’s.
The latter continues to whipsaw for it did a bullish version of this in the previous week.
Sacré Bleu !
Most Government bond yields rose, again.
The whole range of Gilt yields are overbought.
The British 2’s, 3’s and 10’s continue to barrel higher and make ’ higher highs. They are now at their highest closing yields since October 2008.
German 2’s are at their highest closing weekly yield since September 2008 but the 5’s and 10’s are yet to break above their February ’23 highs.
U.S. 5 year minus U.S. 5 year breakeven inflation rate spread is overbought which means something.
The Australian 10 year minus 2 year bond yield spread ended its 4 week stint being oversold. The last time it was in that territory was August 2019 and prior to that was in July 2016.
The yield on the U.S. 3 month bill close at its highest level since New Year’s Day 2001.
Australian 2 & 3 year bond yields closed at their highest point since July 2011 and they are overbought on Monthly basis too.
The U.S. 2’s saw their highest closing yield since June 2007 and this weeks intra-week high did make a ‘higher high’ beyond 5.09% seen in March of 2023.
U.S. 10 year yield minus U.S. 2 year yield spread is approaching oversold territory, which also means something.
The U.S. 10 year minus U.S. 5 year yield spread broke its 8th consecutive ‘losing’ week.
And inversely, the Brazilian 10 year yield has closed at its lowest level since August 23, 2021.
Perhaps this is the result of a central bank commencing its hawkish interest rates cycle, more than 12 months ahead of G-12 countries?
Commodities were mainly higher.
Energy prices generally rose for the 2nd week and helped the commodity indices post a 2% return for the week.
Crude Oil and Heating Oil have risen 7% over the past 2 weeks and is at its highest close since mid April 2023.
The Baltic Dry Index has sunk 20% over the past 2 weeks.
Lean Hogs and Oats return to overbought territory this week, after having a week’s rest.
In fact, Oats have soared 25% in the past 5 week winning streak.
U.S. Midwest Hot Rolled Coil Steel broke its 5 week losing streak by rising 4%.
Corn and Wheat were dormant following last weeks thrashing.
Natural Gas fell 8%, giving up some of the 27% return seen in the 4 weeks prior.
Inversely Sugar rose 3% to recover part of the 14% lost over the past fortnight.
Tin and Nickel reversed some of their recent declines.
Coffee had a 5% range during the week in which it traded to an oversold level. It has fallen 20% over the past 10 weeks.
And Orange Juice had a bullish outside reversal week.
Currencies were benign and mixed with slight moves by many in either direction.
FX was mixed. AUD, USD and JPY all had some upward bias
CNH/USD is not oversold this week, while the EUR/JPY isn’t overbought.
The larger advancers over the past week comprised of;
Brent Crude 4.2%, WTI Crude 4.6%, Gasoil 4.9%, Lean Hogs 3.3%, Heating Oil 4.9%, Hot Rolled Coil Steel 4.4%, Lumber 2.2%, Tin 5.3%, Nickel 1.8%, Orange Juice 6.5%, Gasoline 2%, Sugar 3.3%, S&P GSCI 2.1%, Urea Middle East 1.9%, Oats 5.9%, MOEX 1.9%, Istanbul BIST 7.7%, Jakarta 2.1%, KRE Regional Banks 1.6% and Chile’s IGPA Index rose 3.1%.
The group of decliners included;
Baltic Dry Index (7.5%), Newcastle Coal (4.8%), Natural Gas (7.6%), Dutch TTF Gas (9.8%), Uranium (2.1%), Soybeans (1.7%), AEX (2.6%), CAC (3.9%), DAX (3.4%), DJ Industrials (2%), MIB (1.6%), HSCEI (3.5%), Hang Seng (2.9%), IBEX (3.6%), KOSPI (1.5%), Nasdaq Biotech’s (2.4%), Nikkei (2.4%), Copenhagen (1.9%), Stockholm (2.8%), Switzerland’s SMI (3.6%), SOX (2.6%), Singapore’s Strait Times (2.1%), FTSE-100 (3.7%) and Australia’s ASX 200 fell 2.2%.
In other equity index news; the S&P 500 fell 1.2%, the Russell 2000 and S&P SmallCap 600 eased 1.3% lower, the S&P MidCap 400 declined 0.8%, Toronto’s TSX retreated 1.6% and Australia’s Small Cap Index dropped 1.3%
July 8, 2023
by Rob Zdravevski
rob@karriasset.com.au
July 4, 2023 Leave a comment
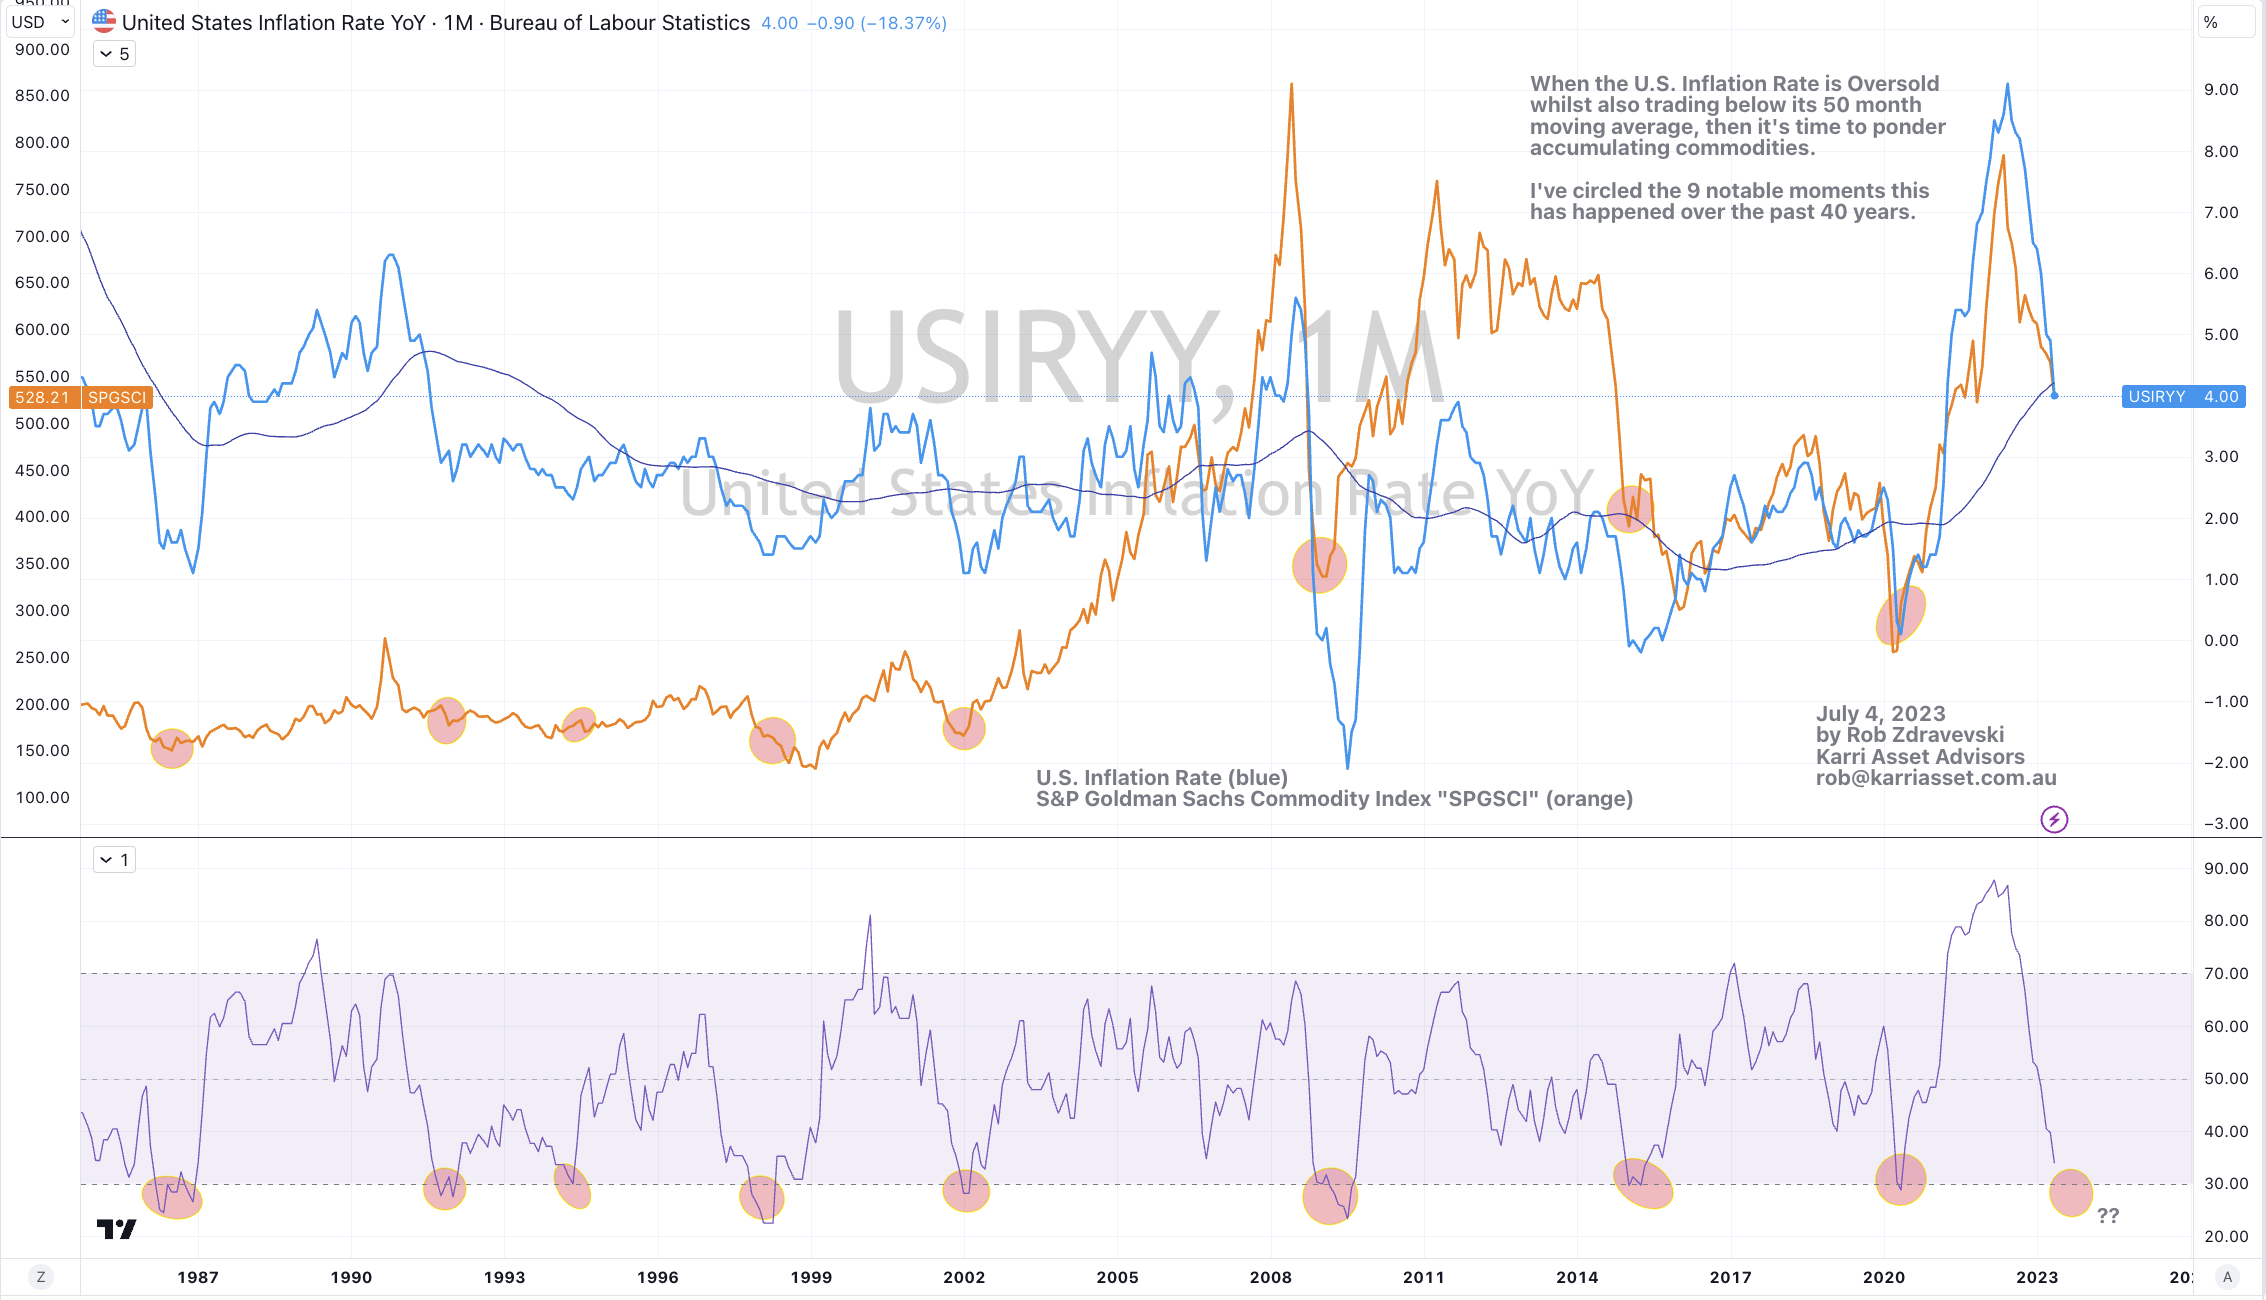
When the U.S. Inflation Rate is Oversold whilst also trading below its 50 month moving average, then it’s time to ponder accumulating commodities.
I’ve circled the 8 notable moments this has happened over the past 40 years.
We may be approaching another such moment.
My recent writings muses that U.S. inflation may have one more dive to the 3.5% region in the coming monthly reports and this should be enough for the stars to align.
The chart below plots the U.S. Inflation Rate (blue) against the S&P Goldman Sachs Commodity Index “SPGSCI” (orange).
July 4, 2023
by Rob Zdravevski
Karri Asset Advisors
rob@karriasset.com.au
July 4, 2023 Leave a comment
I use this ratio (in blue), being the Wilshire 5000 Total Market Index divided by the S&P Goldman Sachs Commodity Index (SPGSCI) to help identify when equities are either cheap or expensive relative to commodities.
Readers may piece together that I have bearish on commodities for the past 15 months or so.
I have circled 13 notable periods over the past 30 years when this ratio was overbought on a weekly basis.
Commodities are now entering such a period of being relatively attractive compared to equities.
July, 4, 2023
by Rob Zdravevski
Karri Asset Advisors
rob@karriasset.com.au

July 2, 2023 Leave a comment
A weekly Macro, Cross Asset review of prices trading at extremes which may generate future investment ideas and opportunities.
The following assets (on a weekly timeframe) either registered an Overbought or Oversold reading and/or have traded more than 2.5 standard deviations above or below its rolling mean.
Extremes “above” the Mean (at least 2.5 standard deviations)
Nasdaq Transports
USD/CNH
Overbought (RSI > 70)
Australia 2 year government bond yields
British 2, 3 & 5 year government bond yields
U.S. 3 month bill yields
Cocoa
EUR/JPY
GBP/JPY
Nasdaq Composite
Nasdaq 100
Nikkei 225
And Russia’s MOEX equity index
The Overbought Quinella – Both Overbought and Traded at > 2.5 standard deviations above the weekly mean)
None
Extremes “below” the Mean (at least 2.5 standard deviations)
Aluminium
Coffee
Rice
THB/USD
Shanghai Composite
And Thailand’s SET Index
Oversold (RSI < 30)
Australian 10 year minus 2 year bond yield spread
Brazil 10 year government bond yields
CNH/USD
The Oversold Quinella – Both Oversold and Traded at < 2.5 standard deviations below the weekly mean)
None
Notes & Ideas:
After taking a break last week, Equities were mainly higher around the world.
The Nasdaq Composite joined the Nasdaq 100 in overbought territory.
European bourses performed well along with American transports along the small and mid caps.
In last week’s commentary, I wrote that Japan’s Nikkei 225 ended its 10 consecutive week of gains. It still remains overbought.
While we saw some consecutive weekly rising streaks come to an end over the past 2 weeks, their upward trends aren’t broken.
The S&P 500 and the SOX are attempting a new march towards overbought territory.
Australia’s (XSO) Small Cap index rose 1.9% which disproved last week’s note about the bearish outside reversal week it posted. However, it is worthy to watch as it’s one of the few indices which is in a downward trend.
Speaking of outside reversal week’s, the following indices performed bullish one’s; France’s CAC 40, the Dow Jones Industrials, Spain’s IBEX, the Nasdaq Composite, the S&P 500 and Chile’s IGPA and IPSA indices.
Most Government bond yields rose
Australian 2 & 3 year bond yields closed at their highest point since July 2011.
The U.S. 2’s saw their highest closing yield since June 2007 but it’s intra-week high is yet to breach the ‘higher high’ of 5.09%, seen in early March of 2023.
While the U.K. 2’s and 3’s continue to barrel higher and make ’ higher highs. They are now at their highest yields since June 2008.
U.S. 10 year yield minus U.S. 2 year yield spread is approaching oversold territory, which means something.
The U.S. 3 month bill yield made a return to overbought territory.
The U.S. 10 year minus U.S. 5 year yield spread registered its 8th consecutive ‘losing’ week.
Commodities were mixed with a slight bias towards weakness.
Energy prices generally rose and prevented the commodity indices from posting a larger losing week than they did.
Lean Hogs and Oats aren’t overbought this week.
Inversely, Lithium Hydroxide and Urea have left oversold territory. Both jumped 11% for the week.
The former has soared 29% over the past 8 weeks.
U.S. Midwest Hot Rolled Coil Steel is into a 5 week losing streak.
Corn and Wheat had a shocker of a week.
Tin and Nickel are stealthy falling.
Gold closed at its lowest price since March 6, 2023.
Coffee has lost 15% over the past 3 weeks, while Palladium has seen the same decline in only 2 weeks.
As portended in last week’s note, the latter ventured into Oversold territory this week, along with the Aluminium price.
Natural Gas has soared 27% in 4 weeks.
Sugar continues its opposite travel from extreme overbought readings by falling 6% for the week (even after Friday’s 3% pop) and confirming the previous weeks bearish outside reversal.
And Silver bounced a little after last week’s visit back to its 200 week moving average.
Currencies were benign and mixed with slight moves by many in either direction.
The Euro was consistently stronger against its various crosses.
AUD/JPY took a break from its overbought status. This currency cross featured in last week’s commentary.
The Malaysian Ringgit moved out of oversold territory while the Chinese Yuan remains so for the 2nd consecutive week as it flirts with recent lows and making a even cheaper currency difficult to ignore amidst the shunning of globalisation in favour for ‘on-shoring’.
The larger advancers over the past week comprised of;
Rotterdam Coal 7%, Brent Crude 1.9%, Cocoa 4.7%, WTI Crude 2.1%, Lean Hogs 4.8%, Heating Oil 1.7%, JKM LNG 3.4%, Lithium 11.6%, Natural Gas 2.5%, Cotton 2.2%, Dutch TTF Gas 14.1%, Urea Middle East 11.7%, Silver AUD 1.8%, Oats 5.8%, Soybeans 2.5%, AEX 2.3%, KBW Bank Index 3.4%, CAC 3.3%, DAX 2%, DJ Industrials 2%, DJ Transports 5.7%, MIB 2.6%, IBEX 3.5%, Nasdaq Composite 2.2%, S&P MidCap 400 4.4%, Nasdaq 100 1.9%, Sensex 2.8%, Oslo 1.7%, Copenhagen 1.8%, Stockholm 3.3%, Russell 2000 3.6%, Philadelphia Semiconductor Index 4.7%, S&P 500 2.4%, S&P SmallCap 600 4.3%, Nasdaq Transports 6.2%, TSX 3.8%, ASX 200 1.5%, ASX SmallCaps 1.9%, Chile 1.9% and KRE Regional Bank index climbed 3.2%.
The group of decliners included;
Baltic Dry Index (10.3%), Aluminium (2.5%), Hot Rolled Coil Steel (3.2%), Coffee (3.6%), Lumber (5.1%), Tin (3.8%), Nickel (3.9%), Palladium (4.5%), Sugar (5.8%), Urea U.S, Gulf (1.8%), Corn (15.4%), Rice (4.7%), Wheat (12.1%), Nasdaq Biotech (1.6%) and Taiwan’s TAEIX fell 1.7%.
July 2, 2023
by Rob Zdravevski
rob@karriasset.com.au
July 1, 2023 Leave a comment
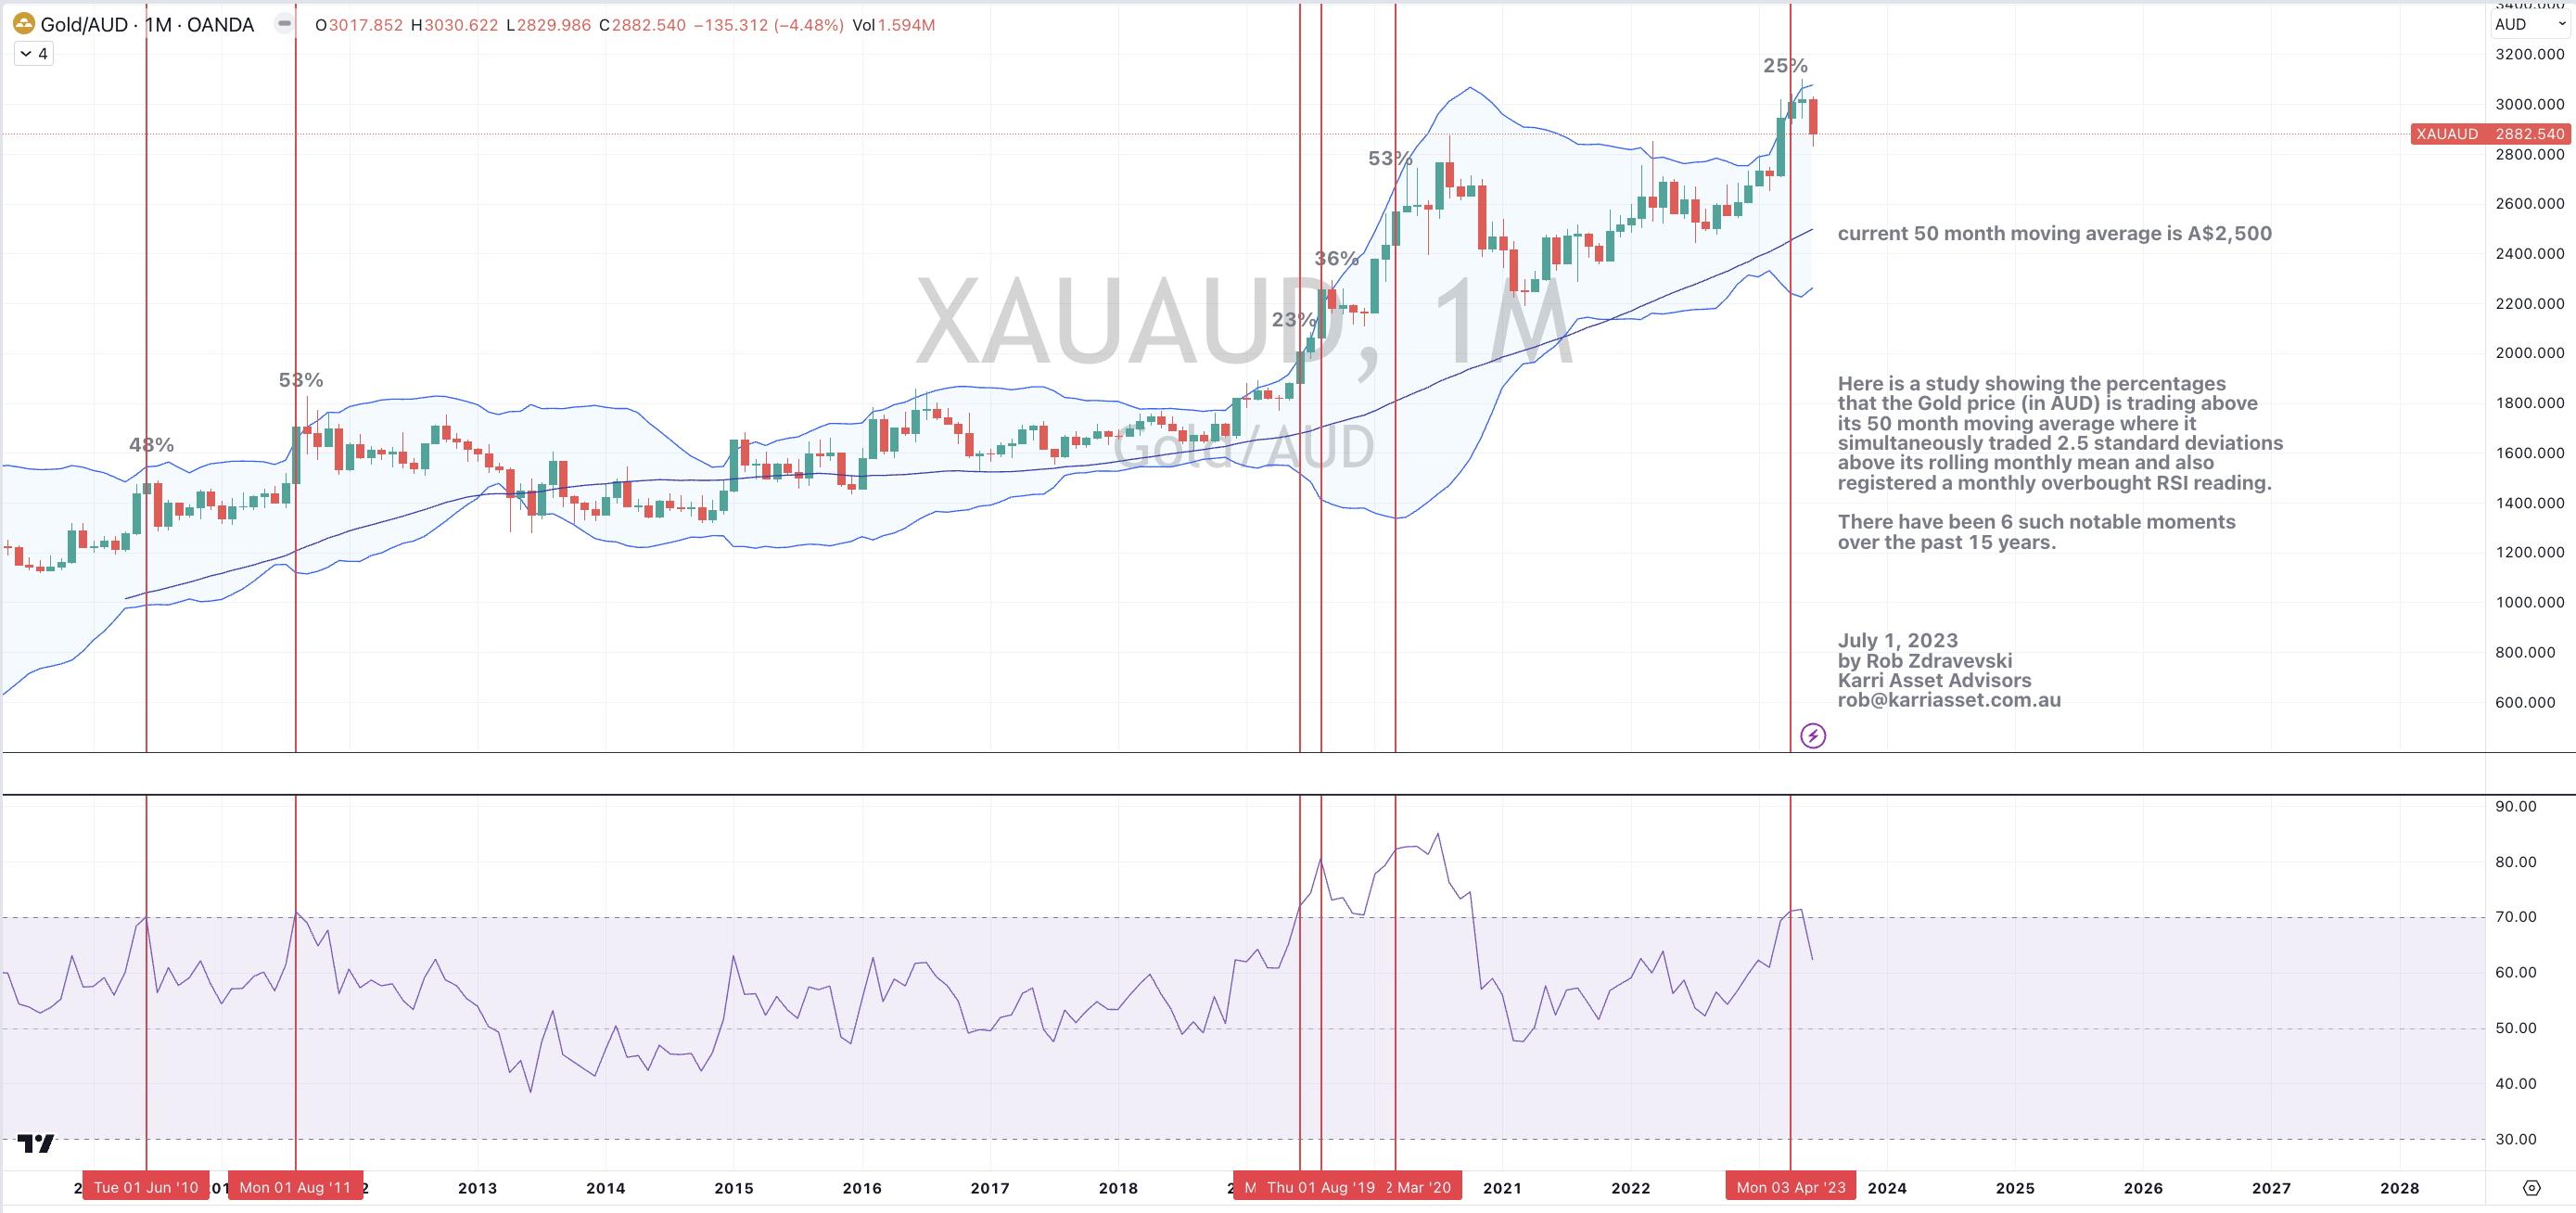
On March 25, 2023, I wrote a cautionary note suggesting selling AUD priced Gold.
That observation was viewed over a weekly basis.
Gold in AUD was trading at A$3,000 at the time.
Although today’s price of A$2,882 hardly resembles a collapse, my view to not chase prices at recent highs is validated.
Now, taking a look at a much longer timeframe……on a monthly basis
the study shows the percentages that the Gold price (in AUD) is trading above its 50 month moving average where it simultaneously traded 2.5 standard deviations above its rolling monthly mean and also registered a monthly overbought RSI reading.
There have been 6 such notable moments over the past 15 years.
Whilst the AUD Gold has never been oversold in the past 15 years, there is a case to accumulate when it touches or trades below its 50 month moving average.
The recent (and current) price action tells me to wait for the AUD Gold price to converge towards the 50 month moving average, which is somewhere around the A$2,500 region.
At that point, I’ll analyse whether Gold (as priced in AUD) will have its time in the sun, again.
Until then, I think there is little merit in entering a long position.
July 1, 2023
by Rob Zdravevski
Karri Asset Advisors
rob@karriasset.com.au
June 30, 2023 Leave a comment
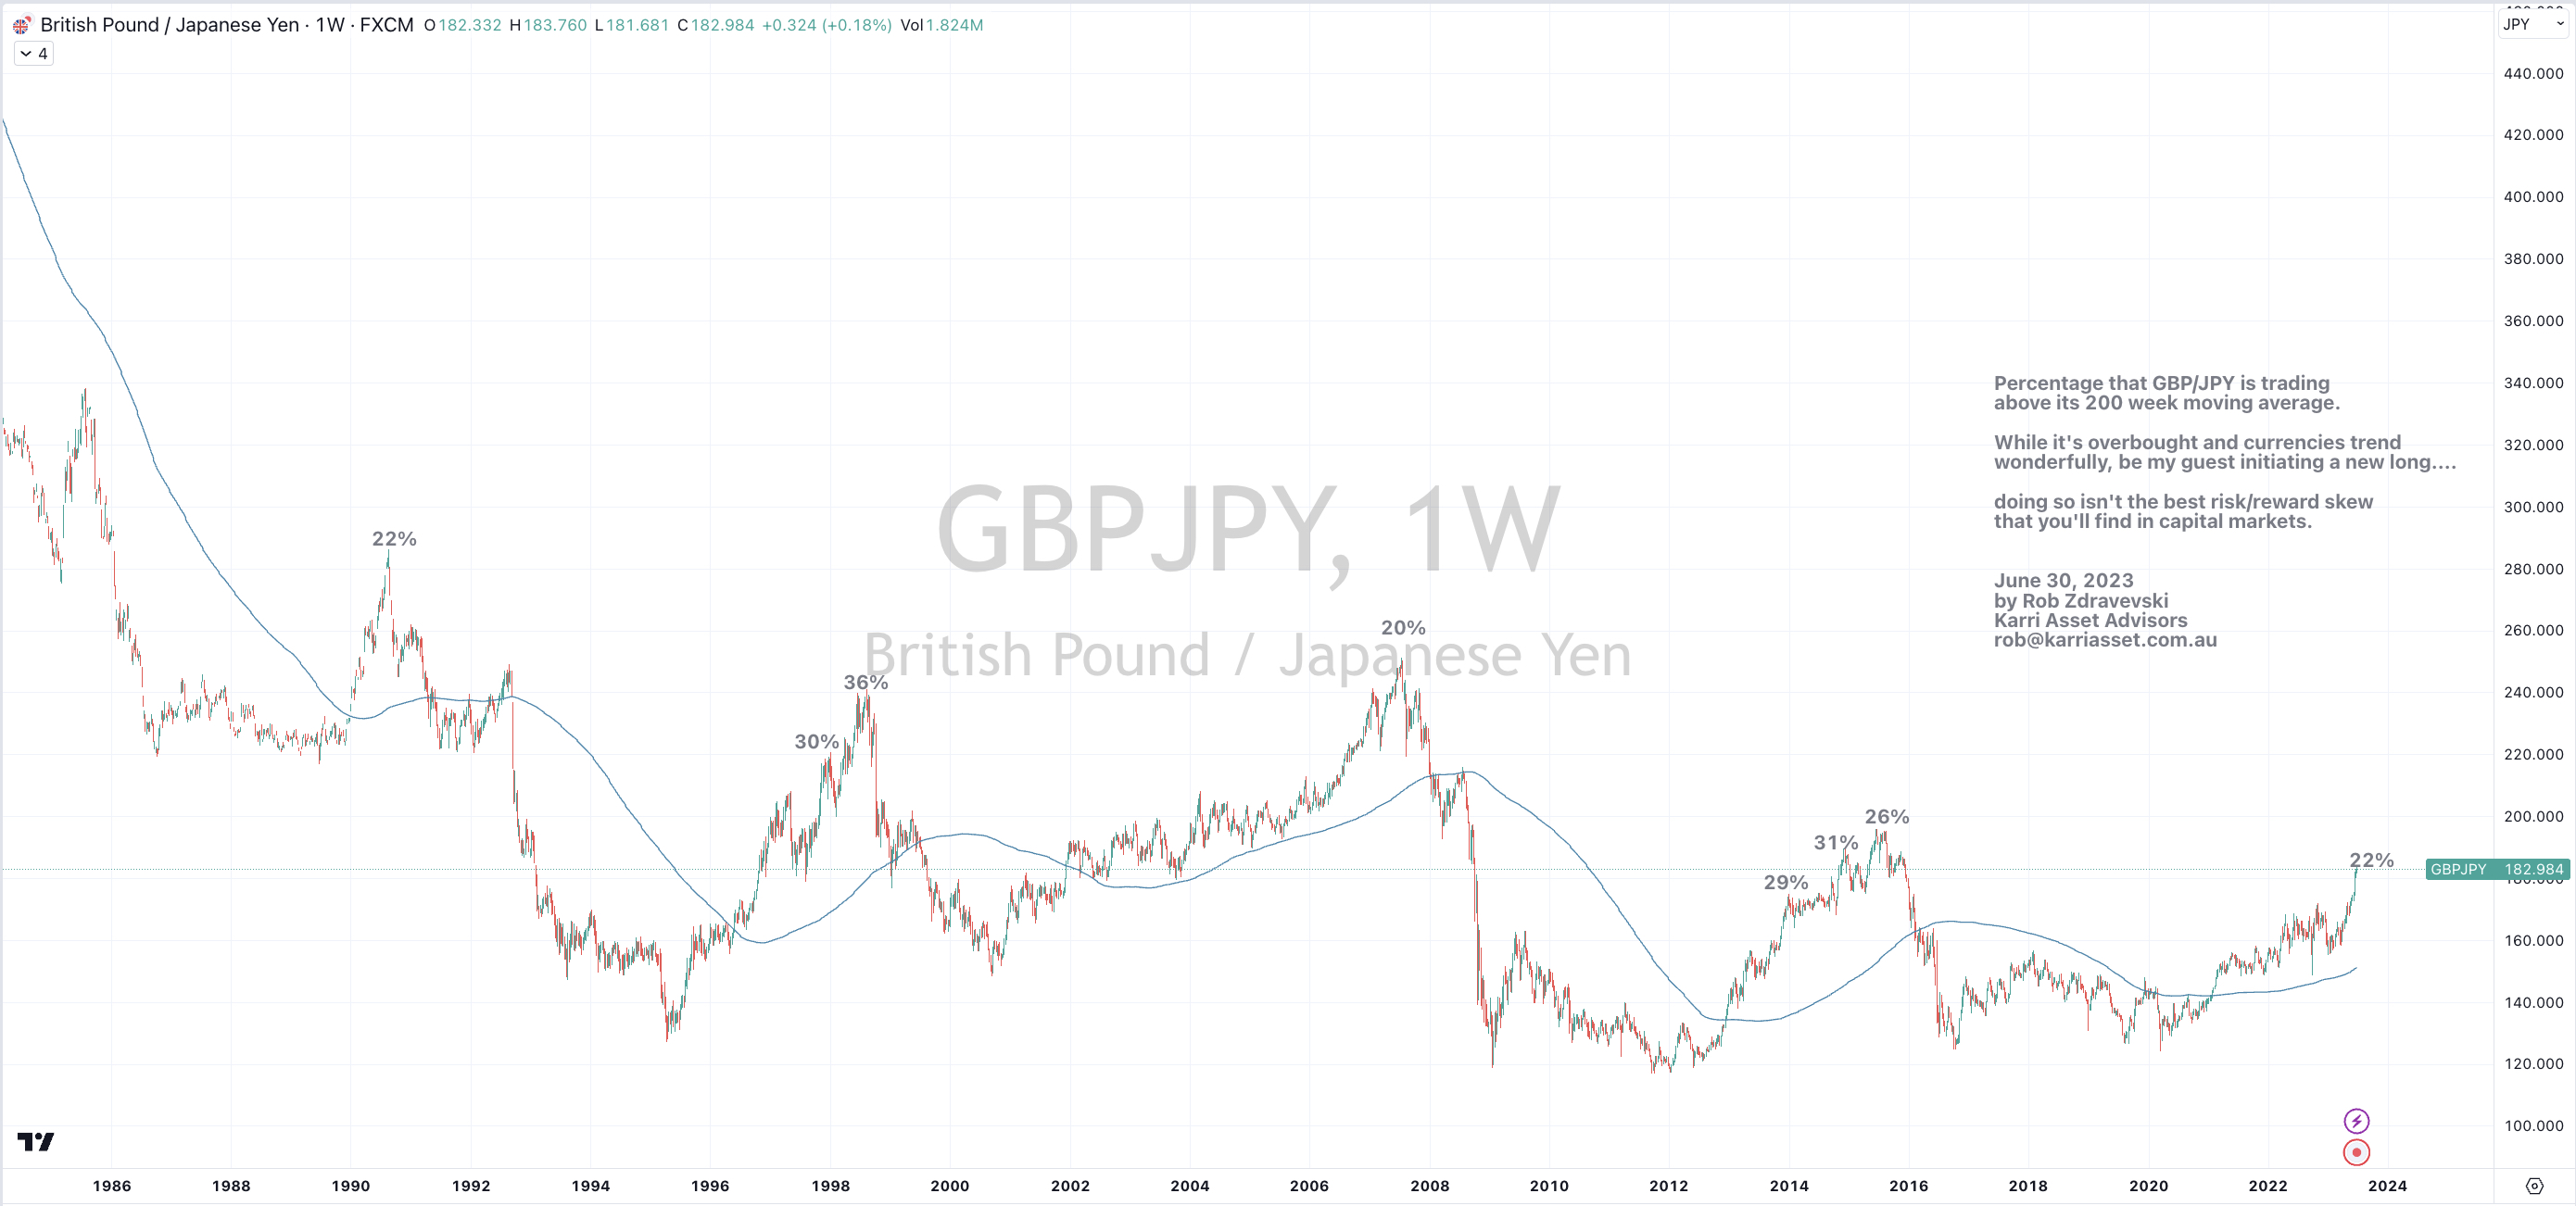
Sterling versus Yen is stretched and high
This study is a weekly chart which shows the percentage that the GBP/JPY is trading above its 200 week moving average.
It’s trading at 182.90 at the time of writing.
While overbought readings can stay overbought for longer than many expect and currencies do trend wonderfully, be my guest initiating a new long at these prices…..
…..for doing so isn’t the best risk/reward skew that you’ll find in capital markets.
June 30, 2023
by Rob Zdravevski
Karri Asset Advisors
rob@karriasset.com.au
June 30, 2023 Leave a comment
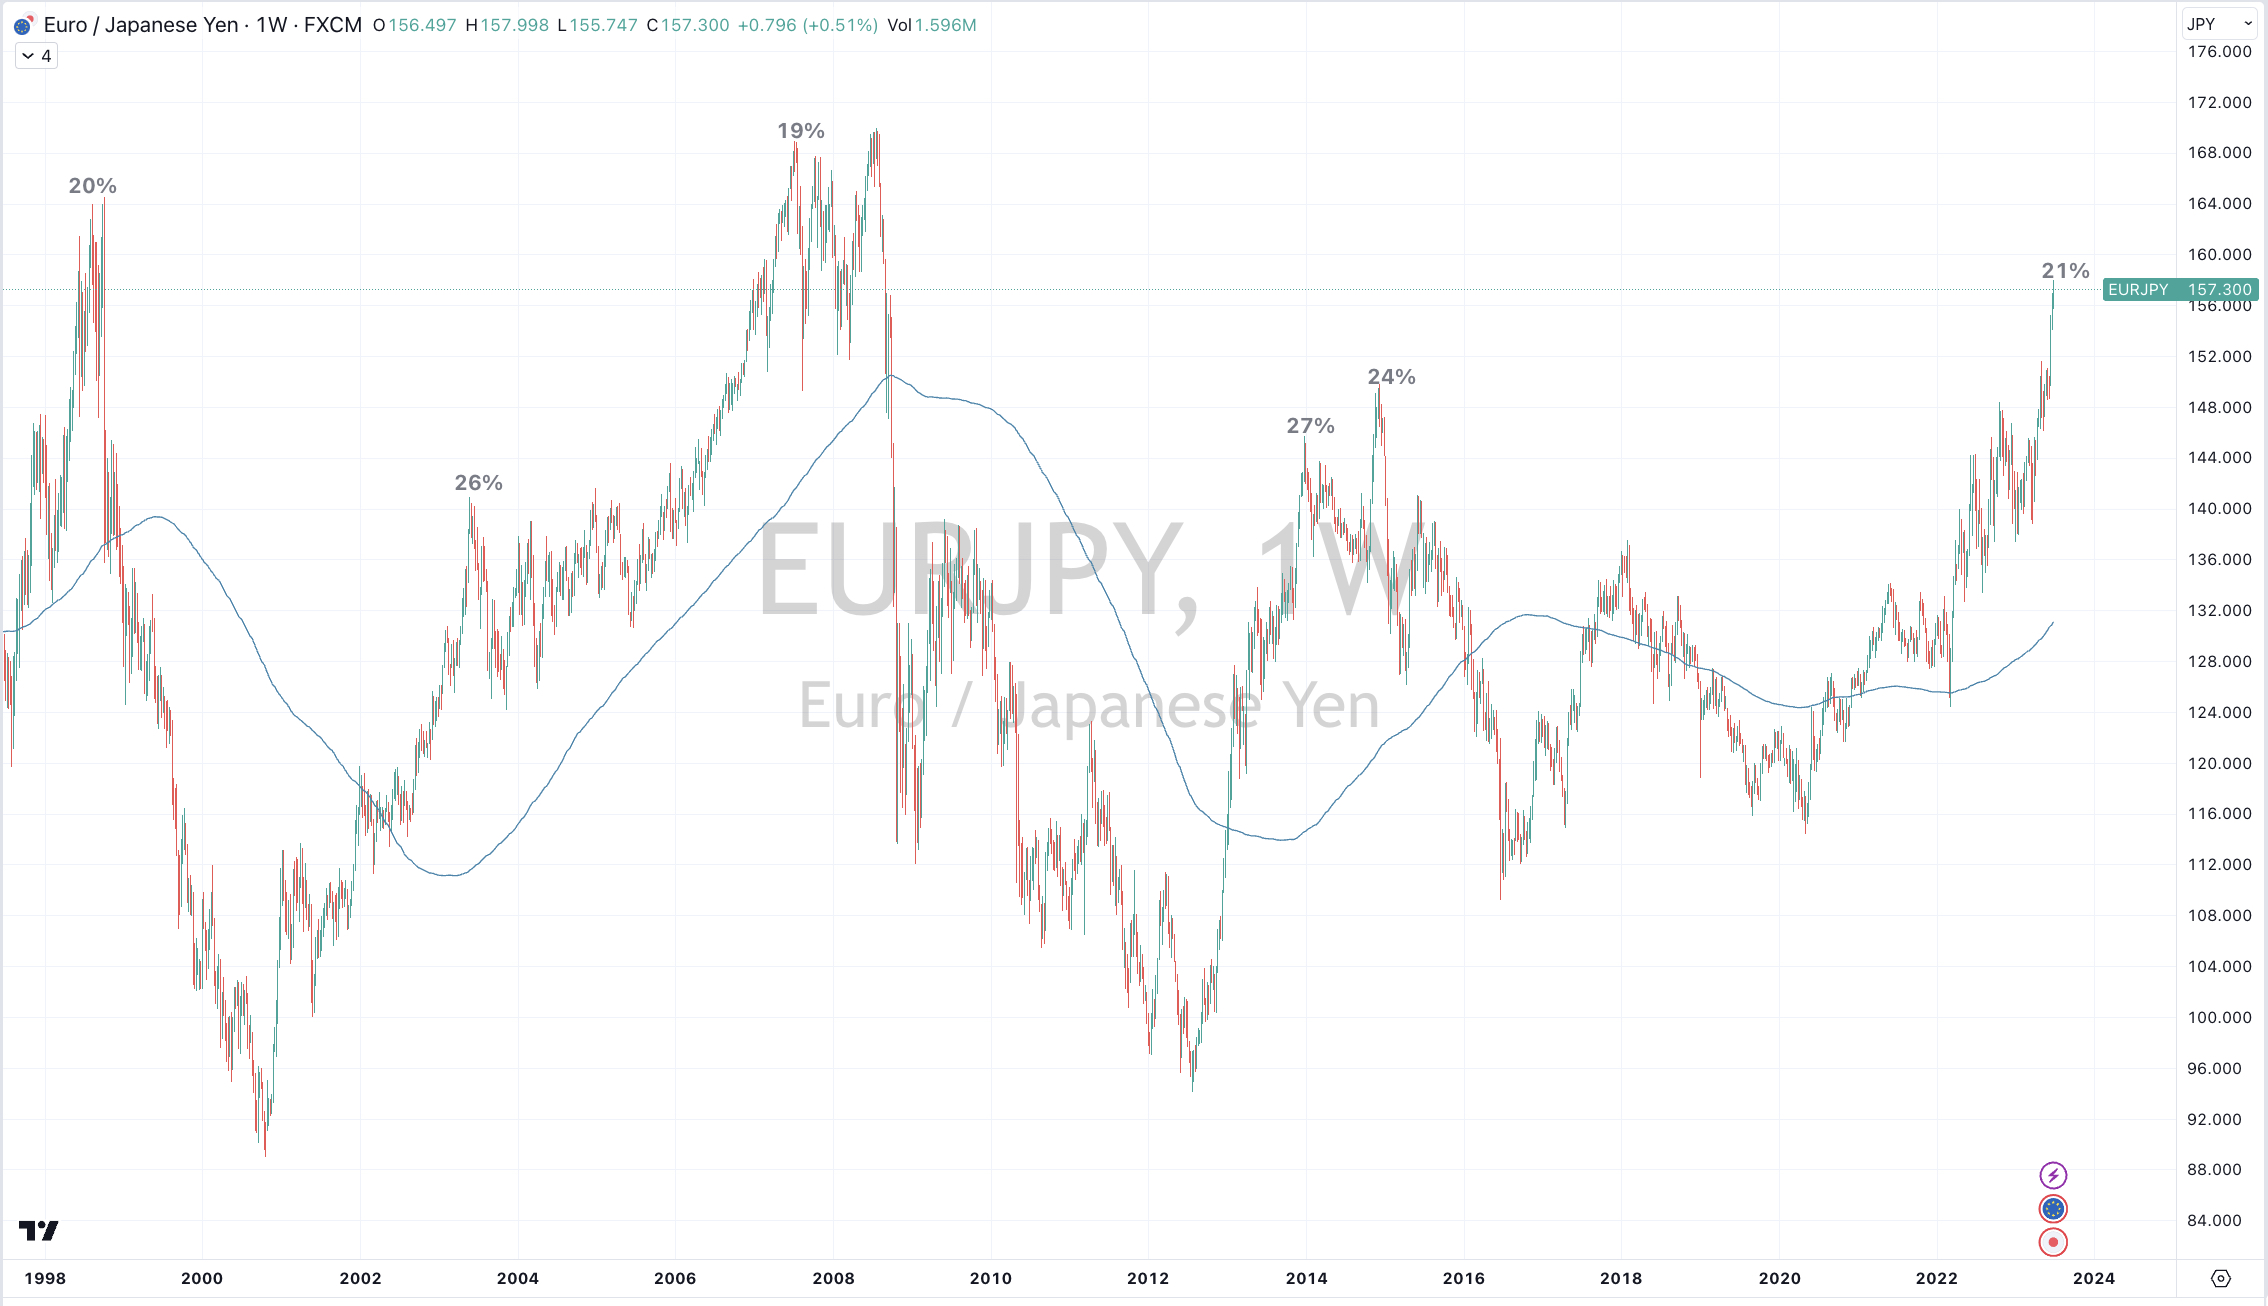
I think that the ‘fat part’ of the Euro advance against the Yen has been seen.
Today’s price is 157.26
Not to be relied on in isolation but this study below shows the percentages which EUR/JPY is trading above its 200 week moving average……and when combined some other studies, it increases the probability of my belief.
Beyond your standard FX trade (currency conversion) this also means European customers and buyers of Japanese parts, components and product should order and pay for their Japanese products ‘tout suite’.
They should be at their cheapest prices seen in the past 3 years, even when considering Japan’s inflation rate of a ‘mere’ 3.2%.
June 30, 2023
by Rob Zdravevski
Karri Asset Advisors
rob@karriaseet.com.au
June 30, 2023 Leave a comment
Since January 4, 2023, the Nikkei 225 (in JPY terms) has climbed 29%.
But from that date, the Yen has weakened 12%……(or the USD has strengthened by 12%)
and so in USD terms, the Nikkei 225 has only risen 17%.
But that’s history.
The lesson for those who are unhedged is multi-faceted.
Today, sellers of Japanese assets would do well holding onto their Yen, if you’re not forced to convert back to your ‘home’ or ‘base’ currency.
i.e. The Yen is too weak (and near extremes) to convert back to your original USD, EUR, GBP, CAD or AUD.
Those not holding any JPY, may ponder buying some Yen considering it’s current (near extremes) low.
If you are not naturally owning various currencies (in to settle your foreign acquisitions) nor running a FX hedging strategy, then treating the FX and Equity as 2 seperate trades and having specific views about each of them is important.
Otherwise you could’ve stayed in the USD the whole time, for the Nasdaq 100 soared 37% since January 4, 2023.
And for ‘non-natural’ USD holders, you would’ve made a few more percent as your ‘home’ currency most likely weakened against the Greenback.
June 30, 2023
by Rob Zdravevski
Karri Asset Advisors
rob@karriasset.com.au
