A weekly Macro, Cross Asset review of prices trading at extremes which may generate future investment ideas and opportunities.
The following assets (on a weekly timeframe) either registered an Overbought or Oversold reading and/or have traded more than 2.5 standard deviations above or below its rolling mean.
* denotes multiple week inclusion
Extremes above the Mean (at least 2.5 standard deviations)
PHP/USD *
KLSE *
And Thailand’ SET Index
Overbought (RSI > 70)
SHY *
IEI
Robusta Coffee *
MYR/USD *
Egypt 30 Index
And the ASX Financials Index *
The Overbought Quinella (Both Overbought and Traded at > 2.5 standard deviations above the weekly mean)
THB/USD *
Extremes below the Mean (at least 2.5 standard deviations)
1 year Australian government bond yields
Chilean 10 year government bond yields
U.S. 5 year bond yield minus the U.S. inflation rate (YoY)
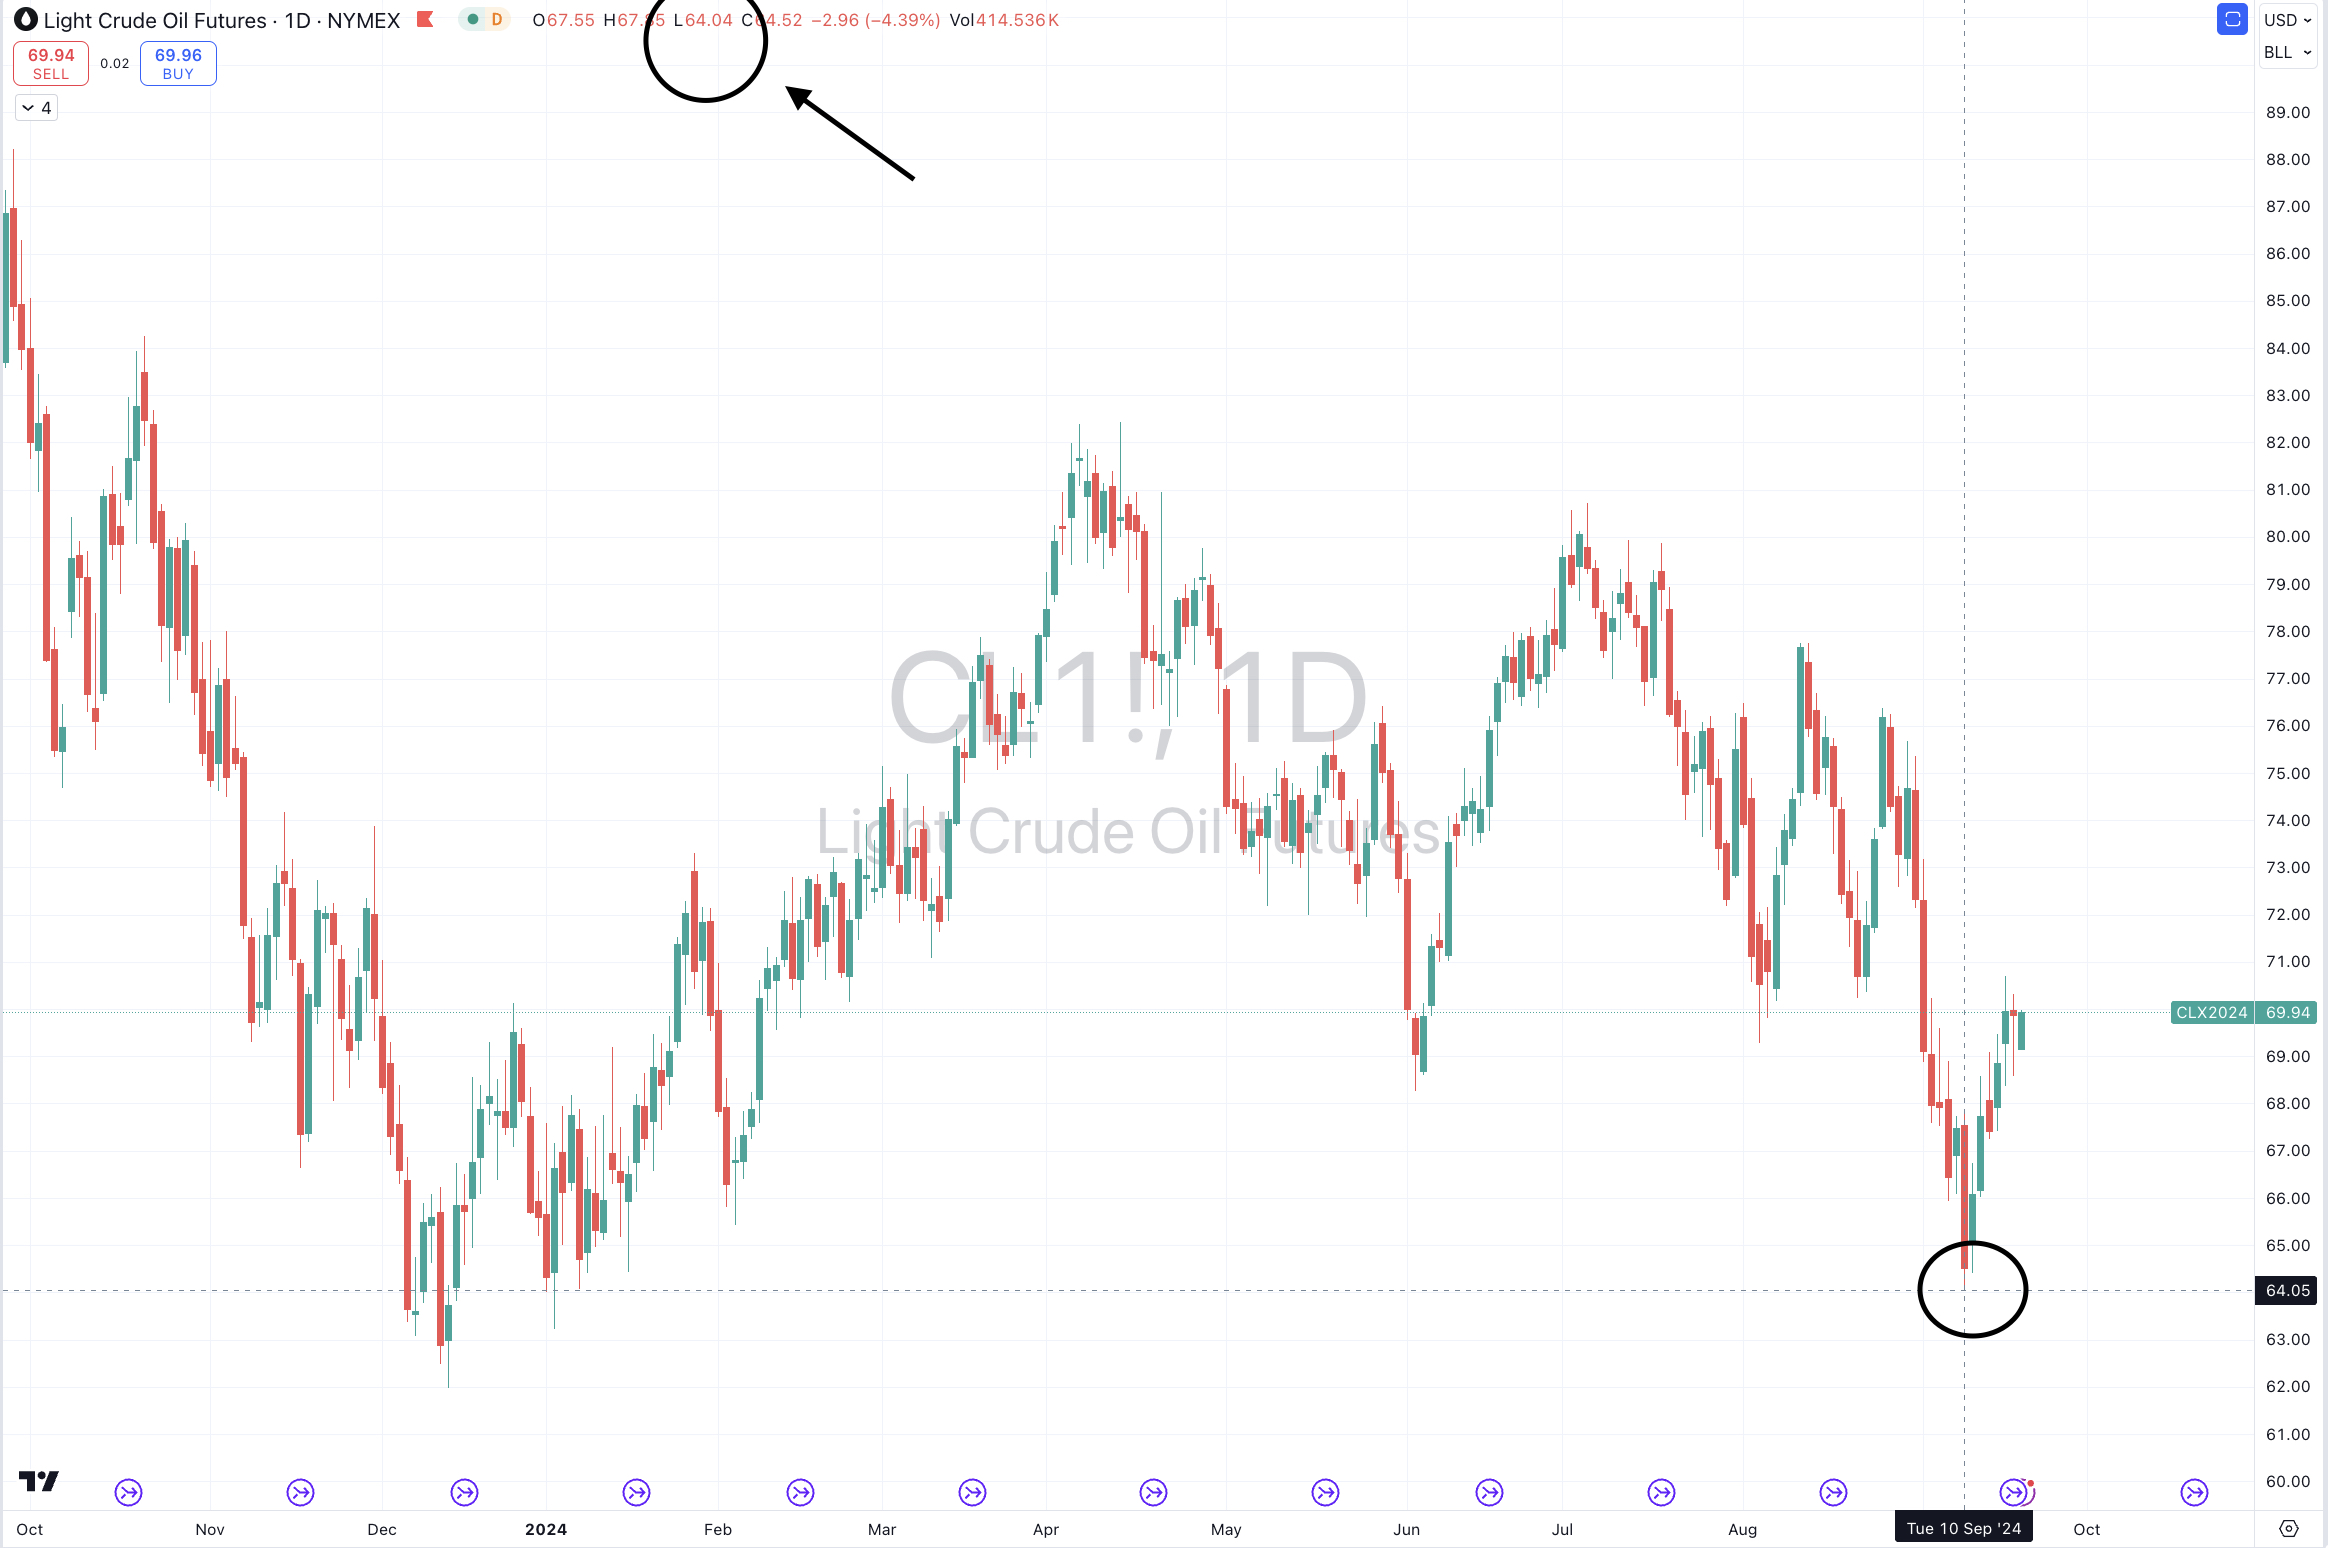
WTI Crude Oil
Heating Oil
Brent Crude Oil
Gasoil
Oversold (RSI < 30)
U.S. 2 year government bond yield
North European Hot Rolled Coil Steel *
U.S. Midwest Hot Rolled Coil Steel *
Lithium Carbonate *
Lithium Hydroxide *
Shanghai Rebar
CFR China Iron Ore
The Oversold Quinella (Both Oversold and Traded at < 2.5 standard deviations below the weekly mean)
U.S. 3 month t-bill yield *
Australian Coking Coal
Notes & Ideas:
Global government bond yields fell, resuming the recently seen weakness.
Swiss, Danish and Finnish did the opposite.
It’s worthy to note that many yields remain in downtrends although they aren’t exhibiting any strength.
The big news is that U.S. yield curve un-inverted.
Australia’s 1 year bond yield is at its lowest close since May 2023, while the strength of the Aussie yield curve upward trend is waning.
The U.S. 5-7 year corporate bond yield is at a 2 year low, while the U.S. government 10’s are at a 16 month low (May ’23)
The U.S. 5 and 10 year breakeven inflation rate is the lowest seen since December 2020.
Chile’s 2’s broke its 11 week rising streak.
Chile’s 10 year yield, mean reverted. The first of the world’s 10’s to do so.
While Chile’s yield curve is on its way to inverting.
Equities had a terrible week.
All of the 4 week winning streaks published last week have been broken.
Most indices have given up the past 3 weeks of gains.
The few exceptions which rose appear in the gainers list below.
Russia’s MOEX is in a 7 week losing streak.
The DAX was one of the indices which posted a bearish outside reversal week.
Malaysia’s KLSE and Thailand’s SET are overbought and mimicking the strength of their currency.
While Australia’s Financial indices is overbought.
Commodities were weak as the commodity indices near their own oversold readings.
Agricultural’s bucked the losing trend.
Various oil contracts also appear as an extreme in this week’s edition as Gasoline completes a mean reversion.
Aluminium has fallen 7% in the past 2 weeks.
Lithium, Coking Coal, Tin and Iron Ore were amongst the notable losers.
Arabica Coffee notably left the overbought list.
Corn isn’t oversold anymore.
The Baltic Dry Index has risen 16% over the past 4 weeks.
And Lithium Hydroxide has now spent 60 consecutive weeks in weekly oversold territory.
Currencies set the mood for risk.
The Aussie was weaker as the AUD/THB is near a oversold quinella.
The Thai Baht strength has been impressive.
The Loonie was also weaker.
Inversely, the Swiss and Yen both rose.
Many currencies have dropped out of this weeks ‘extremes’ list.
MXN/USD is oversold
The Indonesian Rupiah has risen for 6 weeks against the USD.
AUD/EUR broke it 4 weeks rising streak and the NZD/USD broke its 5 week winning run.
The DXY fell and gave up half of last weeks gain.
And the USD/JPY had a bearish outside several week.
The larger advancers over the past week comprised of;
Baltic Dry Index 7%, Natural Gas 7%, Orange Juice 4.3%, Rubber 2.9%, Urea U.S. Gulf 1.9%, Urea Middle East 1.8%, Corn 1.3%, Oats 4.2%, Rice 2.1%, Wheat 2.8%, Egypt 0.8%, IDX 0.4%, SET 5.1% and ASX Financials Index 2.6%.
The group of largest decliners from the week included;
Aluminium (3.6%), Australian Coking Coal (12.4%), Rotterdam Coal (4.8%), Bloomberg Commodity Index (2.5%), Cocoa (7.7%), China Coking Coal (12.7%), WTI Crude (8%), Cotton (3%), Iron Ore (9%), Lean Hogs (3.3%), Copper (3.3%), Heating Oil (7.2%), HRC (2%), JKM LNG (2.1%), Arabica Coffee (3.3%), Cattle (1.9%), JKM in Yen (8.8%), Lithium Carbonate (11.2%), Lithium (9.4%), Tin (6.1%), Newcastle Coal (2.9%), Nickel (5.6%), Palladium (6.7%), Gasoline (9.4%), Robusta Coffee (3.6%), Sugar (2.4%), S&P GSCI (4.8%), CFR China Iron Ore (8.9%), CRB Index (3.7%), Dutch TTF Gas (8.4%), Brent Crude (7.2%), Gasoil (6.6%), Silver in AUD (1.8%), Silver in USD (3.2%), Shanghai Composite (2.7%), CSI 300 (2.7%), All World Developed ex USA (2.8%), AEX (4.3%), ATX (4%), KBW Banks (5.5%), CAC (3.7%), China A50 (2.9%), DAX (3.2%), DJ Industrials (2.8%), DJ Transports (3.8%), MIB (3.2%), HSCEI (3.6%), Hang Seng (3%), IBEX (2%), S&P Small Cap 600 (5.2%), Russell 2000 (5.5%), TAEIX (3.9%), Nasdaq Composite (5.8%), KRE Regional Banks (5.2%), KOSPI (4.9%), FTSE 250 (2.8%), S&P MidCap 400 (4.8%), Mexico (3.5%), Nasdaq Biotechs (3.8%), Nasdaq 100 (5.4%), Nikkei 225 (5.8%), Oslo (3.7%), Helsinki (3.7%), Stockholm (4.4%), South Africa (3.2%), SMI (4.3%), SOX (12.2%), Chile (3.1%), S&P 500 (4.3%), Nasdaq Transports (2.9%), TSX 300 (2.4%), FTSE 100 (2.3%), WIG (3.7%), ASX 200 (1%), ASX Materials (5.8%) and ASX Small Caps fell 3.2%.
September 8, 2024
by Rob Zdravevski
rob@karriasset.com.au