A weekly Macro, Cross Asset review of prices trading at extremes which may generate future investment ideas and opportunities.
The following assets (on a weekly timeframe) either registered an Overbought or Oversold reading and/or have traded more than 2.5 standard deviations above or below its rolling mean.
n.b. pricing of (commodity) futures contracts is only considering the immediate front month.
* denotes multiple week inclusion
Extremes above the Mean (at least 2.5 standard deviations)
North American Hot Rolled Coil Steel
Oats *
Wheat *
PHP/USD *
CAC 40 equity index *
Overbought (RSI > 70)
LME Aluminium *
Tin
Gold in AUD, CAD, CHF, EUR, GBP, USD and ZAR *
AUD/CAD *
AUD/EUR *
AUD/IDR *
AUD/INR *
AUD/JPY *
AUD/SGD *
AUD/USD *
CHF/JPY
CNH/USD *
MYR/USD *
RMB *
Shanghai Composite
All World Developed ex USA *
Austria’s ATX Index *
Hungary’s BUX Index *
Dow Jones Transports *
Egypt’s EGX Index *
Spain’s IBEX *
Brazil’s BOVESPA *
Mexico’s IPC Index *
Nasdaq Biotech Index
Norway’s OBX Index *
Helsinki’s OMX *
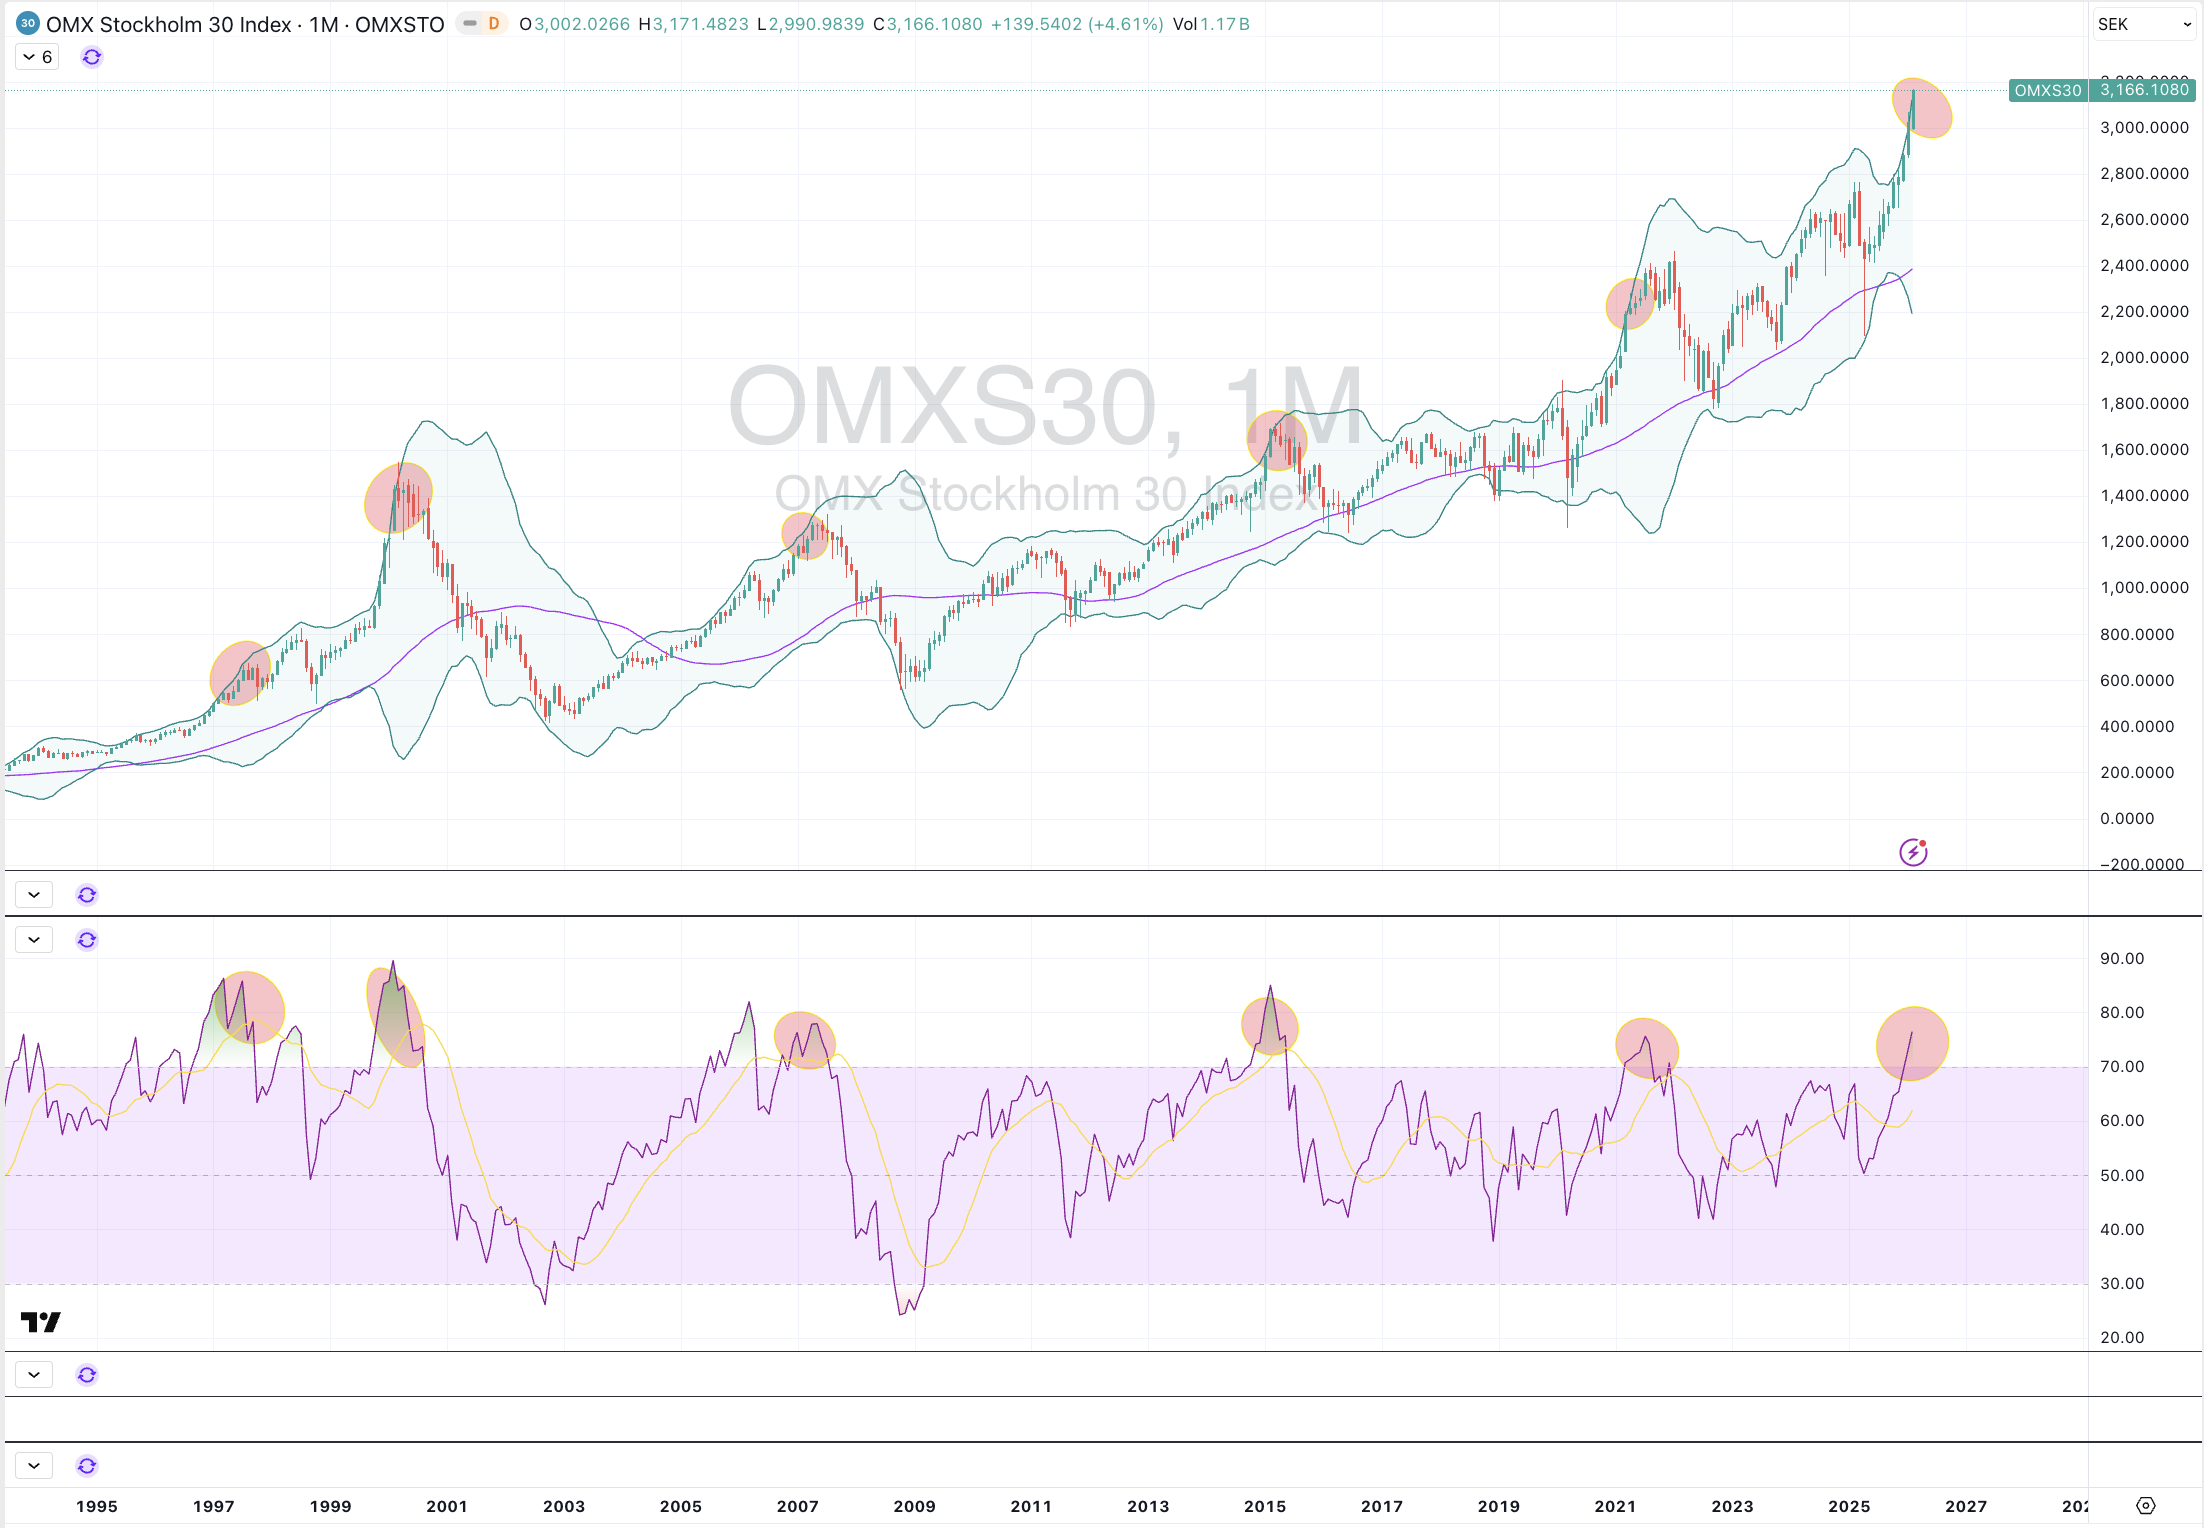
Stockholm’s OMX *
Switzerland’s SMI Index
Philadelphia Semiconductor Index (SOX) *
Singapore’s STI Index
Israel’s TA-35
Nasdaq Transports *
Canada’s TSX Index *
FTSE 100 *
Poland’s WIG Index *
S&P Biotech Index
And the ASX Materials Index *
The Overbought Quinella (Both Overbought and Traded at > 2.5 standard deviations above the weekly mean)
AUD/GBP *
Taiwan’s TAIEX *
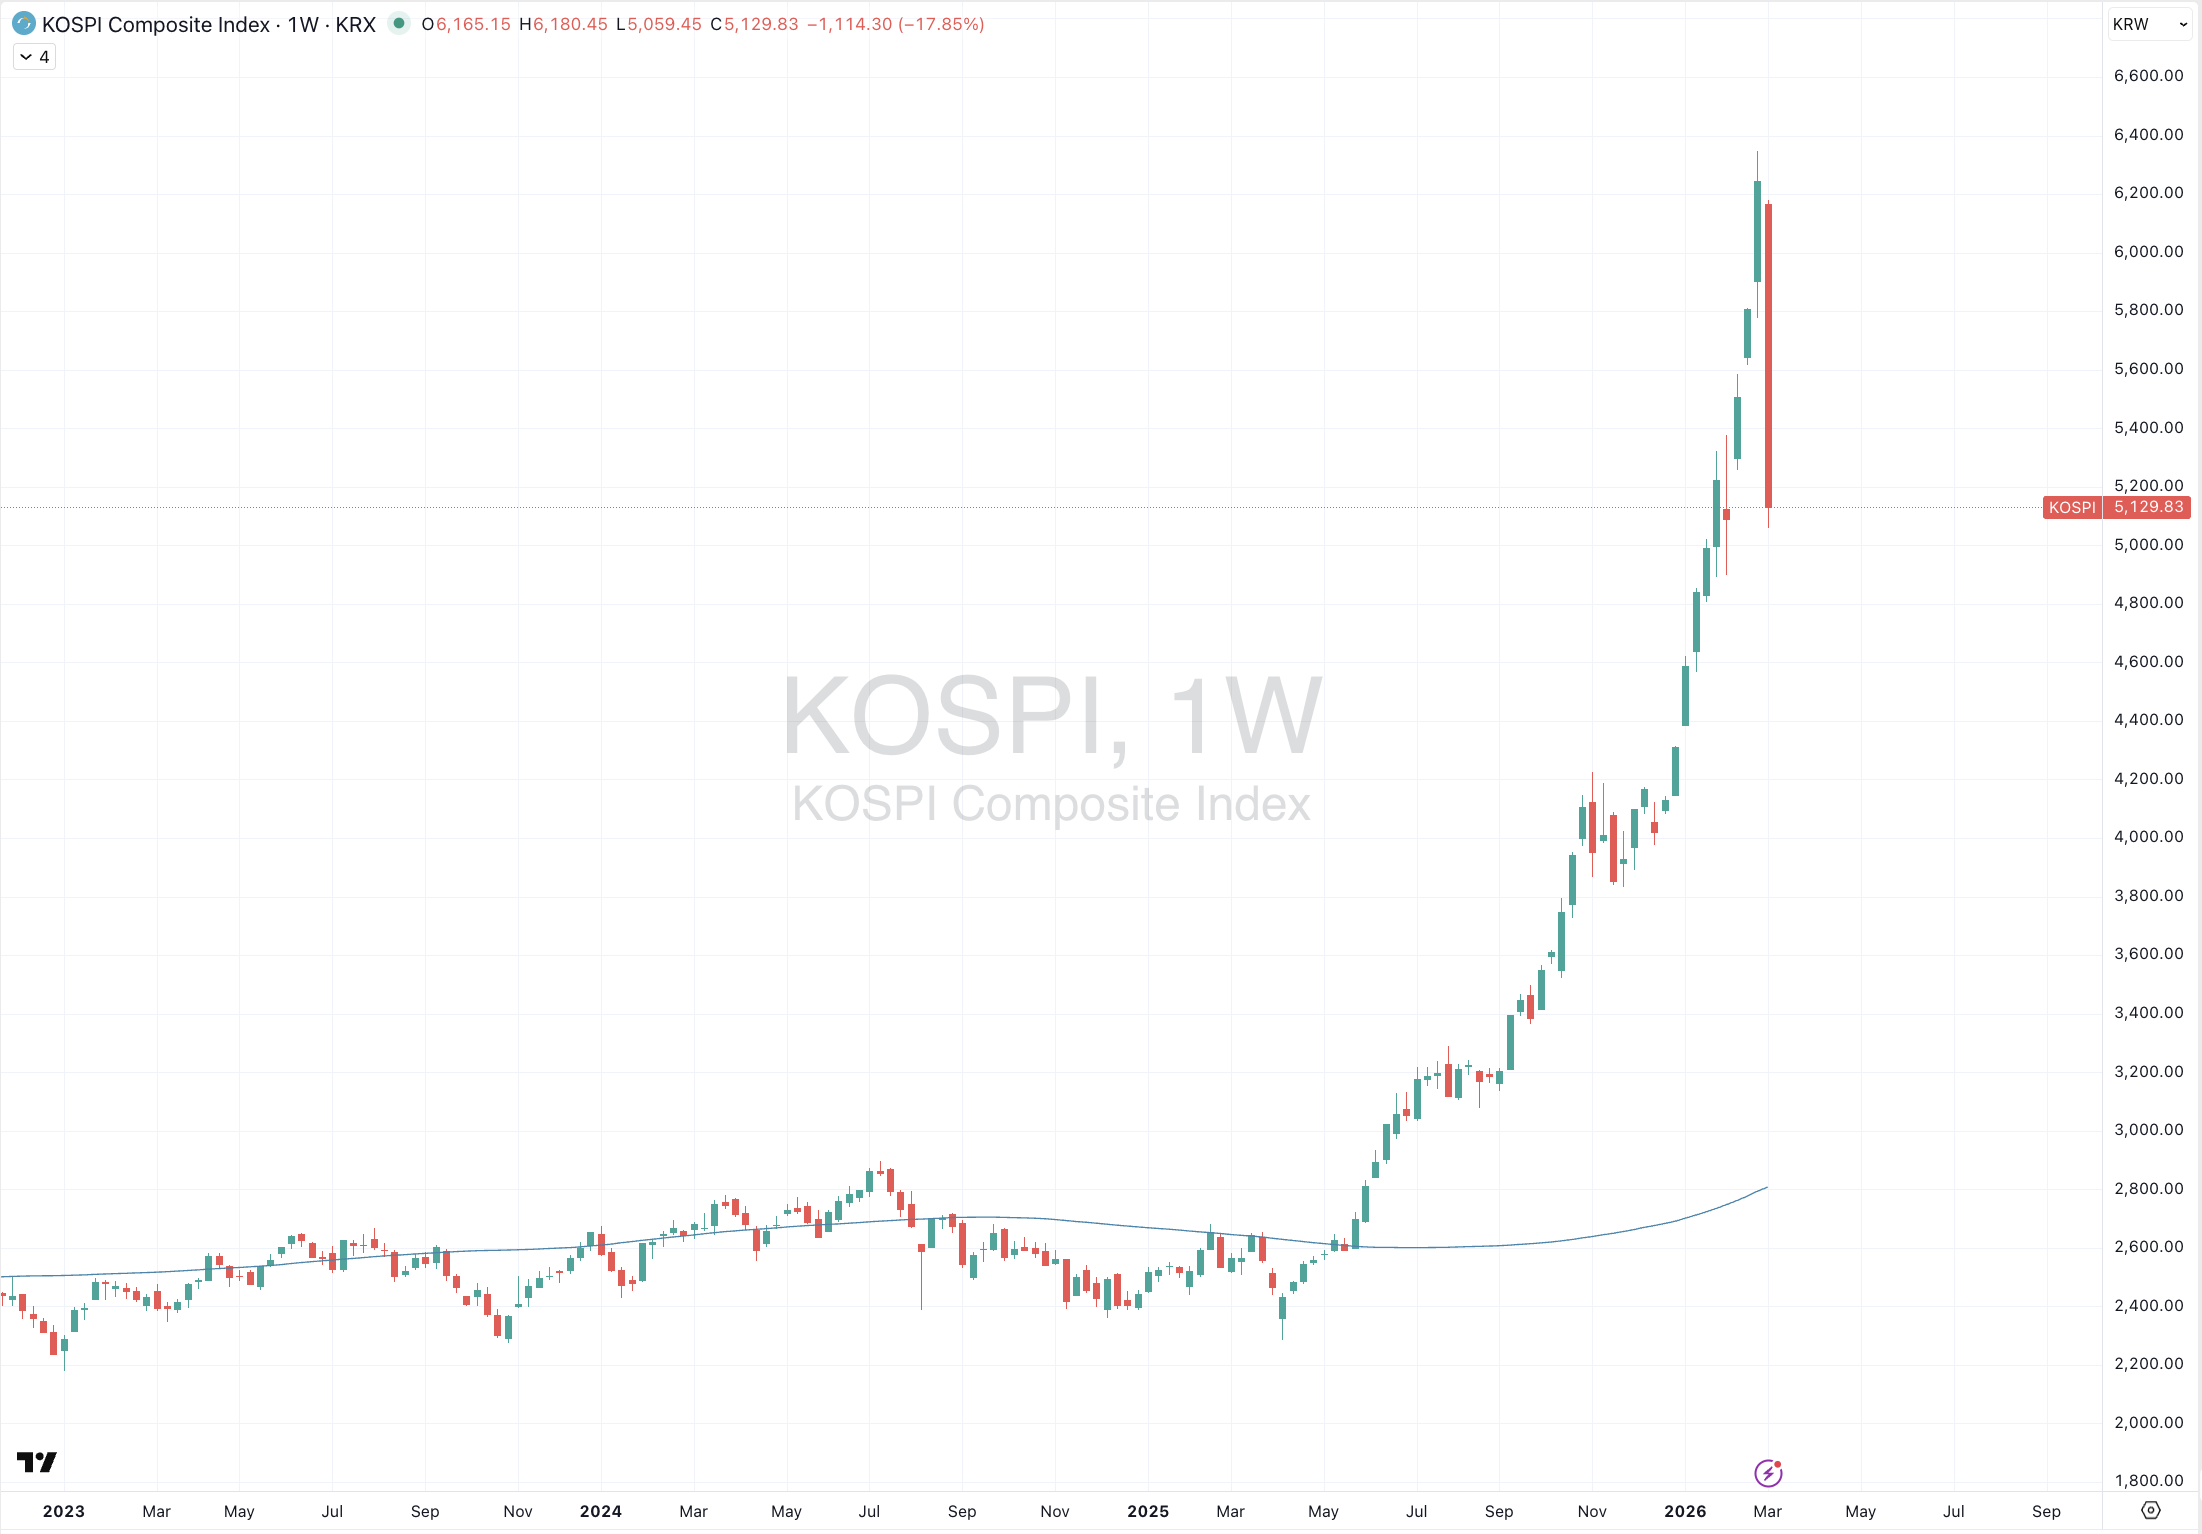
South Korea’s KOSPI Index *
Nikkei 225 Index *
South Africa’s SA40 equity Index *
And Thailand SET Index *
Extremes below the Mean (at least 2.5 standard deviations)
TBX
U.S. 3 year government bond yield
Copper/Gold Ratio
EUR/CHF
Oversold (RSI < 30)
Australian 10 year minus Aussie 2 year yield spread *
British 2 year government bond yield
London and CME Cocoa *
Sugar #16 *
EUR/AUD
JPY/AUD
USD/MXN *
USD/ZAR
The Oversold Quinella (Both Oversold and Traded at < 2.5 standard deviations below the weekly mean)
GBP/AUD
NZD/AUD *
Notes & Ideas:
Government bond yields fell.
The Australian 10 year minus 2 year spread, mean reverted.
While the same U.S. spread has fallen for 4 weeks.
The last of the Japanese yields fell from overbought territory.
Canadian and Kiwi 10 year yields have fallen for 4 weeks.
British 2’s along with European 5, 10 & 20 year yields have fallen for 5 weeks, as have Belgian, Danish and Dutch 10 year yields.
Equities were mixed.
Malaysia’s KLSE left overbought territory, while a few others moved into an overbought quinella.
The All World Developed-ex USA is working a streak of 14 weeks of higher consecutive closing prices.
CAC, DAX, Helsinki and TSX have risen for 4 straight weeks.
The OBX, SMI, FTSE 100 are in a 5 week winning streak.
While the ASX Financials fell and snapped its 4 week winning streak.
Thailand’s SET is in a 7 week winning streak and has risen 15% over the past 4 weeks.
The Nikkei 225 has returned 10% in the pats 4 weeks.
South Korea’s KOSPI has soared 21% in 3 weeks.
Brazil’s BOVESPA fell and broke a 7 week run.
The TA35 fell and ended 8 weeks of higher prices.
EGX & STI both fell and snapped their 9 weeks of advance.
The SOX snapped its 10 weeks of consecutive advance.
Commodities were active amongst a concentrated group.
Tin, Oils, Distillates, Platinum, Silver, Orange Juice and Corn were the notable gainers.
Cocoa, Coffee, Cocoa, Lumber, Tin and Uranium were amongst the decliners.
Coal isn’t overbought, this week.
Cocoa mean reverted.
Natural Gas has fallen for 4 weeks.
Soybeans and Gold (across various currencies) have risen for 4 weeks.
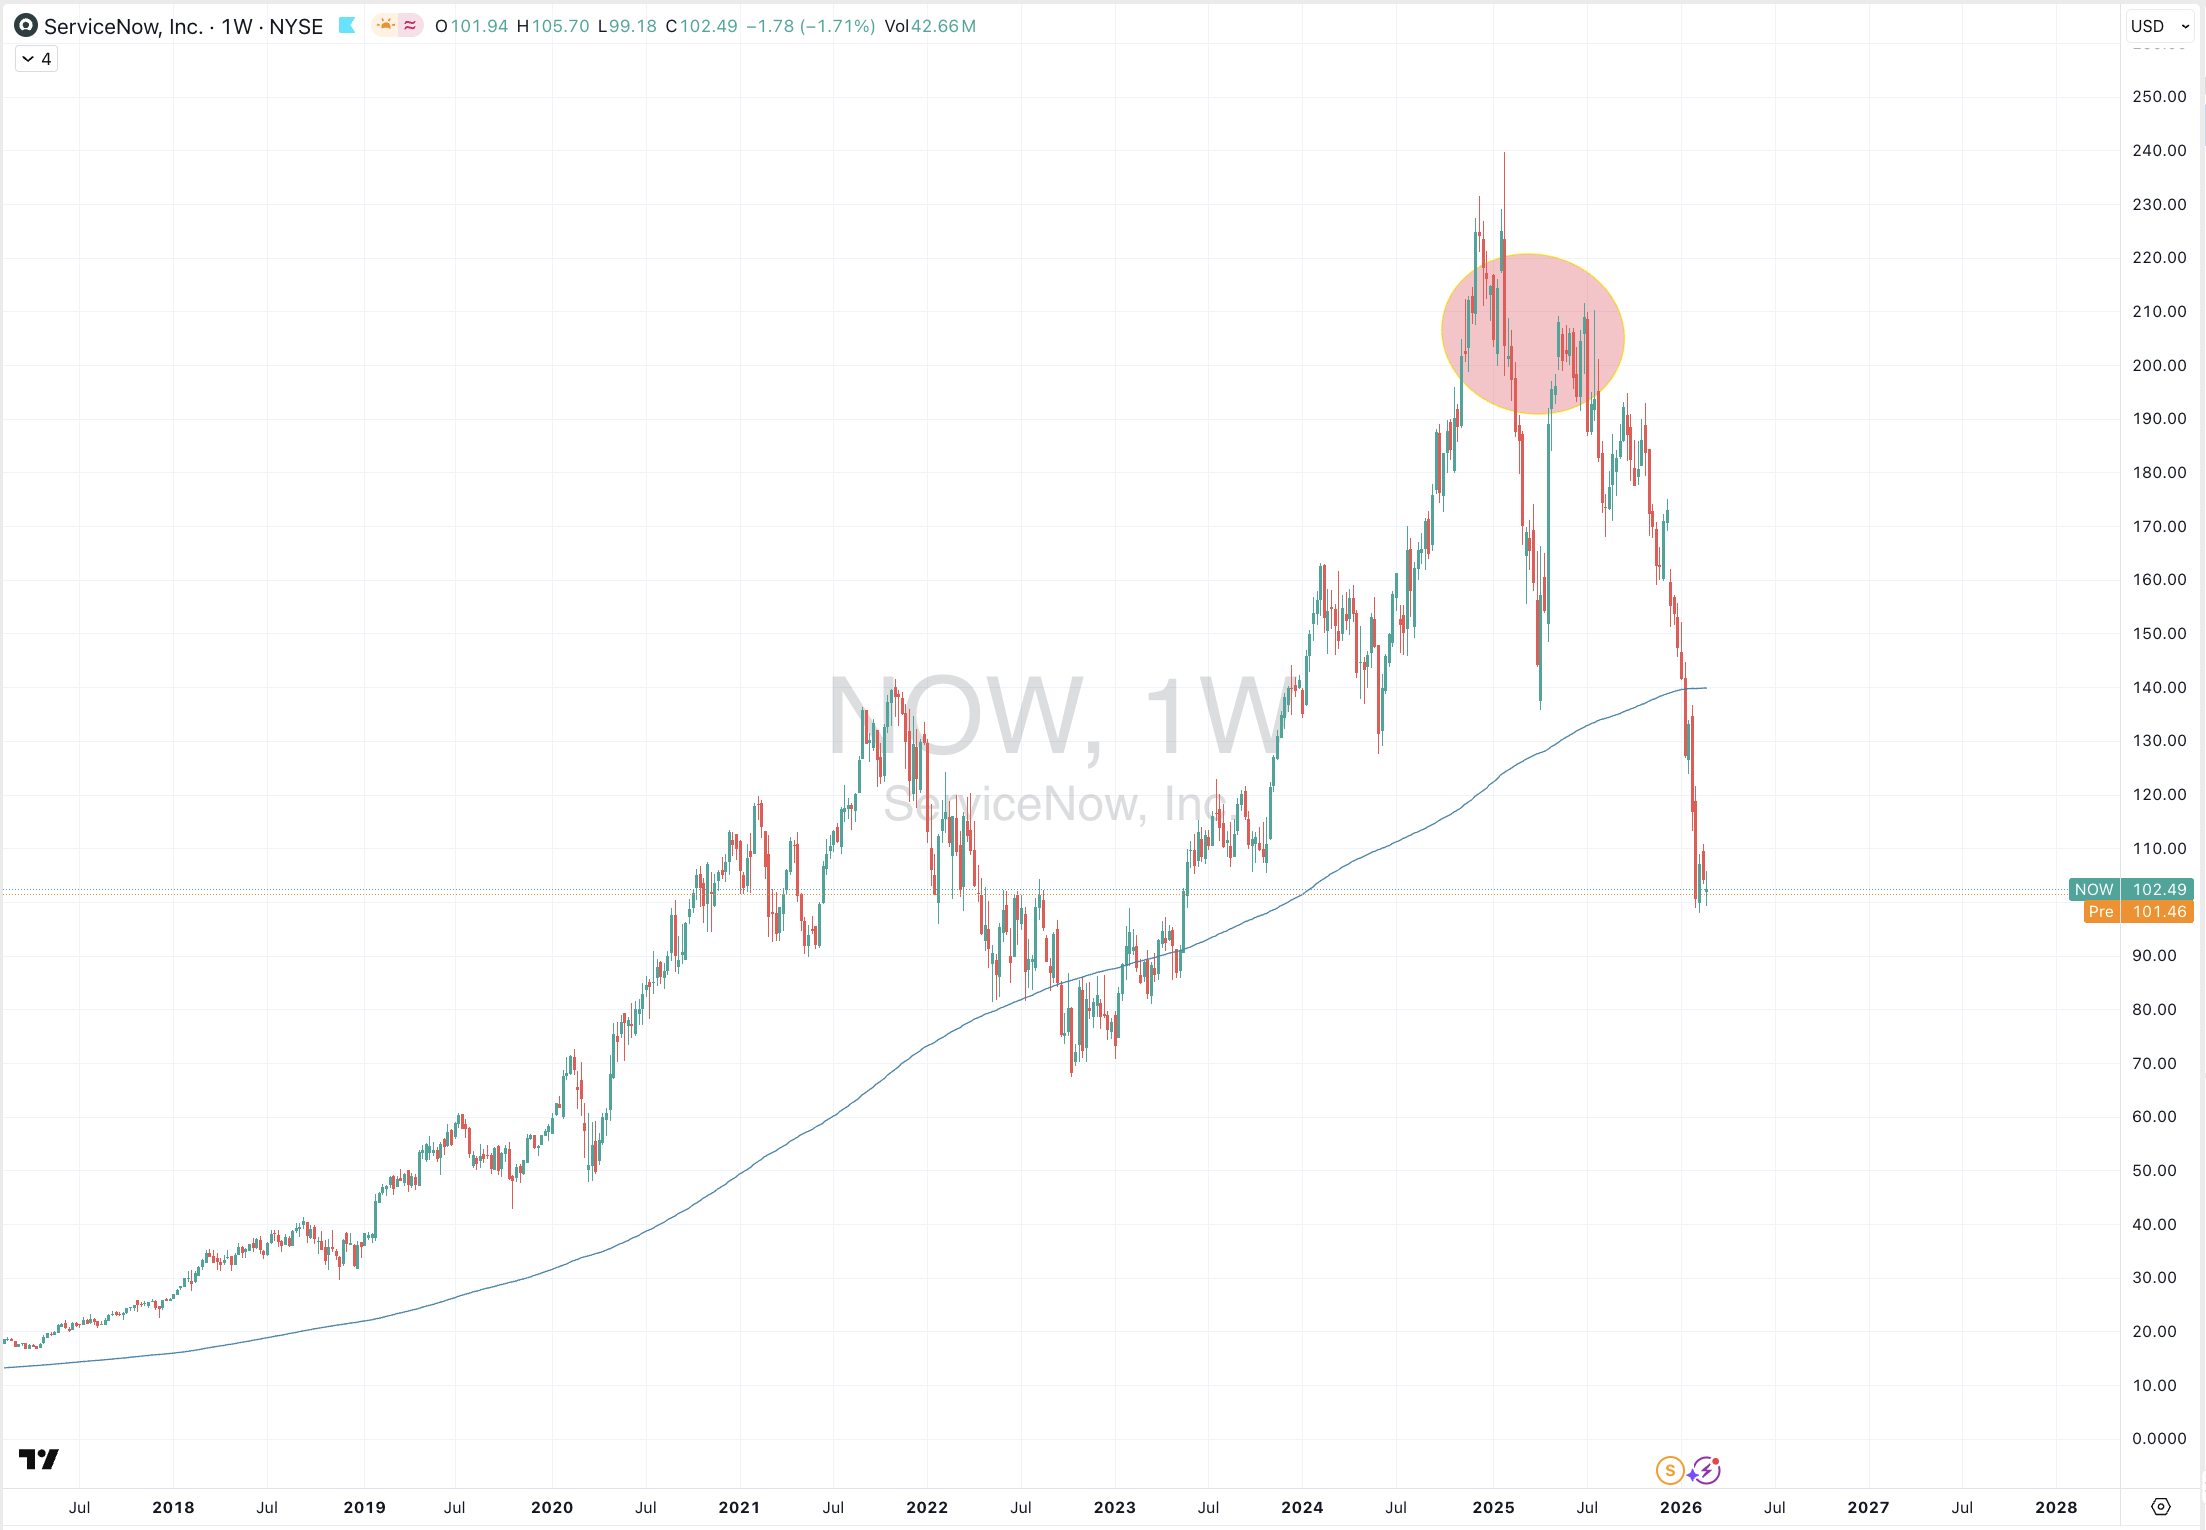
U.S. HRC Steel is in a 6 week winning streak.
The Copper/Gold Ratio has closed at its lowest level since February 1990 and it’s Monthly oversold reading is worth noting.
Richards Bay Coal fell and snapped a 7 week winning streak.
And U.S. Gulf Urea prices have risen for 12 weeks.
Currencies were busy.
Nearly all Yen pairs have left the extremes.
AUD/CAD, AUD/USD and AUD/ZAR have risen for 5 weeks.
AUD/SGD has closed higher for the 6th consecutive week.
AUD/GBP and AUD/IDR has climbed for 7 weeks.
AUD/EUR in 9 week rising streak.
CAD/GBP has risen for 4 weeks.
GBP/AUD is an oversold quinella and competed a mean reversion.
While the AUD/JPY fell and snapped its 5 week winning run.
BRL/USD fell 0.1% which was enough to break its 6 week advance.
CHF/AUD rose to break is 7 weeks of decline.
And the Filipino Peso has climbed for 4 weeks against the USD.
The larger advancers over the past week comprised of;
Bloomberg Commodity Index 1.7%, Brent Crude 1.8%, Baltic Dry Index 4.8%, Lean Hogs 2.2%, Copper 2.7%, Heating Oil 4.8%, U.S. HRC Steel 2.3%, Tin 24.1%, Nickel 2.8%, Orange Juice 6.8%, Platinum 9.1%, Gasoil 2.7%, Silver in AUD 10.3%, Silver in USD 10.8%, Gold in AUD 2.9%, Gold in CAD 3.1%, Gold in CHF 2.4%, Gold in EUR 3%, Gold in GBP 3.3%, Gold in USD 3.3%, Corn 2.5%, Rice 2.2%, Soybeans 1.5%, Wheat 1.9%, Shanghai Composite 2%, All World Developed (ex USA) 1.8%, MIB 1.6%, TAIEX 5.4%, KOSPI 7.5%, Nikkei 225 3.6%, PSE 2.3%, SA40 4.8%, SET 3.7%, TSX 1.5%, FTSE 100 2.1%, Vietnam 3.1%, XBI 2.1%, XMJ 7.4% and the ASX Small Caps rose 1.8%.
The group of largest decliners from the week included;
Australian Coking Coal (1.8%), Rotterdam Coal (1.7%), LME Cocoa (10.4%), CBOT Cocoa (19.1%), Arabica Coffee (1.7%), Lumber (3.5%), Cattle (4%), Newcastle Coal (1.7%), Natural Gas (3.5%), Uranium (3.5%), Oats (1.5%), KBW Banks (5.9%), China A50 (2%), EGX (2.9%), S&P Small Cap 600 (1.5%), KLSE (2.1%), KRE Regional Banks (7.1%), KSE (3%), Nifty (1.5%), OMX Copenhagen (4.7%), Sensex (1.8%), SOX (2%) and Israel’s TA-35 fell 2.5%.
March 1, 2026
By Rob Zdravevski
rob@karriasset.com.au