Zoom adds the value of a Telstra in a single day
September 2, 2020 Leave a comment
Trying to hear what's not being said
September 1, 2020 Leave a comment
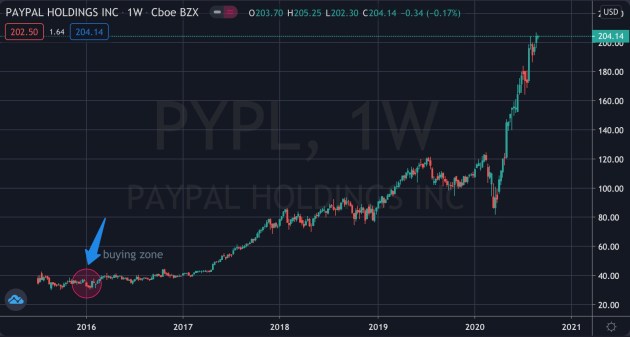
Our global client portfolios have owned PayPal (PYPL) for over 4 years, soon after the company spun out of eBay in 2015.
On average, clients paid $33.60 for the stock.
In late May 2020 we harvested a third of the position and yesterday we sold the remaining holding at $204.00 per share because subjectively, it seems this is as good as it’s gets across a host of factors.
PYPL is also mimicking the activity of the Nifty 50 stocks of 1960’s and early 70’s where the phenomenon of buying growth stocks at any price became the norm.
Fundamentally, PYPL now has a market cap of $240 billion, revenue of $18.2 billion and EBIT of $2.7 billion.
PayPal is trading on 13 times revenue and an astonishing 89 times its profit …I can’t help think that its priced for perfection.
In other words, how much more return are we trying to squeeze out from here on?
So why sell now and not earlier…
My technical analysis indicators now also suggest a host of stretched extremes where it seems that the odds for further gains may be laboured.
I asked myself if I’d be a buyer of PYPL with “new money” at these prices? My answer was “No”.
The risk/reward doesn’t seem to stack up, ……so then, why continue owning the stock, if I’m not prepared to buy more of it ?
September 1, 2020
rob@karriasset.com.au
September 1, 2020 Leave a comment
Below is a continuing chart I’ve been posting for a while to disprove the illusion that the Aussie equity market is NOT screaming to new highs.
For the past 3 months, the ASX 200 has been trading sideways and today’s headlines from the Australian Financial Review following todays close of business was…..
“ASX wipes out most of August gains in single session.
The S&P/ASX 200 dropped 1.8 per cent on the first day of September, falling back to where it traded on August 3”
It’s a bit sad that the first day of September’s trading erased the WHOLE month of August’s efforts.
In fact, the ASX 200 is trading back to where it was on June 3rd, 2020.
The age of the stock picker is back….
September 1, 2020
by Rob Zdravevski
rob@karriasset.com.au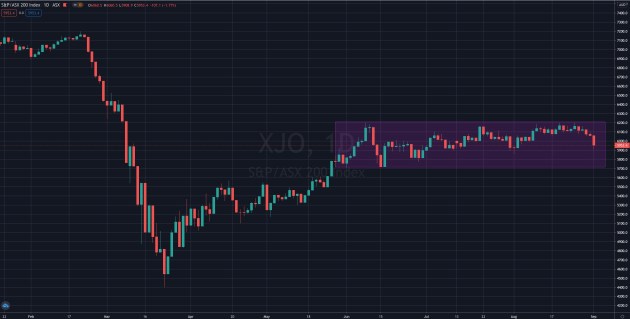
September 1, 2020 Leave a comment
Following todays earlier note about the AUD trading in Overbought territory, the “basket” US Dollar Index (DXY) inversely registers a more important Oversold reading.
Why is the DXY news more important?
Prices tend to not stay Oversold for too long, whereas they can remain overbought for that little bit longer.
Alas, the chart below shows the DXY Oversold this week, for only the 7th time in the past 13 years.
All this talk of USD weakness may have reached its nadir ?
And in case you’re wondering, the USD (DXY) Index is a measure of a basket of currencies and their trading relative to the U.S. Dollar. The weighting of the index to each currency is; EUR 57.6%, JPY 13.6%, GBP 11.9%, CAD 9.1%, SEK 4.2% and CHF 3.6%
#dxy #fx #usd #currency #oversold
September 1, 2020
by Rob Zdravevski
rob@karriasset.com.au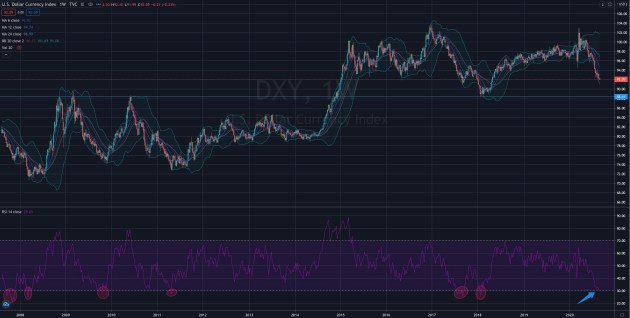
September 1, 2020 Leave a comment
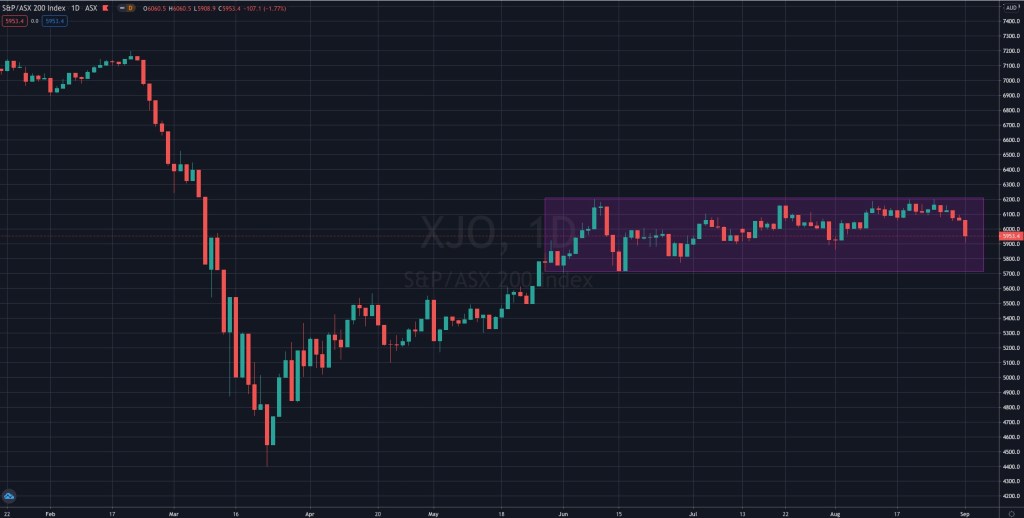
Below is a continuing chart I’ve been posting for a while to disprove the illusion that the Aussie equity market is NOT screaming to new highs.
For the past 3 months, the ASX 200 has been trading sideways and today’s headlines from the Australian Financial Review following todays close of business was…..
“ASX wipes out most of August gains in single session.
The S&P/ASX 200 dropped 1.8 per cent on the first day of September, falling back to where it traded on August 3″
It’s a bit sad that the first day of September’s trading erased the WHOLE month of August’s efforts.
In fact, the ASX 200 is trading back to where it was on June 3rd, 2020.
The age of the stock picker is back….
September 1, 2020
by Rob Zdravevski
rob@karriasset.com.au
September 1, 2020 Leave a comment
I feel markets are at another acute point.
It’s not about doom but rather to position for the opportunity.
In this note, I’ll start with the AUD and USD.
Since Buying AUD in the depths of March 2020, I’ve been advising clients to sell AUD against the USD in a tiered fashion at 0.66, 0.69 and 0.71.
With a weaker USD, we have also seen a commensurate advance in commodity prices. Note the link ?
I’ve been banging on about overbought readings recently each time they were registered on the “daily” charts, BUT now, significantly, we are seeing “Weekly” extremes.
Please take a look at the AUD/USD chart below and my annotations within it.
It’s only the 10th time in past 18 years that we have seen this and it’s the first time in 9 years.
I’m not calling a crash and of course and 0.7750 is entirely possible but I want to identify that such extremes are not common. Buying AUD at this end of the pendulums arc warrants thought to the probability of mean reversion.
September 1, 2020
by Rob Zdravevski
rob@karriasset.com.au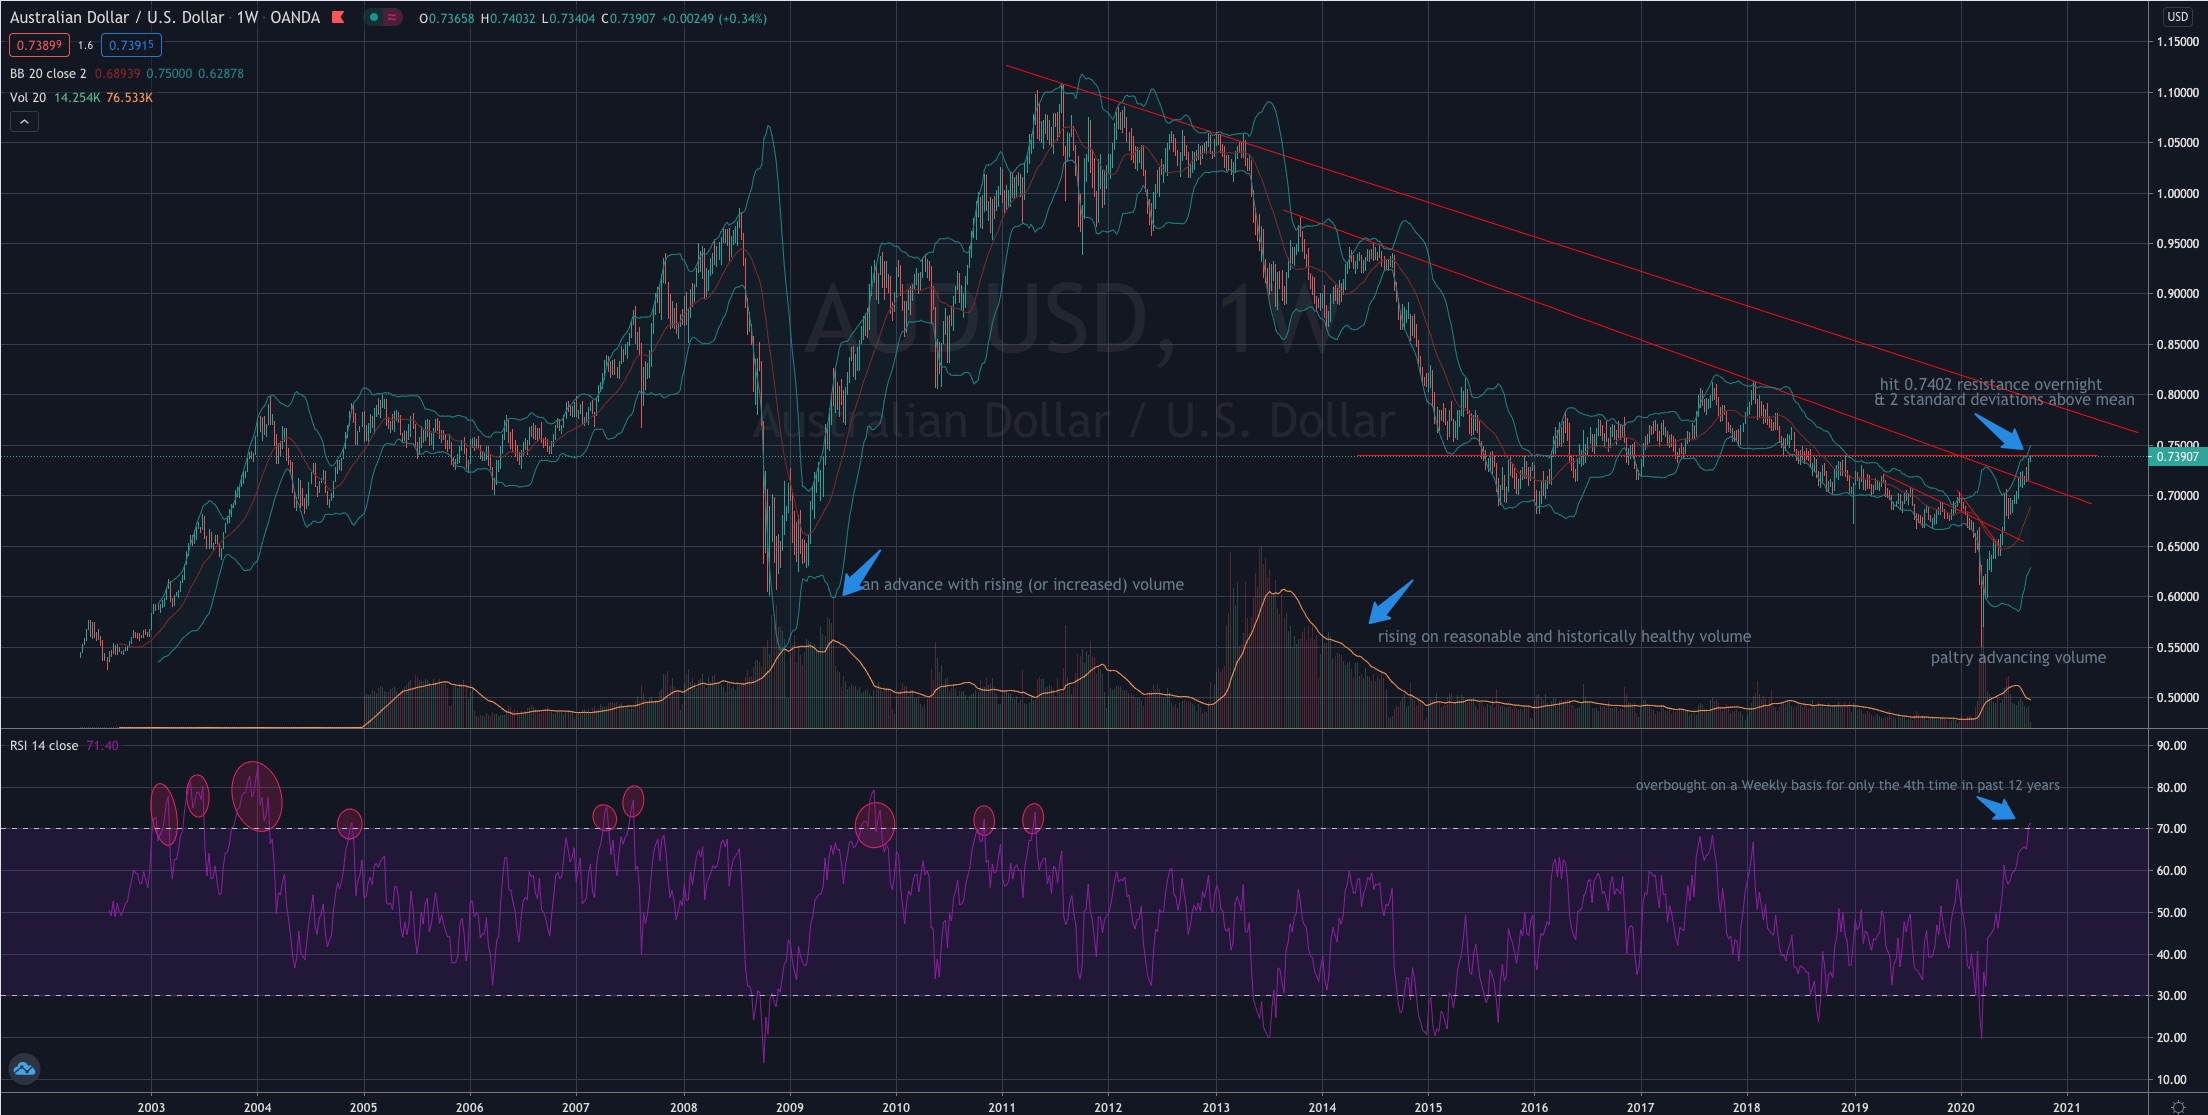
August 31, 2020 Leave a comment
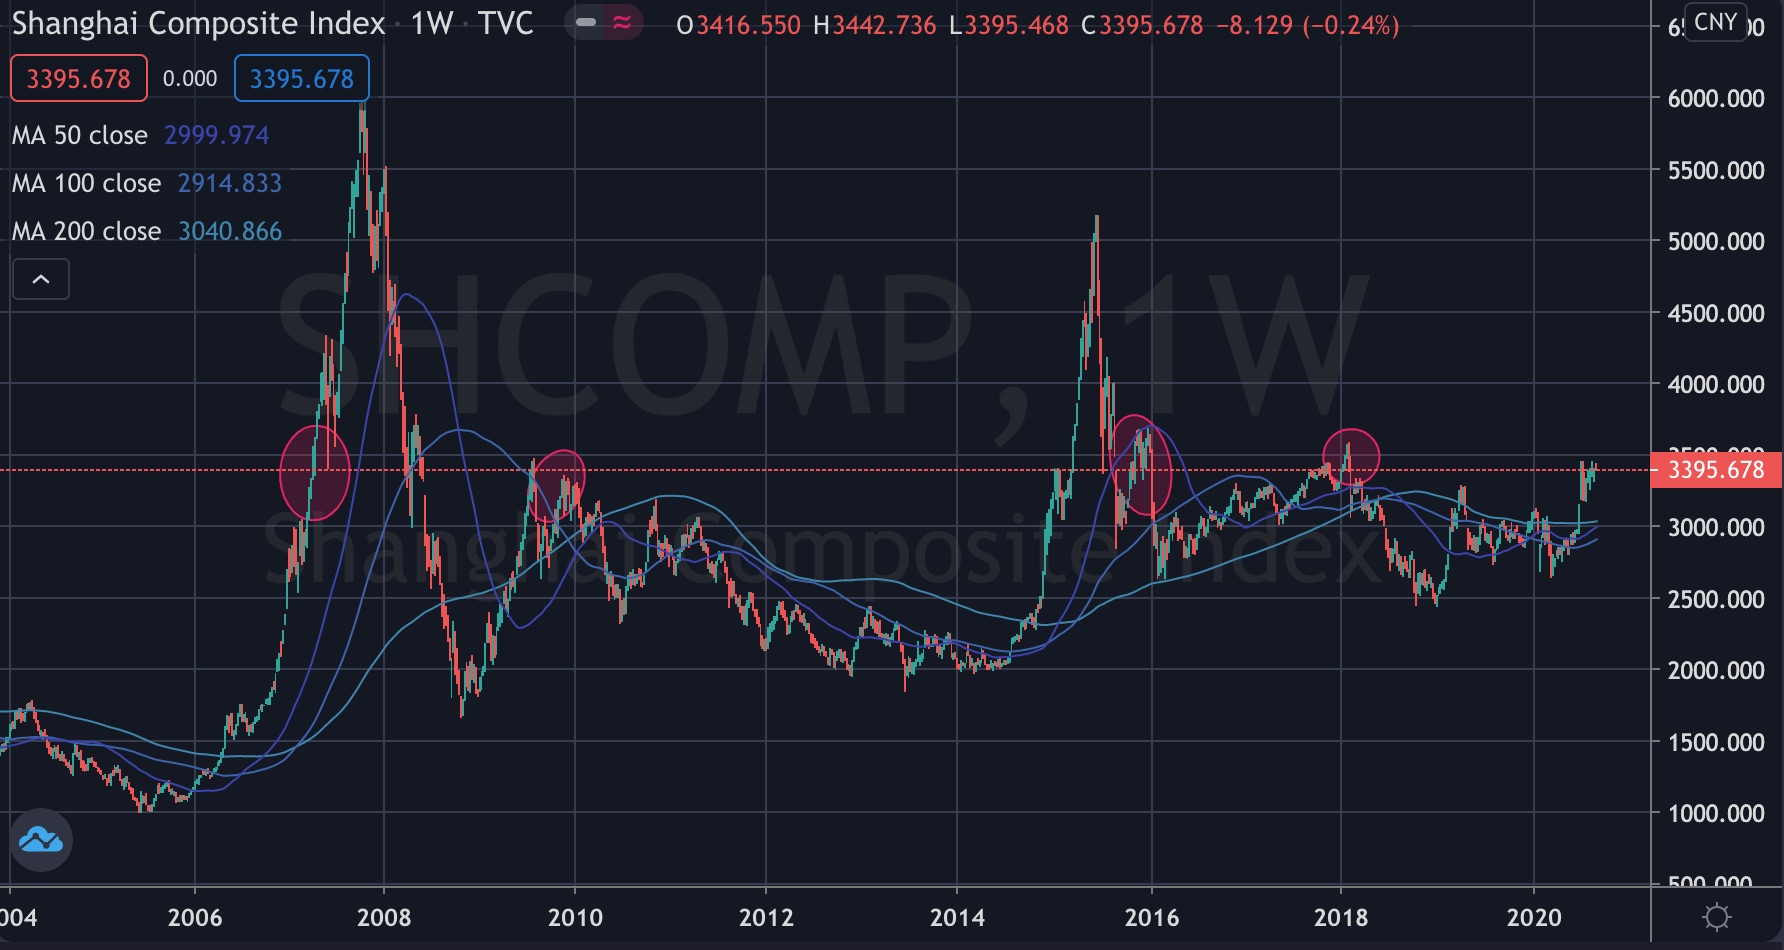
The chart below shows the Shanghai Composite today is trading at the same price it was in 2018, 2015, 2010, 2009 & 2007.
More so, it has been a flat market for the past 4 years,
In the interim, I expect that market to come back a little, perhaps to 3,100 (about 10% decline), while my indicators are confirming the longer trend is higher.
August 31, 2020
by Rob Zdravevski
rob@karriasset.com.au
August 31, 2020 Leave a comment
Re-posting this one…
The De-equitisation theme is still intact.
In the 2000’s, there were approx. 8,000 listed companies on U.S. exchanges.
Now, that number is about 4,000.
More and more capital being deployed into fewer and fewer available listed equities.
August 15, 2020
by Rob Zdravevski
rob@karriasset.com.au
August 30, 2020 Leave a comment
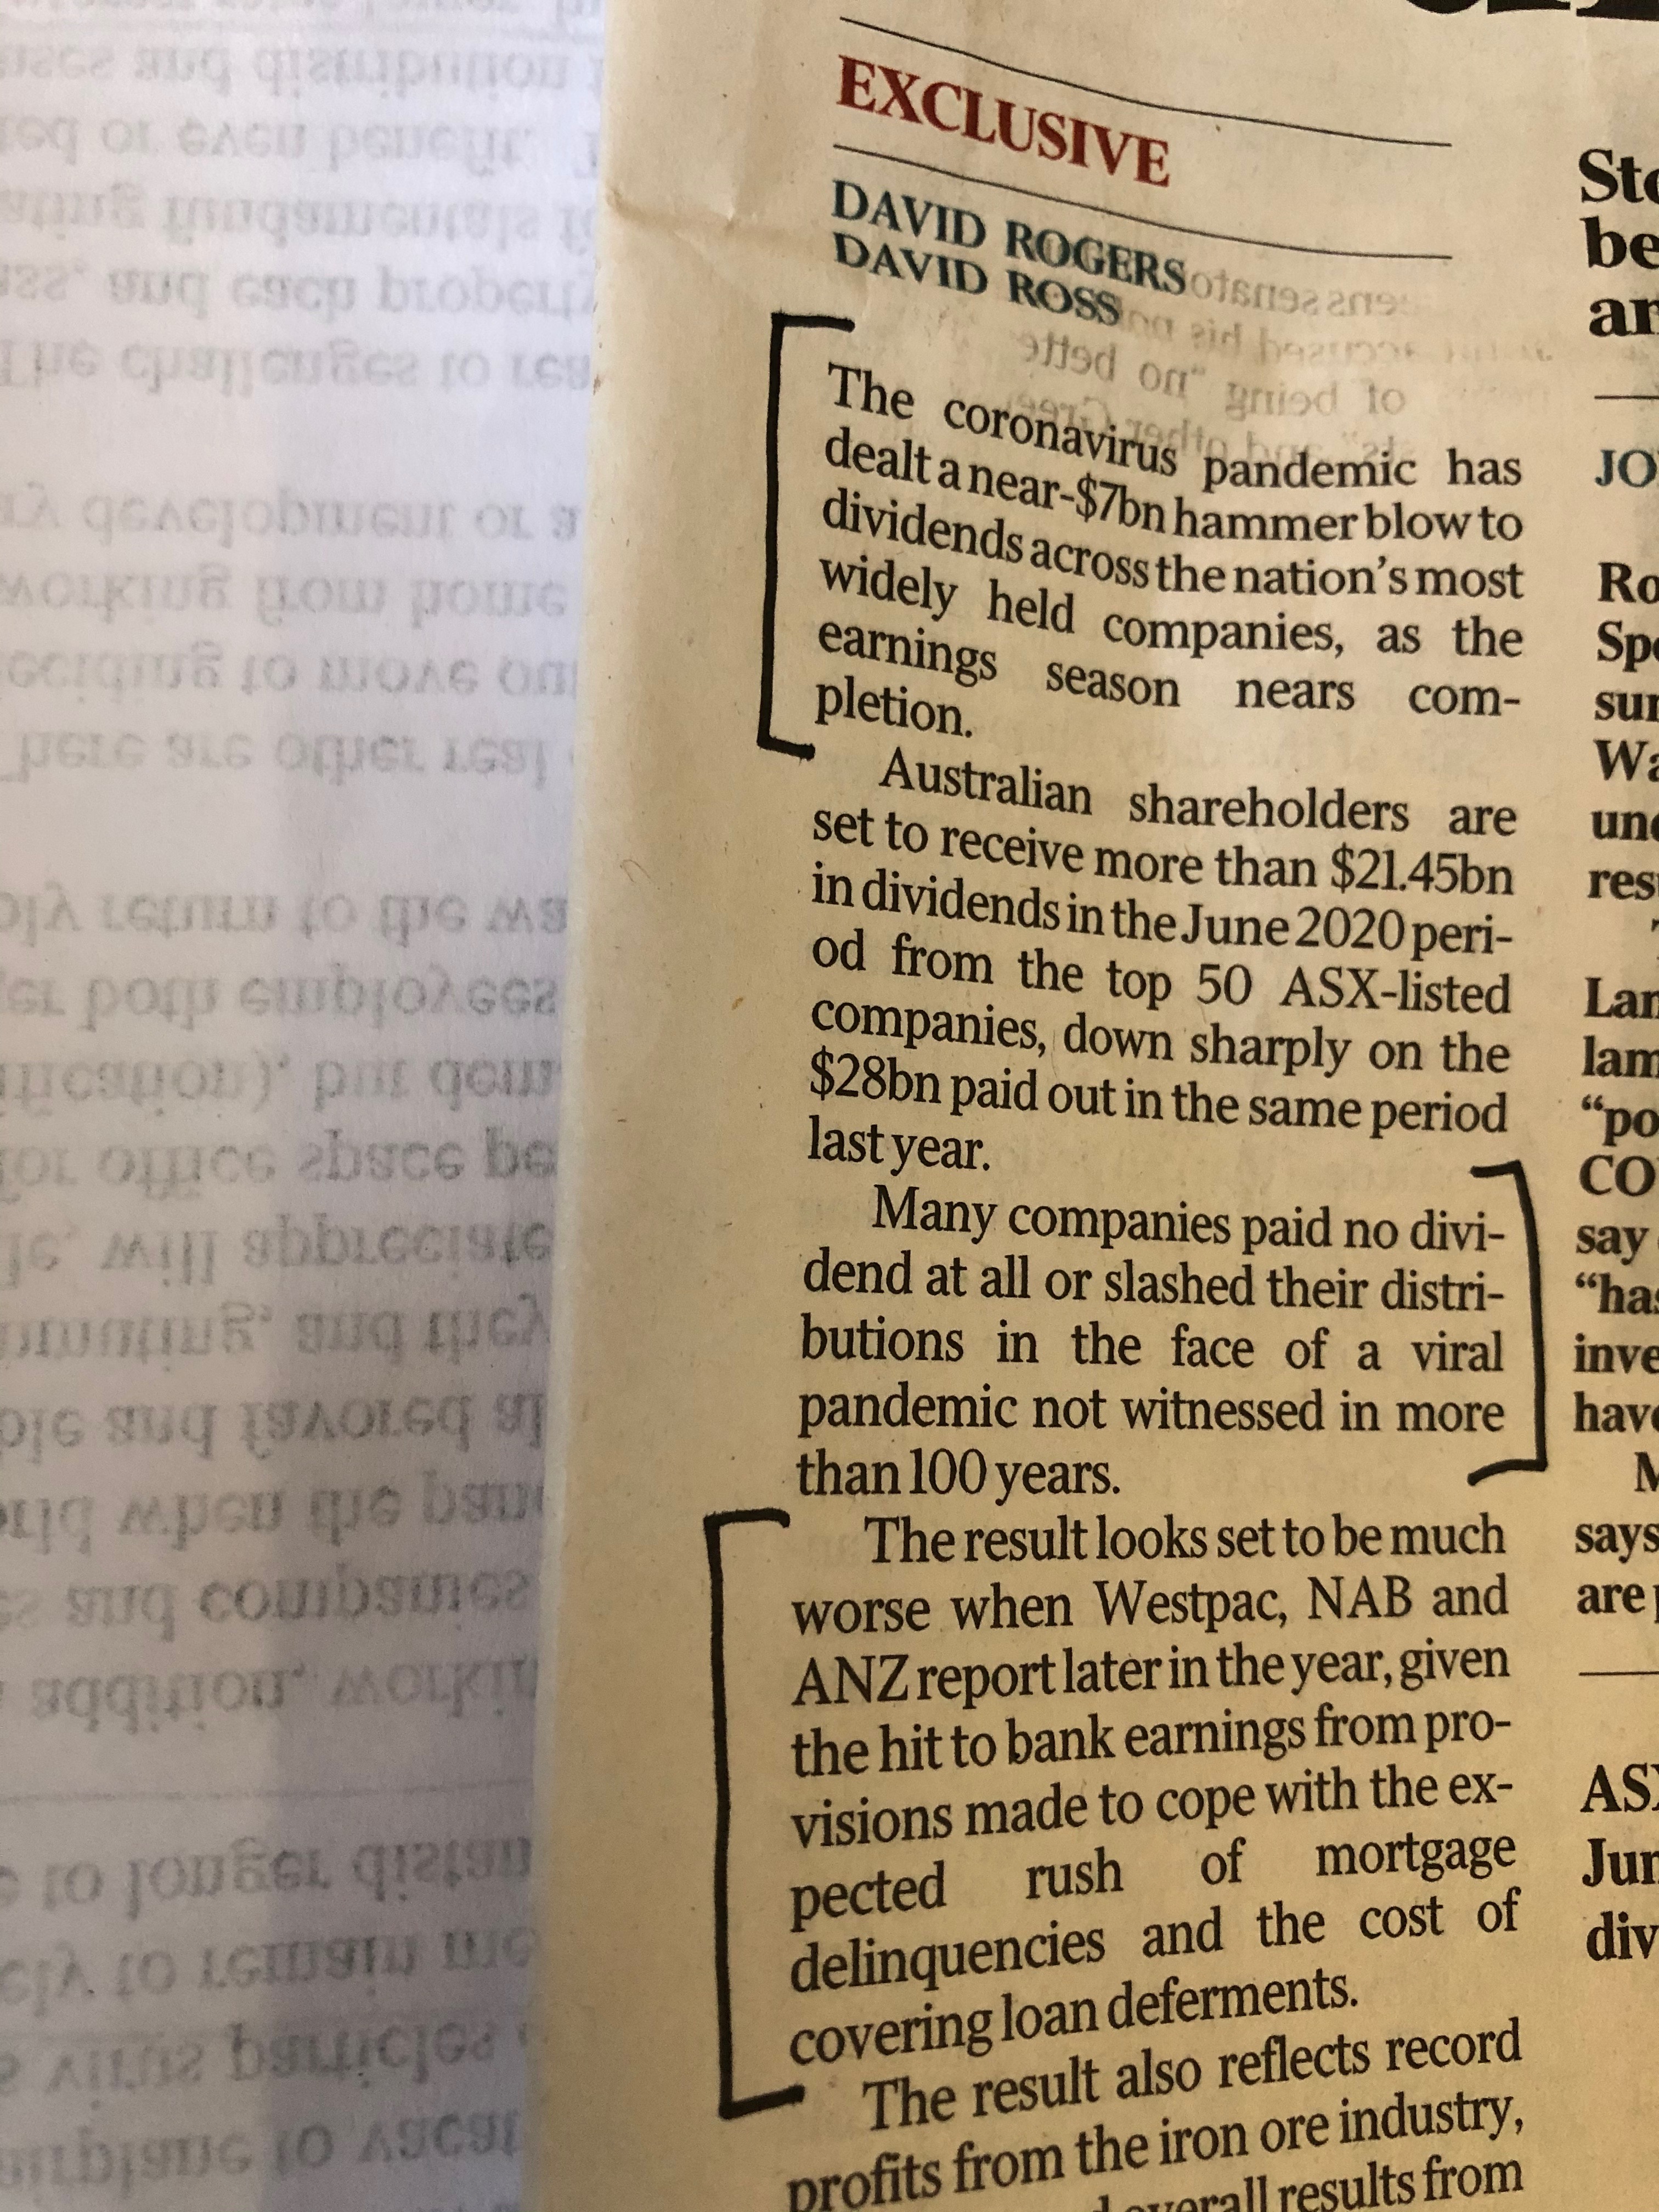
From this weekend’s The Australian newspaper, this story outlines the facts but behind it is the lament of retail shareholders ire that they’re income is being crimped.
It’s high time those investors learned and their advisors teach them about the notion of “total return”.

It’s market cap now is US$129 billion.
Let’s not fuss about its valuation.
It just doesn’t matter that the company is trading on a P/E of 173 or 50 times revenue (2022 consensus estimates).
This is about context.
Last night, in a single trading session, Zoom added a market capitalisation of US$24 billion.
This is equivalent to the whole value of Telstra or the whole of Barclays Bank or all of Ford Motor Company’s market cap.