Readers may have picked up that I’m favouring the equity of cyclicals, industrials and businesses which are ‘asset-heavy’.
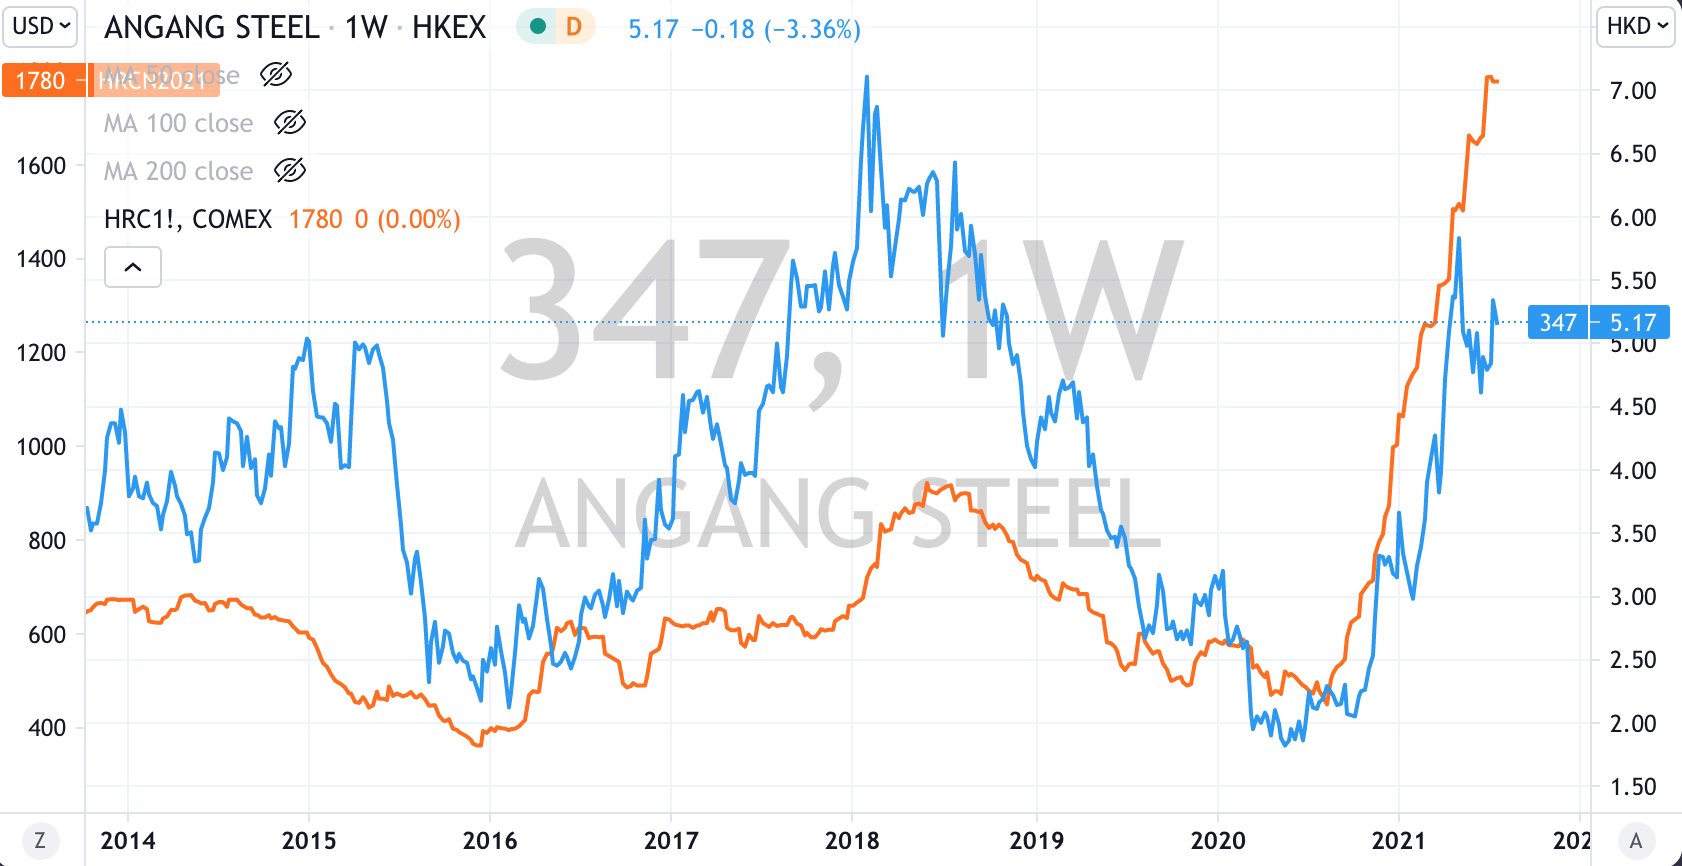
Steel is one of them….I’m conscious that I’m possibly late to the party (I didn’t see this move coming) as you can see (in the chart below) by the mesmerising quadrupling of the price in Hot Rolled Coil (HRC) Steel.
When I overlay a stock such as Hong Kong listed, Angang Steel, which is traditionally well correlated to the HRC price, it’s recent divergence from this ‘marriage’ is making me think if there is an investing opportunity…..but I haven’t got an opinion yet.
More work needs to be done but just sharing what is crossing my mind.
Then 6 months later (only 2 weeks ago) he suggests that Bitcoin should crash to $10,000.
Scotty, mate, versus your $400,000 call, that’s comparable as saying it’s worthless.
He probably should be shown the door.
To be clear, I’m no fan of cryptocurrency. I write about as a speculative instrument (notice, I’m not even calling it an asset) and use it assess risk and the temperature of the fluffy end of the market.
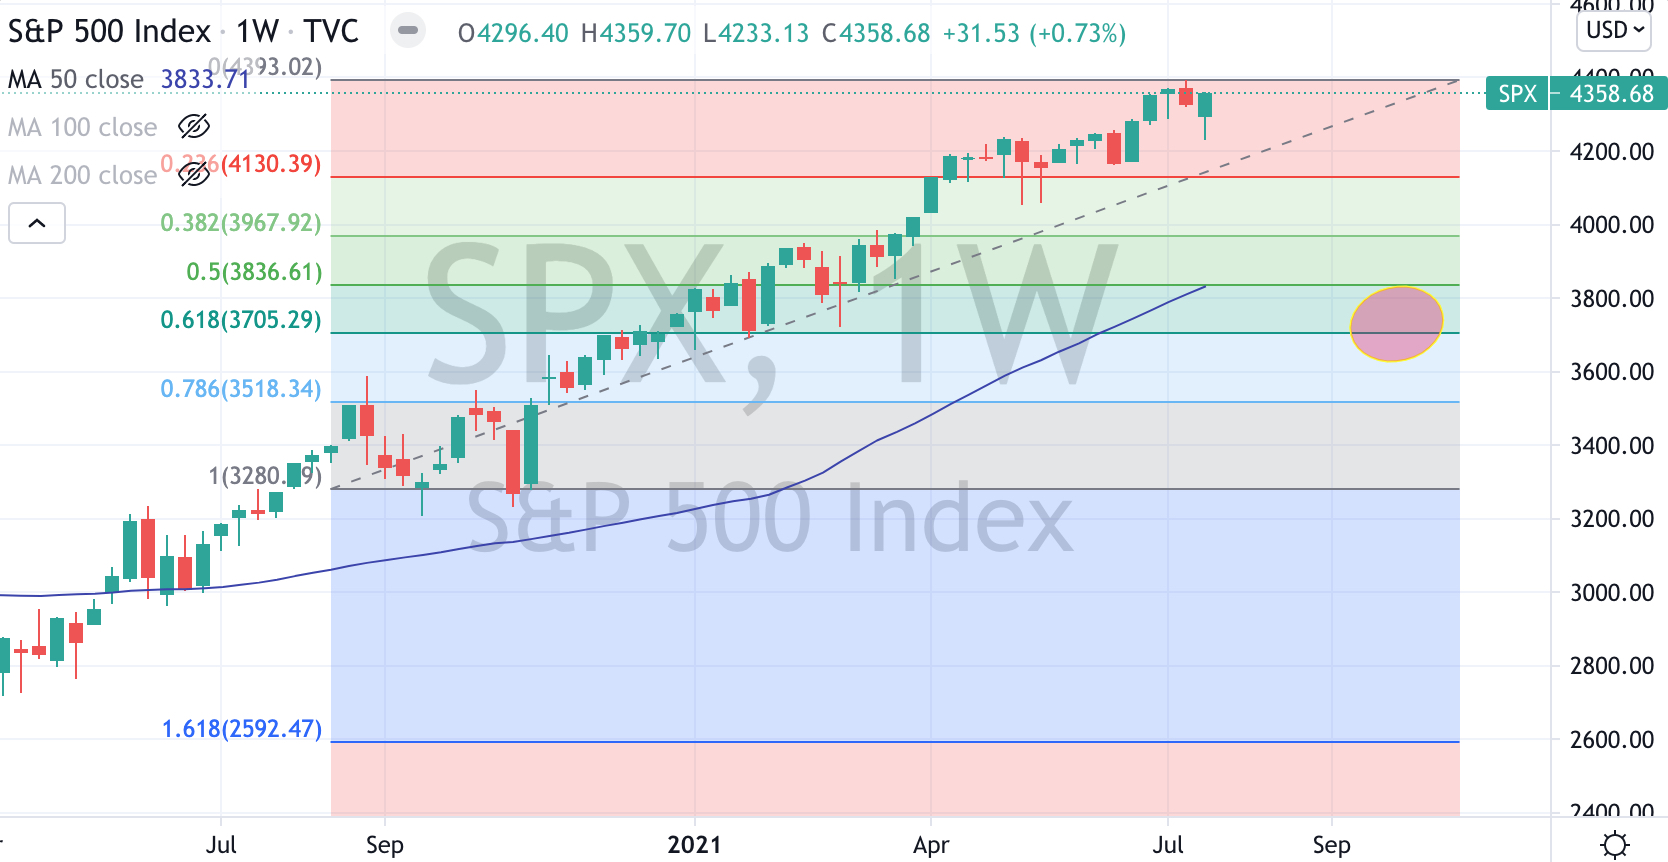
Today, Scott makes a call that the S&P 500 will fall 15% by September or October and barely below its 50 week moving average.
Just for kicks, I disagree for various reasons (p.s. I don’t need to make a wager with him, it’s not a pissing match)……but that’s hardly a ‘ballsy’ call for the investing boss of a firm with $270 billion under management.
A 15% call merely brings the S&P 500 to its March 1st level. It retraces 62% of its 33% rally from November 1, 2020.
This is not a character assassination, but it should make many question where and how their money is being invested and managed.
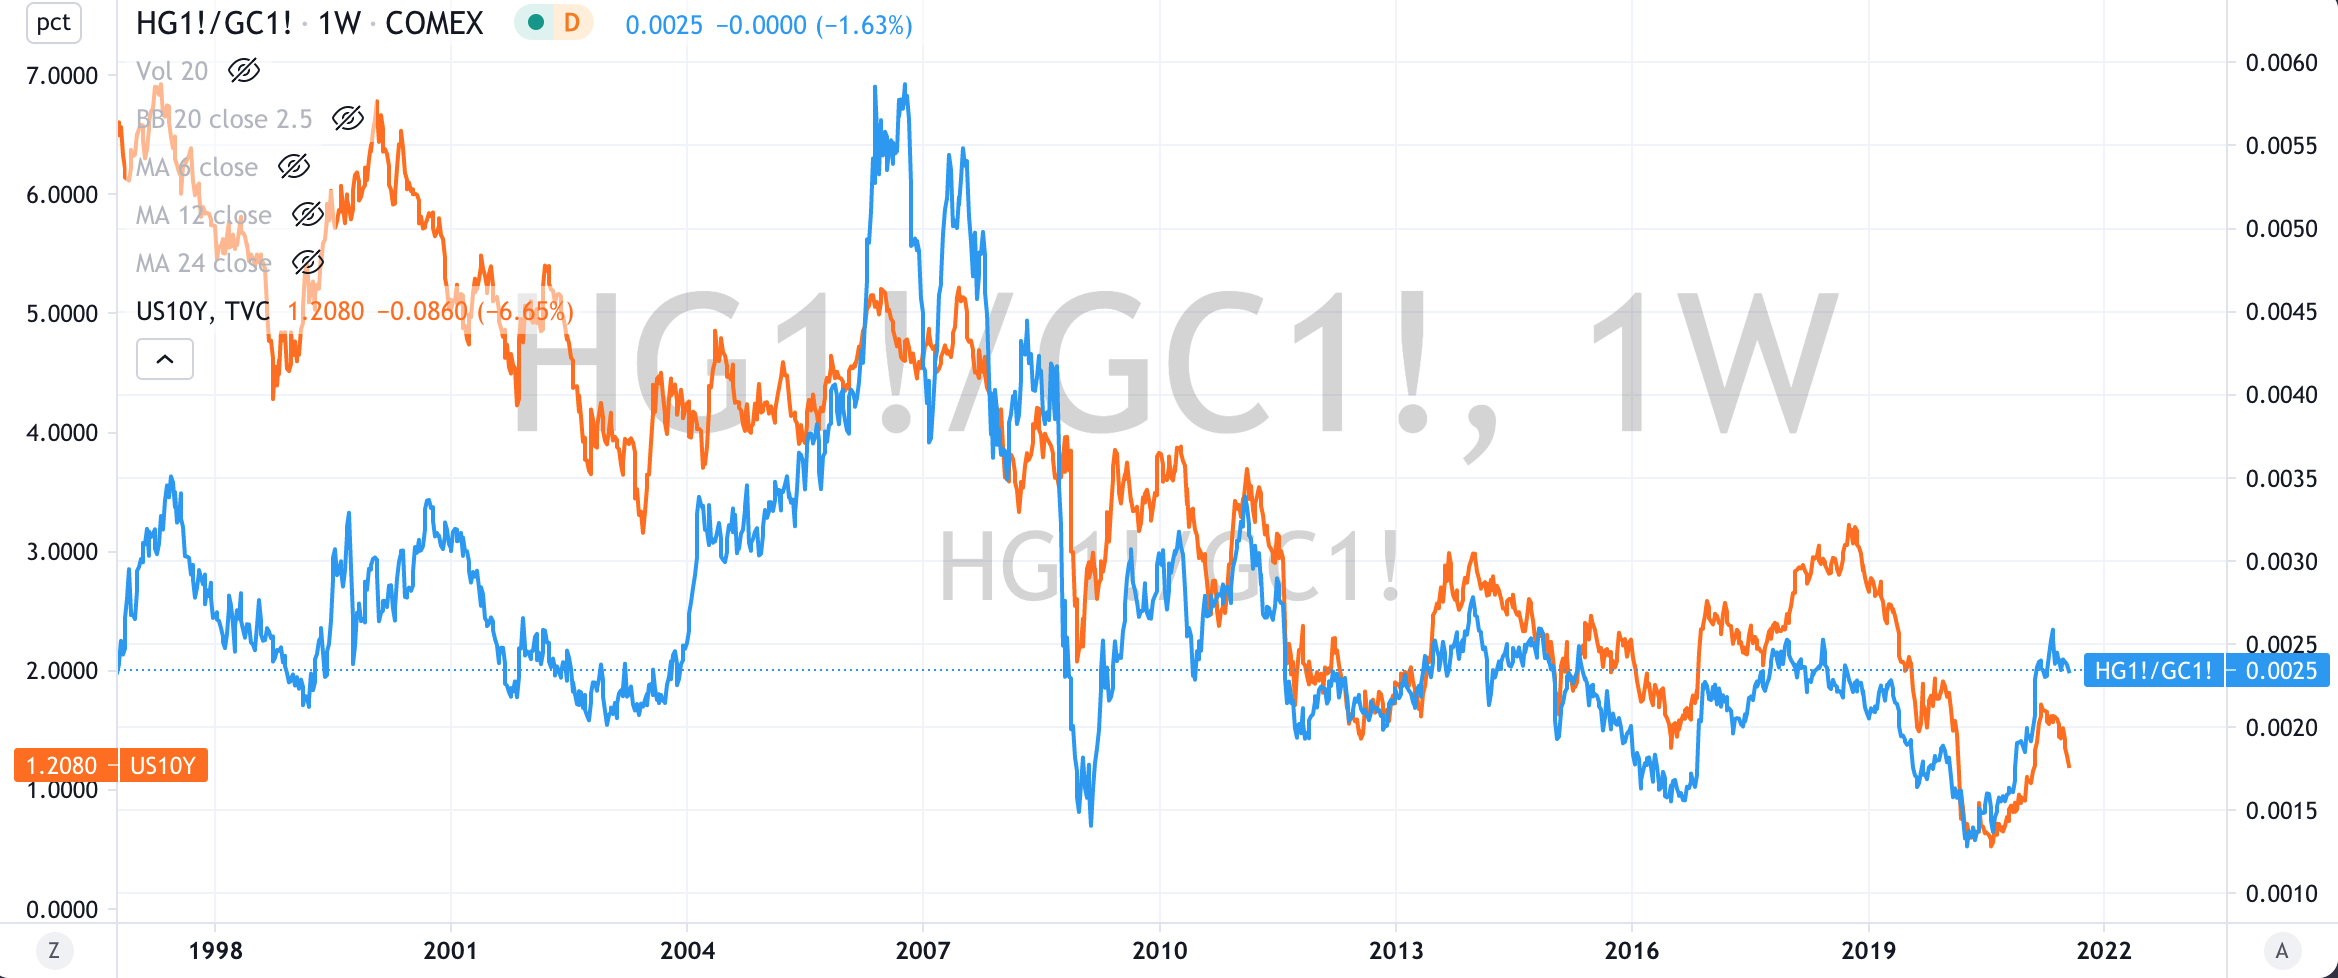
Today, the short-term direction of the Copper/Gold Ratio has been down and so the 10’s (and S&P 500) have mimicked that.
The longer trend upward trend of the Copper/Gold Ratio remains intact.
Where this ratio trades to and its effect on the 10’s will determine the size of, and where the allocation of capital moves to.
Separately, (on a weekly basis) the 10’s have traded down to 3 standard deviations below its mean. Such a 3-sigma event has foreshadowed higher equity prices.
It’s at an acute point, however the equities bull market continues.
Brent Crude has fallen 12% since my note (3 weeks ago) called a peak.
Last night’s 6% decline (to $68.75) suggests and adds a little more strength to the downward trend.
The two links below discuss my bias for lower prices.
For now the $62 mark is a spot to watch and certain technicals over the coming weeks will help me decide if a new Long position is established there or around the $57 level.
The following assets (on a weekly timeframe) registered an Overbought reading or traded more than 2.5 standard deviations above its rolling mean.
Extremes “above” the Mean (at least 2.5 standard deviations)
USD/KRW (signifying a weaker Korean Won)
Overbought (RSI > 70)
Tin (for the 12th week)
Iron Ore
Hot Rolled Coil Steel
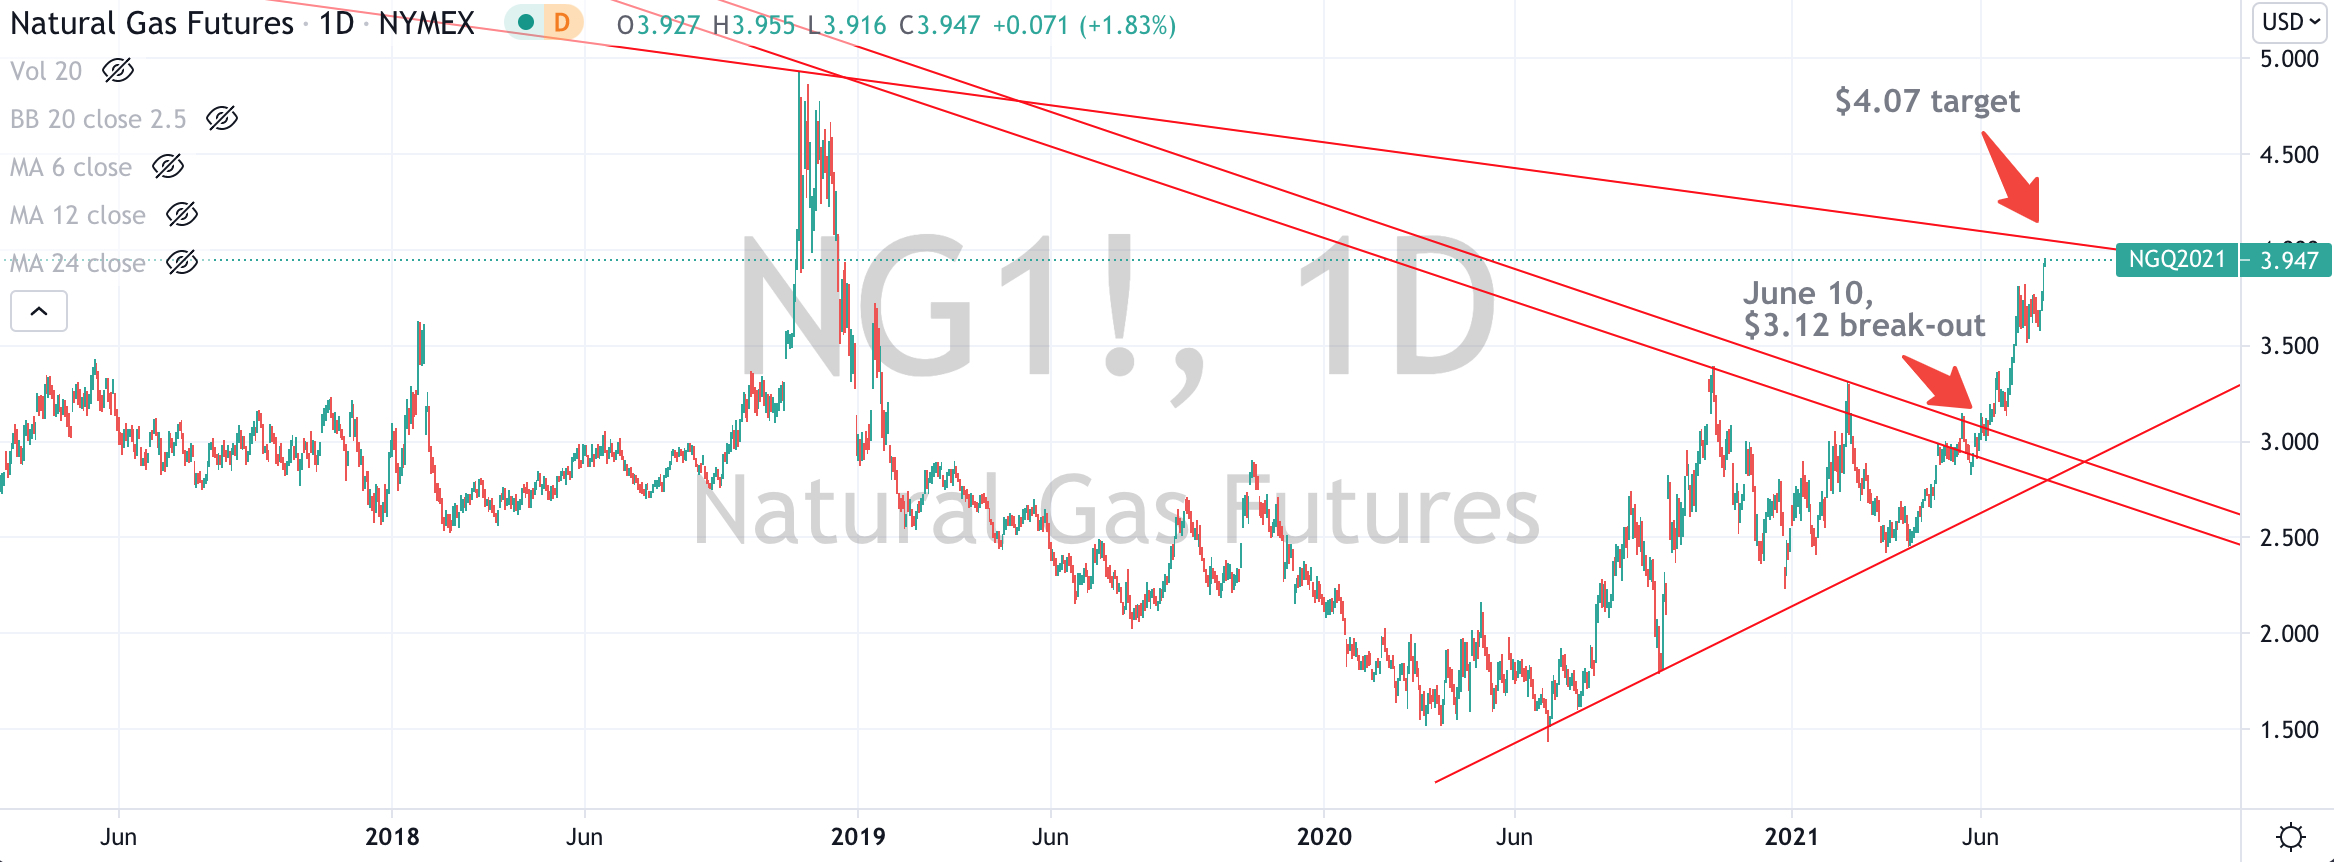
Natural Gas
Switzerland’s SMI equity index (for the 5th week)
and the Copenhagen, Stockholm and Helsinki equity indices.
The Overbought Quinella – Both Overbought and Traded at > 2.5 standard deviations above the weekly mean)
None
Assets (securities) within my immediate universe which touched the other side of the extreme, being Oversold (where the RSI is < 30) or were at least 2.5 standard deviations below its mean are;
Extremes “below” the Mean (at least 2.5 standard deviations)
U.S. Government 10 year bond yields (10’s),
the Australian (10’s), Canadian, U.K., Japanese and Swedish 10’s
and the Australian 10 year minus 2 year yield spread
Oversold (RSI < 30)
AUD/JPY (a weaker AUD and a stronger Yen suggests ‘risk-off’ is tiring)
The Oversold Quinella – Both Oversold and Traded at < 2.5 standard deviations above the weekly mean)
Chinese government 10 year bond yields. (bond buyers have been the more aggressive, thus bond price have been rising)
The notable additions to the ‘extremes’ list is the return of government bond yields, however this time the yields are at the lower end of their range. Interestingly, their ‘trading bands’ are narrowing which portends a change in trend.
The week’s dominant price movers were mainly in the commodities markets..
There was a 5% bounce in Corn and Soybeans, along with a 13% surge in Wheat, which I forecasted in the following 2 links.
Coffee rose 6.5%, Sugar climbed 2.5% while we saw Lumber and Lean Hogs slump 29% and 18% respectively. Neither are Oversold yet.
With the exception of Natural Gas (which is ‘peaking’) the energy complex (crude, heating oil, gasoline) saw declines of between 2%- 3%. These are longer in Overbought territory.
In last week’s Macro Extremes edition, I wrote, many <indices> made ‘lower highs and lower lows’, including the SOX Semiconductor Index, the Russell 2000, the S&P MidCap 400, the U.S. KBW Banking Index and the Dow Jones Transports.
And so this week, we saw the U.S. KBW Banking Index fall 2.5%, the DJ Transports, Philadelphia Semiconductor Index and the S&P MidCap 400 decline 4%. The small cap Russell 2000 tanked 5%.
The Nasdaq 10, S&P 500 and France’s CAC-40 all retreated from Overbought territory with the latter snapping a 13 week streak in the lofty region.
The Hang Seng China Enterprise Index (HSCEI) and Hang Seng (HSI) equity indices are not at an ‘extreme’ this week, following a 3% rise in each.
Other global equity indices saw a mostly benign week with South Korea’s KOSPI rising 2% and the U.K.’s FTSE 100 was a mirror opposite falling 2%
The U.S. 10 year bond yield continues to trend lower, falling to 1.29% from last week’s 1.36%. This week, it closed on its low and above the previous intra-week low of 1.25%. The yield of the U.S. 10’s have now fallen from 1.52% a month ago.
The 10’s remain bound in a larger range but we watch it broader capital markets could become explosive is the 10’s break either below 1.25% or above 1.65%.
And lastly, Bitcoin is trading 127% above its 200 Week Moving Average, which is lower than last week’s 146% reading and certainly lower when compared to its 466% peak in mid-April 2021.