The shortage of this fluid which is squirted onto the exhaust gases produced by diesel engines (in order to reduce emissions) is expected to affect the trucking (logistics, supply chain etc) industry.
Understandably, the price of Urea continues to scream stratospherically and parabolically higher.
But the price of GasOil (diesel) has declined. This is also understandable as we’d expect fuel to be conserved and truckers buying less diesel as an in kind reaction to AdBlue shortages.
With that said, the main highlight of this post is to show you the volatility of the GasOil price lately.
In the chart below, the first ellipse shows GasOil falling 12% on November 26th and then for the next 4 trading days it has a minimum of a 5% trading range in each day.
Volatility continues for the next 2 weeks.
Then (the second ellipse) this Monday it closes down 5.5% from the previous day.
On the next day (Tuesday), it closes up 5.5%.
This tells you to stay away.
It tells you that some markets are becoming a video game.
The following assets (on a weekly timeframe) registered an Overbought reading or traded more than 2.5 standard deviations above its rolling mean.
Extremes “above” the Mean (at least 2.5 standard deviations)
Lumber
China’s CSI 300 equity index
Overbought (RSI > 70)
U.S. 2 year bond yields
the JKM “Japan/Korea (LNG) Marker”
Coffee
Urea
Dutch TTF Natural Gas
and the U.S. Dollar (DXY) Index
The Overbought Quinella – Both Overbought and Traded at > 2.5 standard deviations above the weekly mean)
Dutch TTF Natural Gas
Assets (securities) which touched the other side of the extreme, being Oversold (where the RSI is < 30) or were at least 2.5 standard deviations below its mean are;
Extremes “below” the Mean (at least 2.5 standard deviations)
Russia’s MOEX equity index
Oversold (RSI < 30)
EUR/USD
DKK/USD
The Oversold Quinella – Both Overbought and Traded at > 2.5 standard deviations above the weekly mean.
TRY/USD – the Turkish Lira is historically weak
Notes & Ideas:
It was a week of falling bond yields, meaning it was a ‘risk-off’ week and inversely, equities eased.
Other markets mainly digested and consolidated recent moves as they find their way from old extremes into new trends.
I’m also watching if certain securities attempt a double dip, to their recent lows. More on that in upcoming posts on my blog.
Some macro trends are at an acute point. Platinum and Silver are closing in to an Oversold extreme. The Copper/Gold ratio is trying to enter a downtrend while the U.S. government 10 year bond yields remain in a weak downward trend.
The difference between the U.S. 10 year bond yield minus the U.S. 2 year bond yield is also something I’m watching.
And it’s worth noting that the Australian government 2 year bond yield had a bullish outside reversal week.
In a review of topics from last week’s note, I wrote,
“Gold (in AUD) needs to holds A$2,467 and USD priced Gold equivalent level is US$1,758”
And so they did, XAUAUD traded to $2,463 and closed at $2,523, while XAUUSD traded to $1,753 and closed at $1,798.
Silver needed to hold $21.80. It traded to $21.41 and closed at $22.54 (up 1.4% on the week)
Those support levels remain.
And Brent Crude did not trade above $77.00 and thus it didn’t make a ‘higher high’. Brent closed 3.3% lower from the previous week at $72.96.
Henry Hub Natural Gas remains weak, falling a further 6% and is now down 35% over the past 3 weeks. I keep reminding readers that bullish parabolic moves are inevitably followed by quick retracements.
Japanese (JGB’s) and American 10 year government bond yields are still testing (and so far, holding) support lines of 1.34% and 0.03% respectively.
While last week, I heralded that the Hang Seng China Enterprises Index (HSCEI) had a bullish outside reversal week. That was nullified this week, with a 4.2% decline which resulted in a bearish outside reversal week, as that index and the Hang Seng (HSI) search for an extreme low.
And an oversold GBP/USD may find support as the Bank of England became the first G7 nation to raise interest rates in the ‘pandemic era’.
The larger advancers over the past week comprised of; Aluminium +4%, Hogs +10.6%, Hot Rolled Coil Steel +2.6%, JKM +20.6%, Dutch TTF 29.4%, Orange Juice +9.4%, Rotterdam Coal +8.2% and China Coal +7.8%.
The group of decliners included Baltic Dry Index (27.3%, which may be an example of 2nd chance selling and eventually a double dip), Tin (3.9%), Natural Gas (6%), Sugar (3%), Brent Crude (3.1%), Australian Coal (3.3%), Uranium (3.4%), Bitcoin (7%), Ethereum (5%), AEX (2.1%)< KIBW Banking Index (2.9%), S&P Midcap 400 (2.2%), Russell 2000 (1.7%), China’s CSI 300 (2%), Dow Jones Industrials (1.8%), DJ Transports (3.5%), HSCEI (4.2%), Hang Seng (3.4%), Nasdaq 100 (3.3%), SOX (3.9%), Sensex (3%) and S&P 500 (1.9%).
The following assets (on a weekly timeframe) registered an Overbought reading or traded more than 2.5 standard deviations above its rolling mean.
Extremes “above” the Mean (at least 2.5 standard deviations)
Lumber
China’s CSI 300 equity index
Overbought (RSI > 70)
the JKM “Japan/Korea (LNG) Marker”
Coffee
Cattle
Urea
Dutch TTF Natural Gas
and the U.S. Dollar (DXY) Index
The Overbought Quinella – Both Overbought and Traded at > 2.5 standard deviations above the weekly mean)
U.S. 2 year bond yields
Assets (securities) which touched the other side of the extreme, being Oversold (where the RSI is < 30) or were at least 2.5 standard deviations below its mean are;
Extremes “below” the Mean (at least 2.5 standard deviations)
The difference between the U.S. 10 year bond yield minus the U.S. 2 year bond yield
Oversold (RSI < 30)
EUR/USD
The Oversold Quinella – Both Overbought and Traded at > 2.5 standard deviations above the weekly mean.
TRY/USD – the Turkish Lira is historically weak
Notes & Ideas:
The main news over the past week is the impressive (but not surprising) rally in equity indices. The crowd tends to either be short or continue to extend the bubble commentary talk. Its inevitable that markets move to where they can do more damage and going up can damage ‘participants’ as much as it can when it comes down.
In other notes on trends and price action include;
Adding to last week’s 25% decline Henry Hub Natural Gas fell a further 5%.
Gold (in AUD) needs to holds A$2,467 and USD priced Gold equivalent level is US$1,758.
If not, I expect Gold to move lower.
Silver is making new (recent) lows and I’m watching closely if it holds $21.80.
Inversely, watching is Brent Crude trades above $77.00, which be a higher weekly high than last weeks.
Japanese (JGB’s) and American 10 year government bond yields are testing support lines. Holding these supports is constructive for the general sentiment of risk assets, such as 1.34% for the US 10’s. i.e. you don’t want the JGB’s testing the 0.03% mark nor trading below 0.02%.
Although not oversold, (its close), a declining GBP versus USD is now at my initial Buy price of 1.3260. I’ll add to British Pound positions if it goes lower.
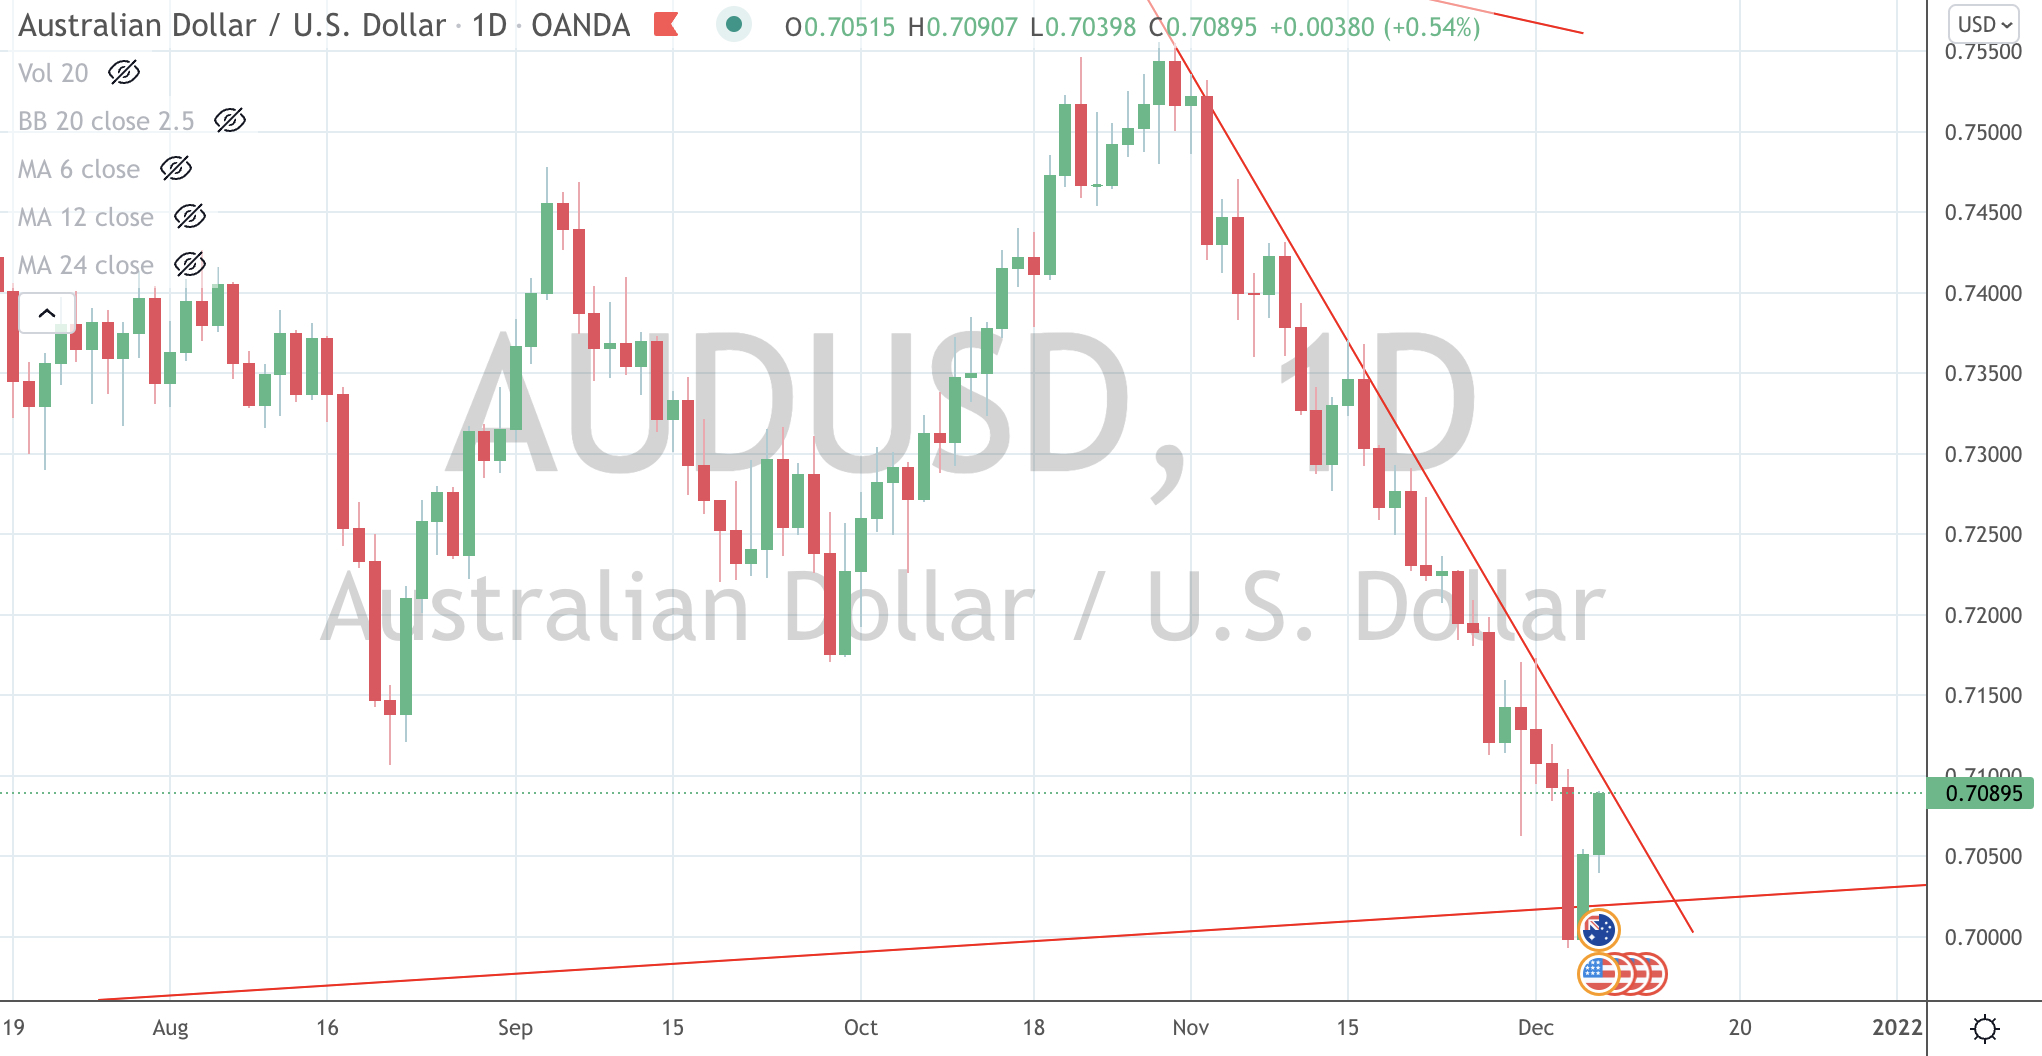
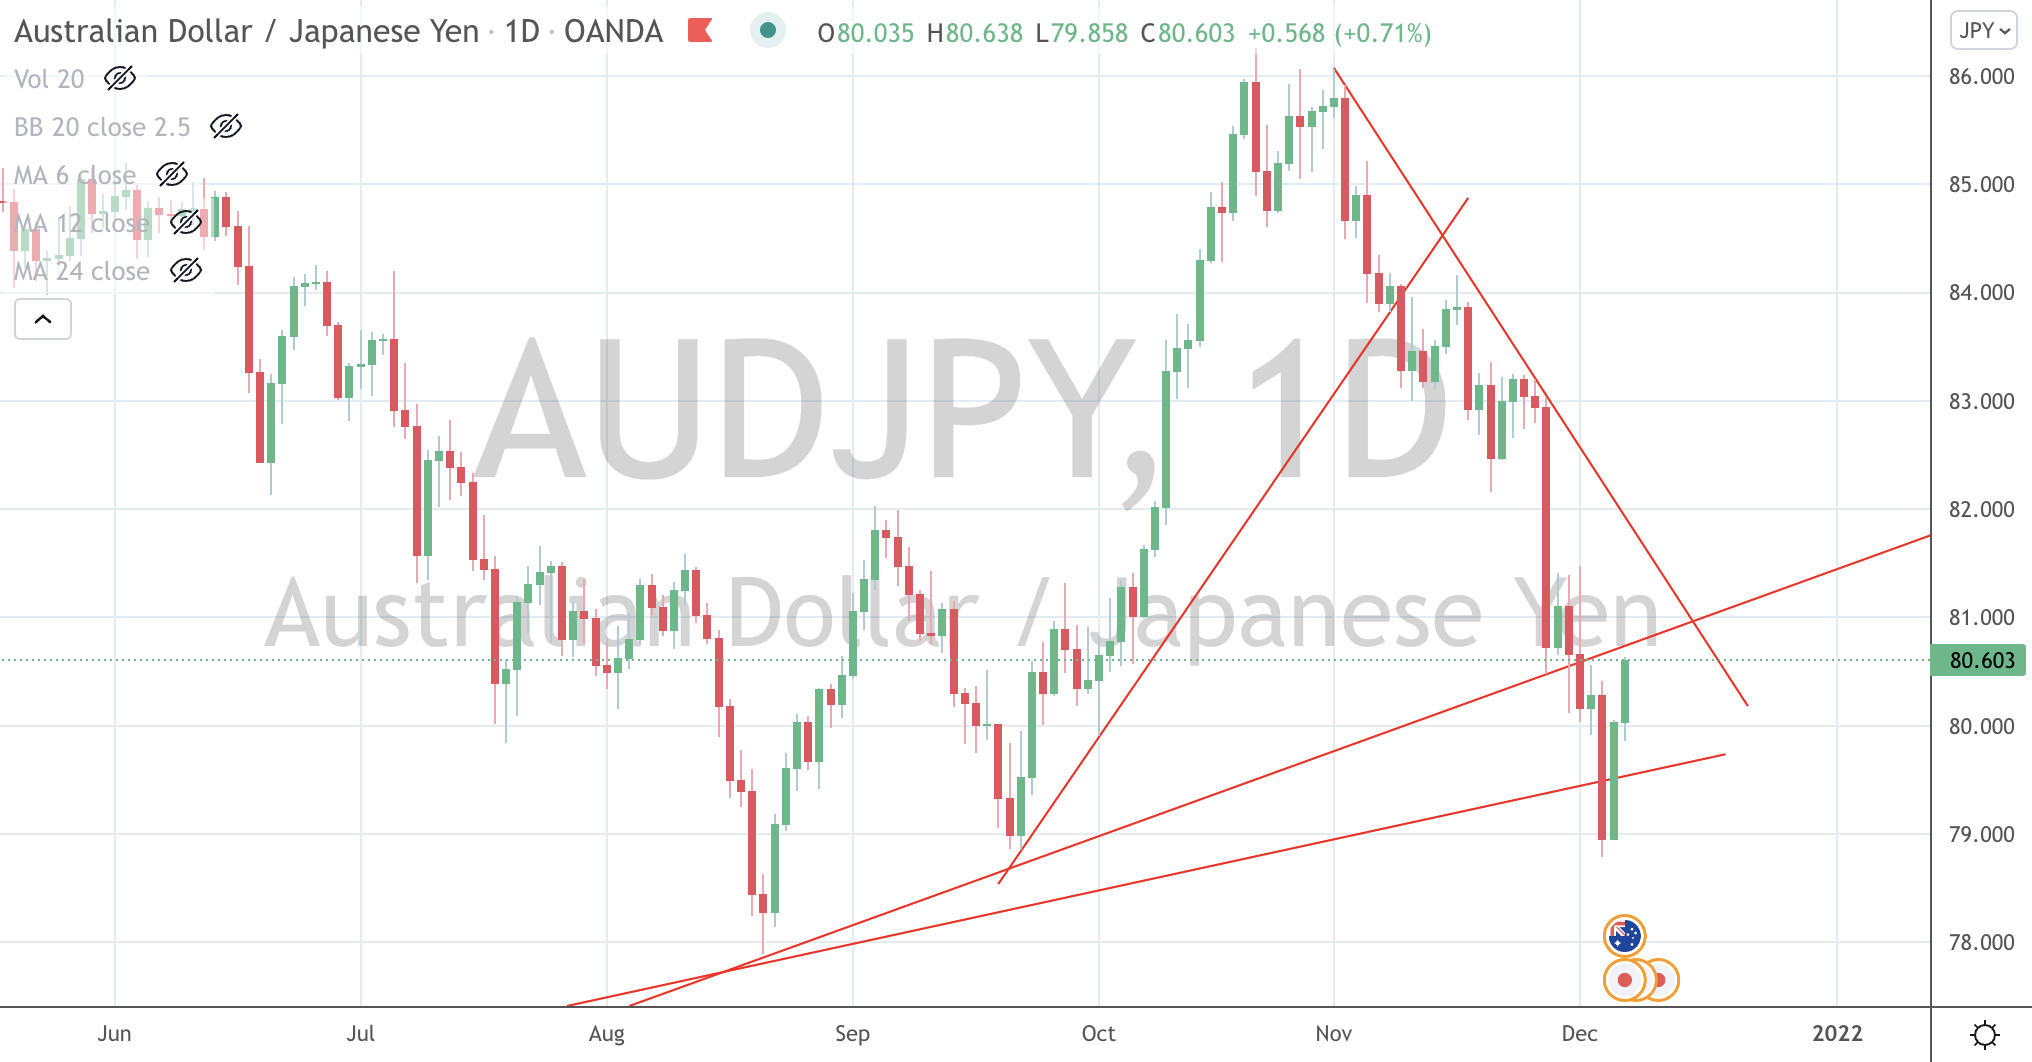
Positively, for risk assets, the AUDJPY traded higher intra-week and closed higher than the last, although it is yet to break an important resistance line. Broadly, a “double-dip” in equities is still on, unless various currency resistances are breached.
For the contrarians, the Hang Seng China Enterprises Index (HSCEI) had a bullish outside reversal week,
And I want to finish comparing the correlation between Russia’s MOEX equity index against some interest rates and currencies to help confirm risk on/off momentum.
The larger advancers over the past week comprised of the Baltic Dry Index 3.2%, (up 27% in 3 weeks), WTI Crude 8.2%, Gasoil 4.4%, Heating Oil 7.3%, JKM 3%, Lumber 17.3% (adding to last week’s 18.3% rise), Dutch TTF Gas 18.2%, Orange Juice 5%, Gasoline 9.4%, Sugar 5.1%, CRB Index 2.4%, Rotterdam Coal 11%, Australian Coal 9.7%, Shanghai Composite 1.6%, Amsterdam’s AEX 2%, , KBW Banking Index 2.2%, CAC 3.3%, CSI 300 3.1%, DAX 3%, Dow Jones Industrial 4%, Dow Jones Transports 2.7%, Italy’s MIB 3%, BOVESPA 2.6%, S&P 400 Midcap 3%, Nasdaq 100 4%, Sensex 1.8%, Copenhagen 3.9%, Helsinki 2.4%, FTSE 100 2.4%, Stockholm 3.3%, Russell 2000 2.4%, Swiss SMI 3.6%, SOX 2.9%, Nasdaq Transports 2.9%, the S&P 500 3.9%, Australia’s ASX 200 1.6% and Istanbul’s BIST equity index rose 7%, giving it a 46% return in the pasty 8 weeks.
The group of decliners included Aluminium (1.8%), Coffee (4.4%), Natural Gas (5%), Gold in AUD (2.5%), Rice (1.7%), Wheat (2.3%) and Russia’s MOEX equity index (3.9%).
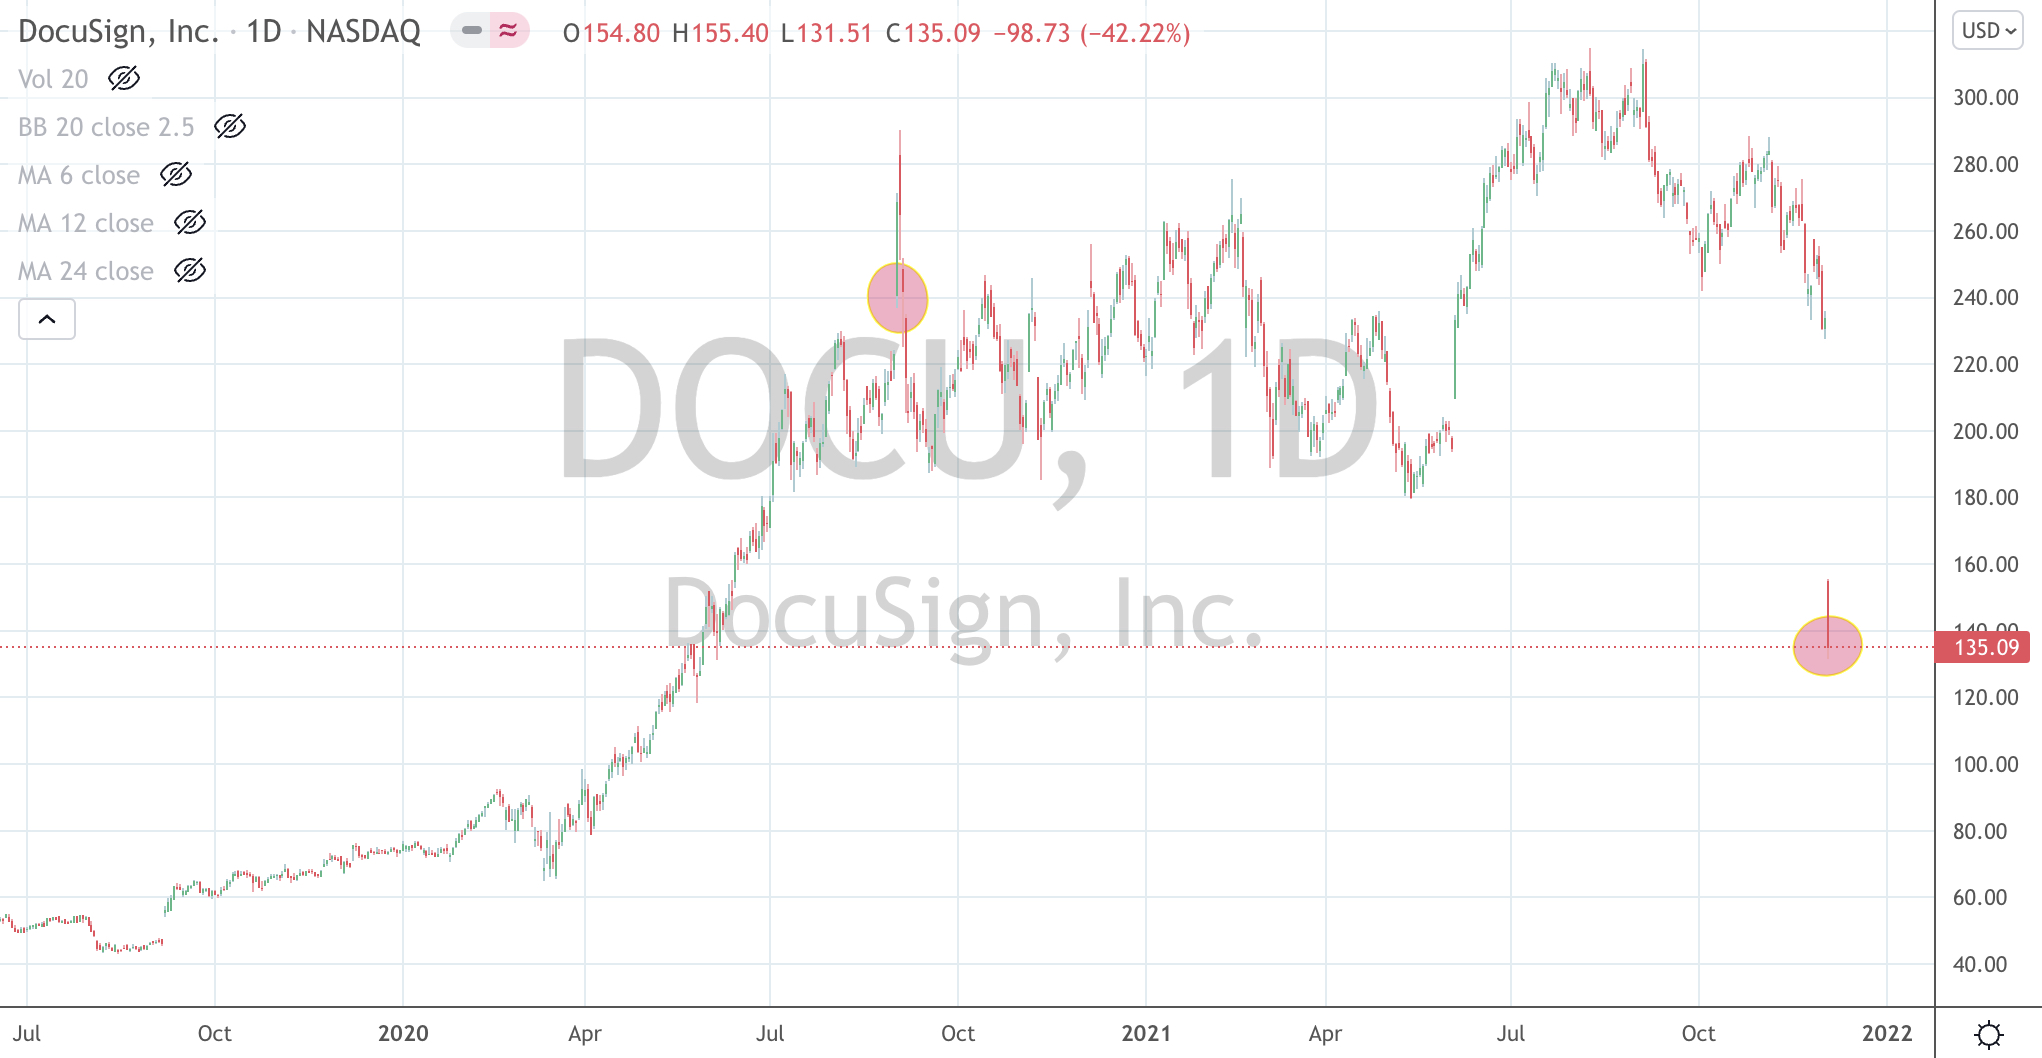
On Friday, shares in U.S. listed Docusign (DOCU) slumped 42% to close at $135 per share.
This prompts a revisitation of the company’s prospects.
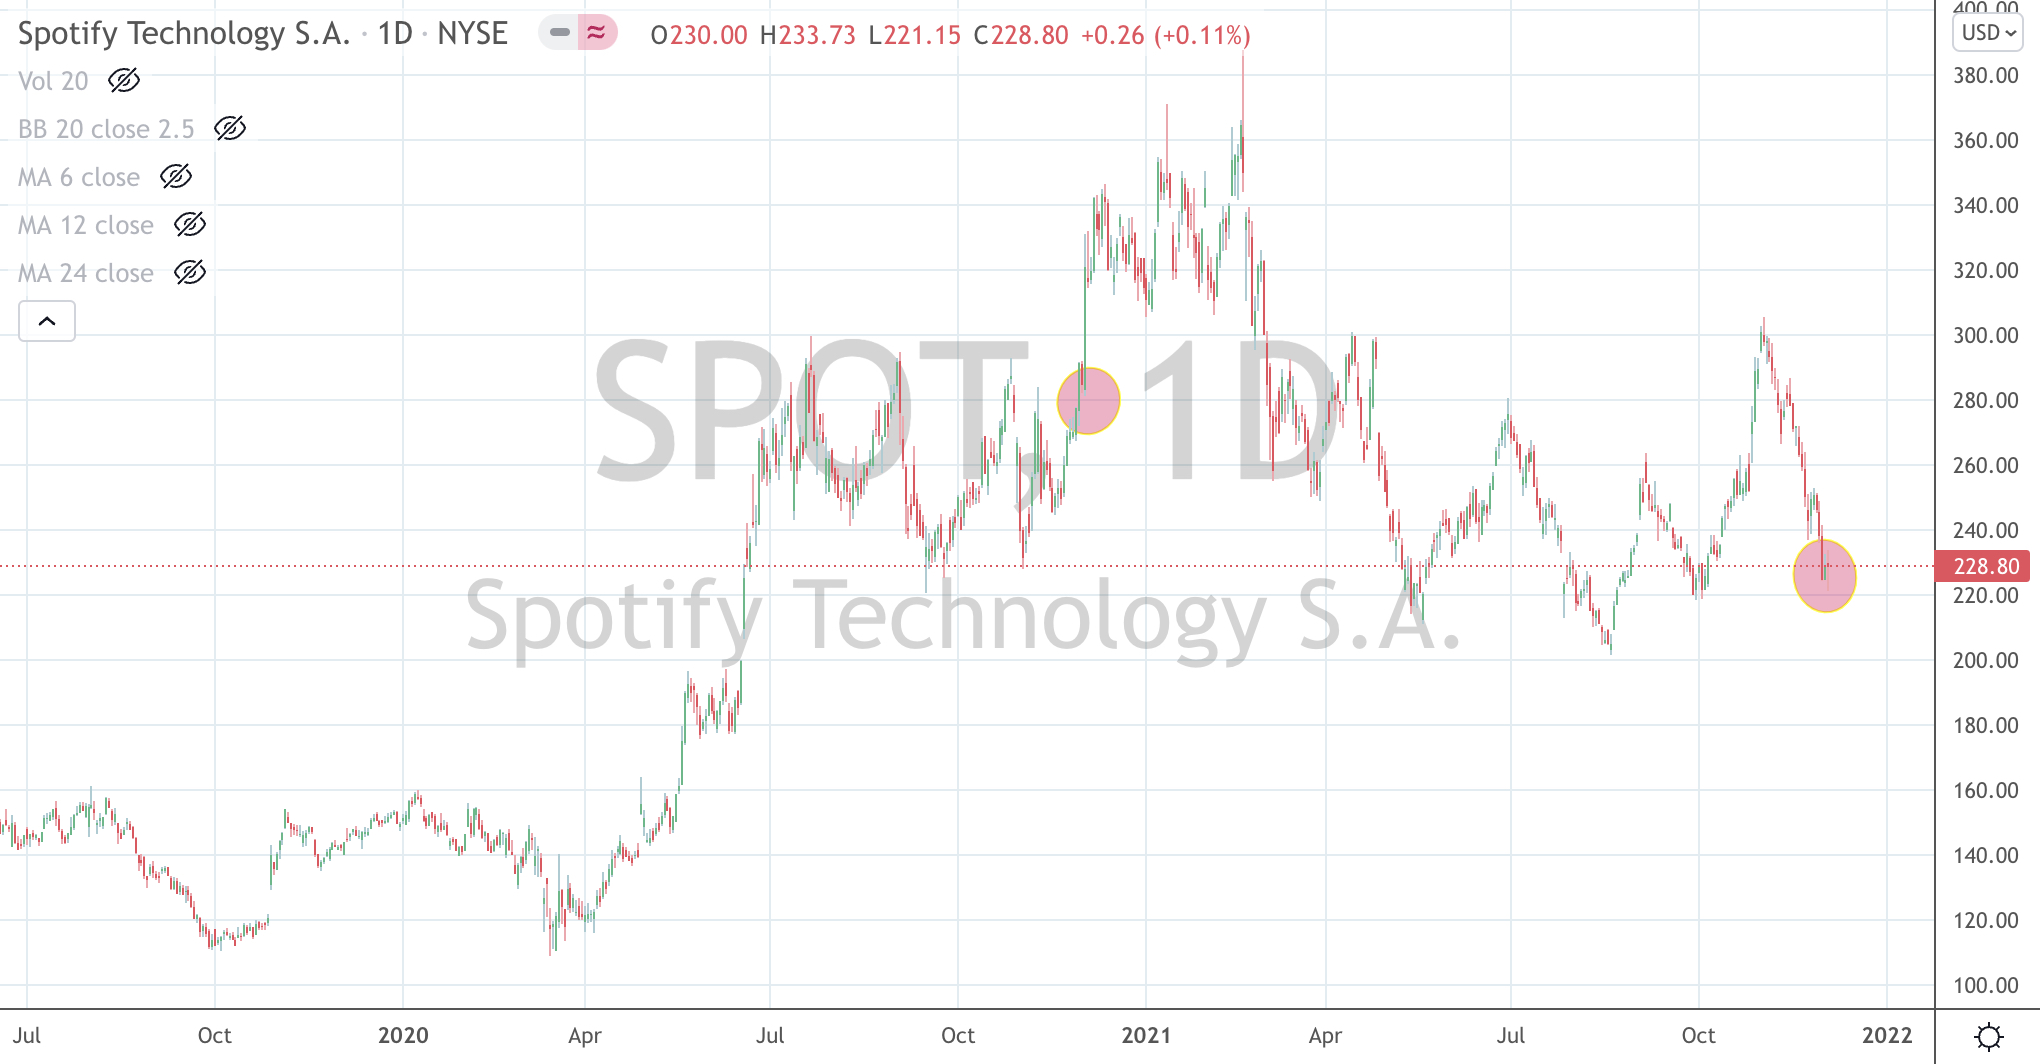
Client portfolio’s have owned that stock before. Happily, those positions were sold at $240 in September 2020 (almost 15 months ago).
I have made reference to these selling decisions (and other stocks) in this post, dated March 19, 2021.
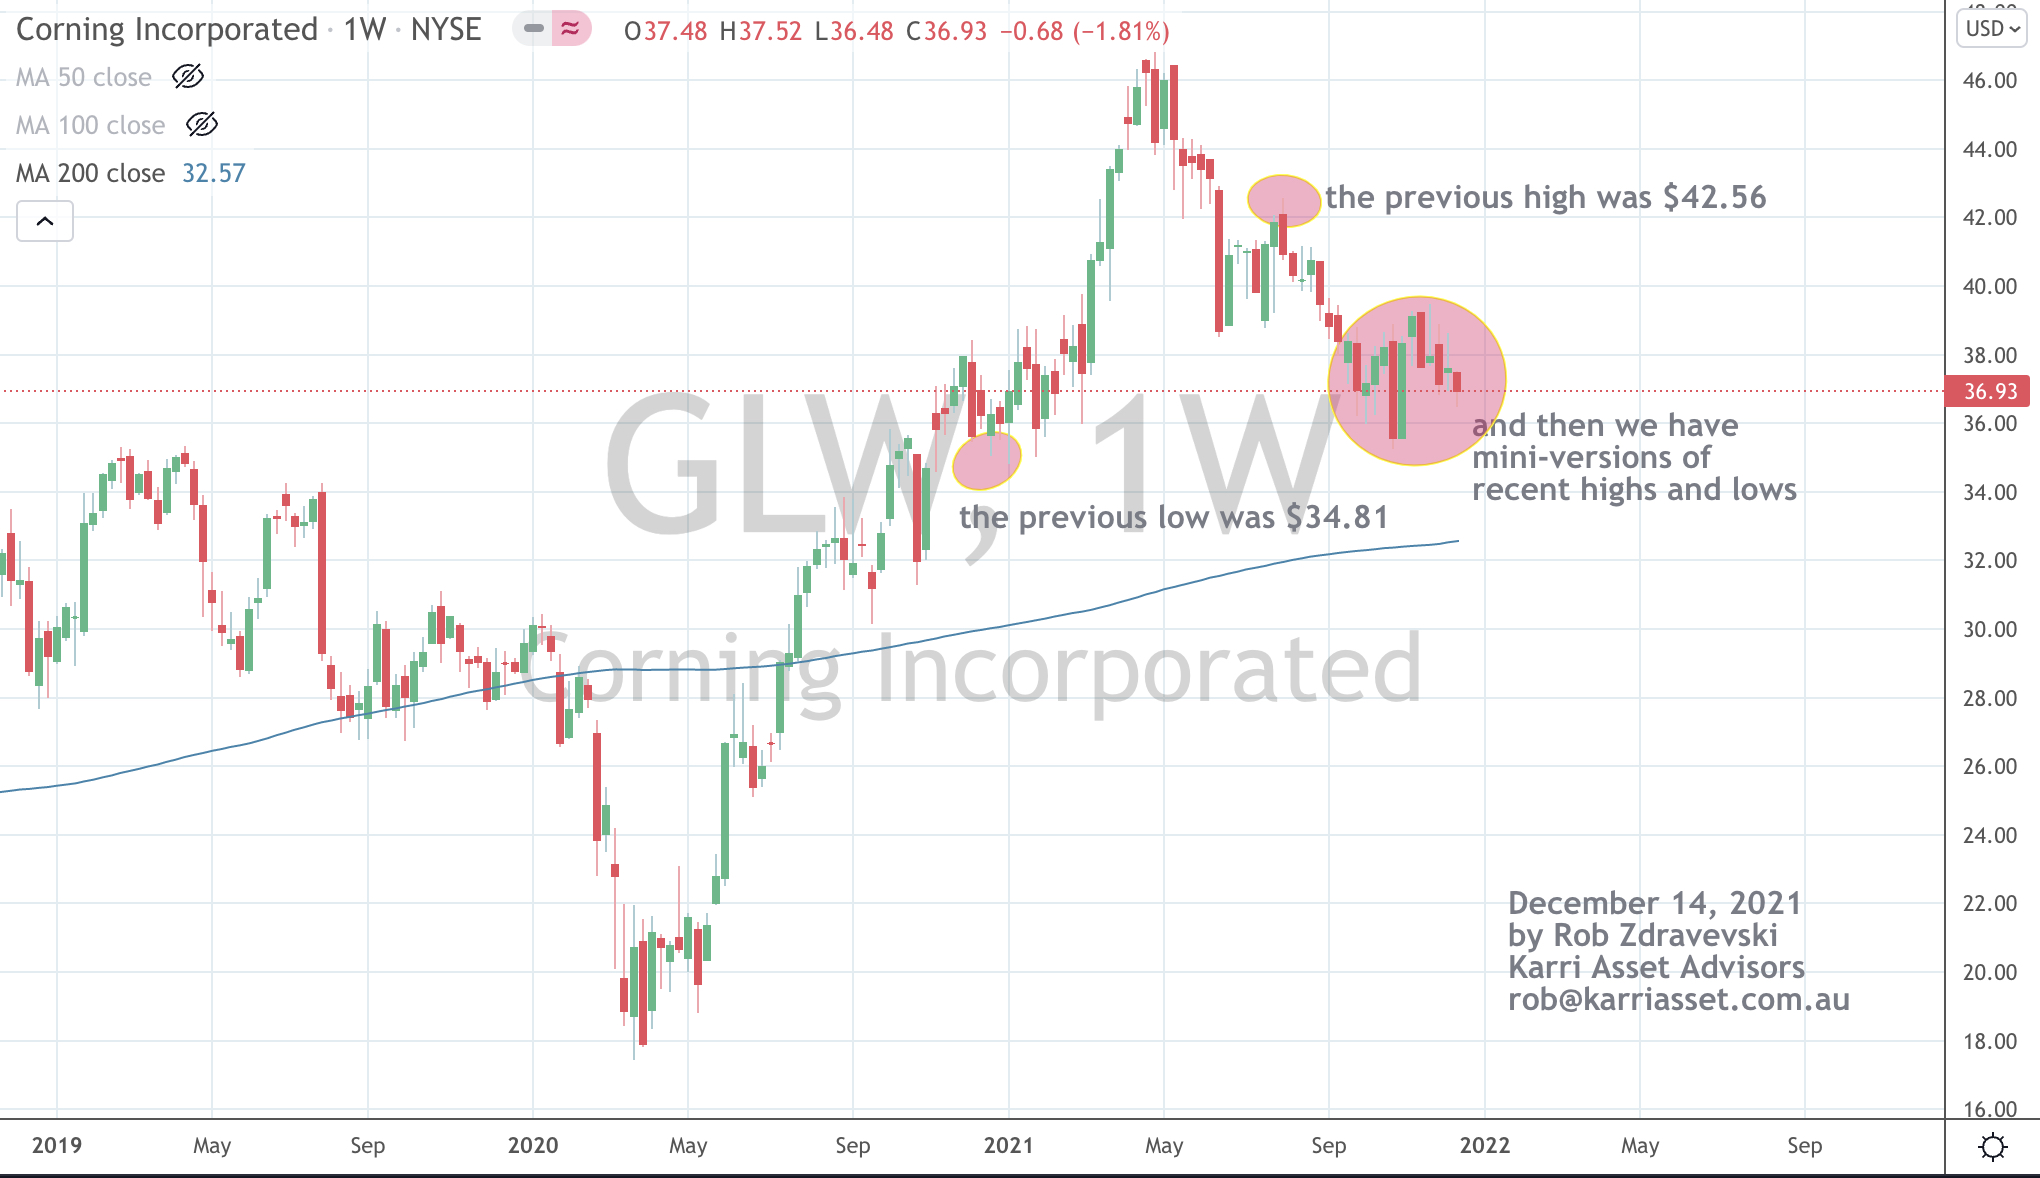
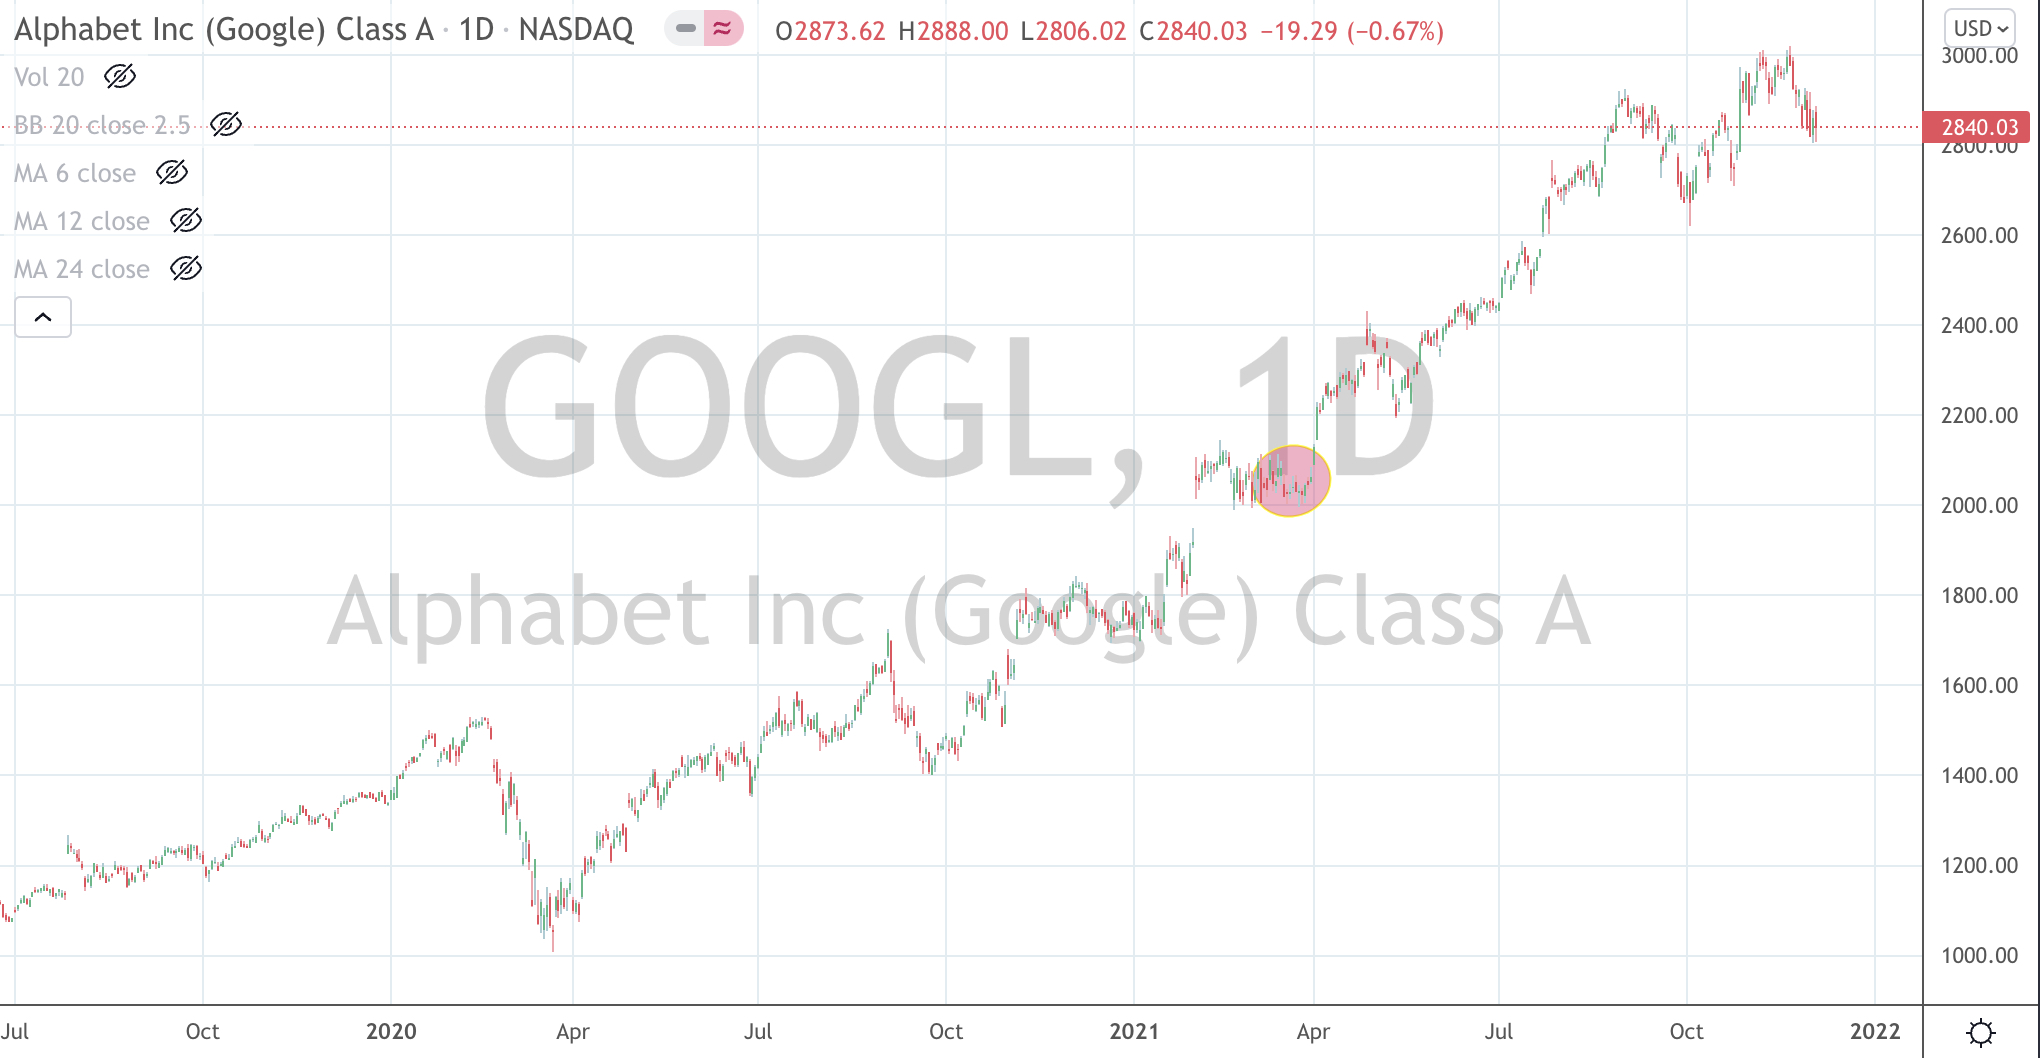
In a continuing post mortem of investment decisions, the charts below highlight where I’ve sold particular stocks and compare it to their latest closing prices.
While I may be critical for ‘selling too early’, I am sanguine in sticking to my discipline and reasoning behind those selling decisions. It’s not a case of vindication.
Sometimes the decision to sell can simply mean that I can’t convince myself to buy more of a stock at their higher, improved prices or more to the point, I’m not comfortable taking on current or more risk by continuing to hold it. This is when you hear the term, ‘preservation of capital’ being used.
I guess that this also falls into the category of ‘catching the fat part of the trade’.
You could also say that there does come a time to sell. The ‘set and forget’ trade is fraught with danger as the ‘forget’ portion possibly suggests that you don’t need to monitor or check your investments.
Incidentally, the linked post mentioned Alphabet (Google) stock as a position that I will not be selling at that time.
Its chart is also included below. I am still holding GOOGL.
The following assets (on a weekly timeframe) registered an Overbought reading or traded more than 2.5 standard deviations above its rolling mean.
Extremes “above” the Mean (at least 2.5 standard deviations)
Lumber
Overbought (RSI > 70)
U.S. 2 year bond yields
Turkish 10 year bond yields (now yielding 20.5%)
the JKM “Japan/Korea (LNG) Marker”
Coffee
Cattle
Tin
Urea
and the U.S. Dollar (DXY) Index
The Overbought Quinella – Both Overbought and Traded at > 2.5 standard deviations above the weekly mean)
None
Assets (securities) which touched the other side of the extreme, being Oversold (where the RSI is < 30) or were at least 2.5 standard deviations below its mean are;
Extremes “below” the Mean (at least 2.5 standard deviations)
Hot Rolled Coil Steel (HRC) – now 17% below its recent high
Gasoline
AUD/USD (suggesting a weaker Aussie versus the USD)
GBP/USD
SEK/USD
The Hang Seng equity index
And Spain’s IBEX equity index
Oversold (RSI < 30)
None
The Oversold Quinella – Both Overbought and Traded at > 2.5 standard deviations above the weekly mean.
The difference between the U.S. 10 year bond yield minus the U.S. 2 year bond yield (which is at its lowest since July 9, 2018)
TRY/USD – the Turkish Lira is historically weak
Notes & Ideas:
The difference from last week’s edition is that Chinese 10 year bond yields and the Nasdaq 100 are no longer Overbought and Iron Ore and the EUR/USD aren’t Oversold anymore. The Euro is still in my buying range.
It’s worthy to note that last week I commented about the outside bearish reversal for U.S. equity indices. Prior to that, these indices have also appeared amongst the overnight extremes over the past month.
Although picking the moment to sell is a seperate analysis and discipline, this weekly note is actually designed to help you understand when NOT to Buy (in the recent case of U.S. equity indices) at the recent extremes they were exhibiting.
The S&P 500 only fell 1.2% for the week and is 4.3% below its recent high. The Nasdaq 100 has fallen 6.3% from its high. I’m looking for it to hold 15,020. More on this index in a seperate post. As is often the case, smaller caps tend to cop the initial brunt of a trend reversal. The Russell 2000 has declined 12% in the past 4 weeks.
The largest mover in my macro world was the 25% weekly decline in the Henry Hub (U.S.) Natural Gas prices. They are now down 36% from their recent high.
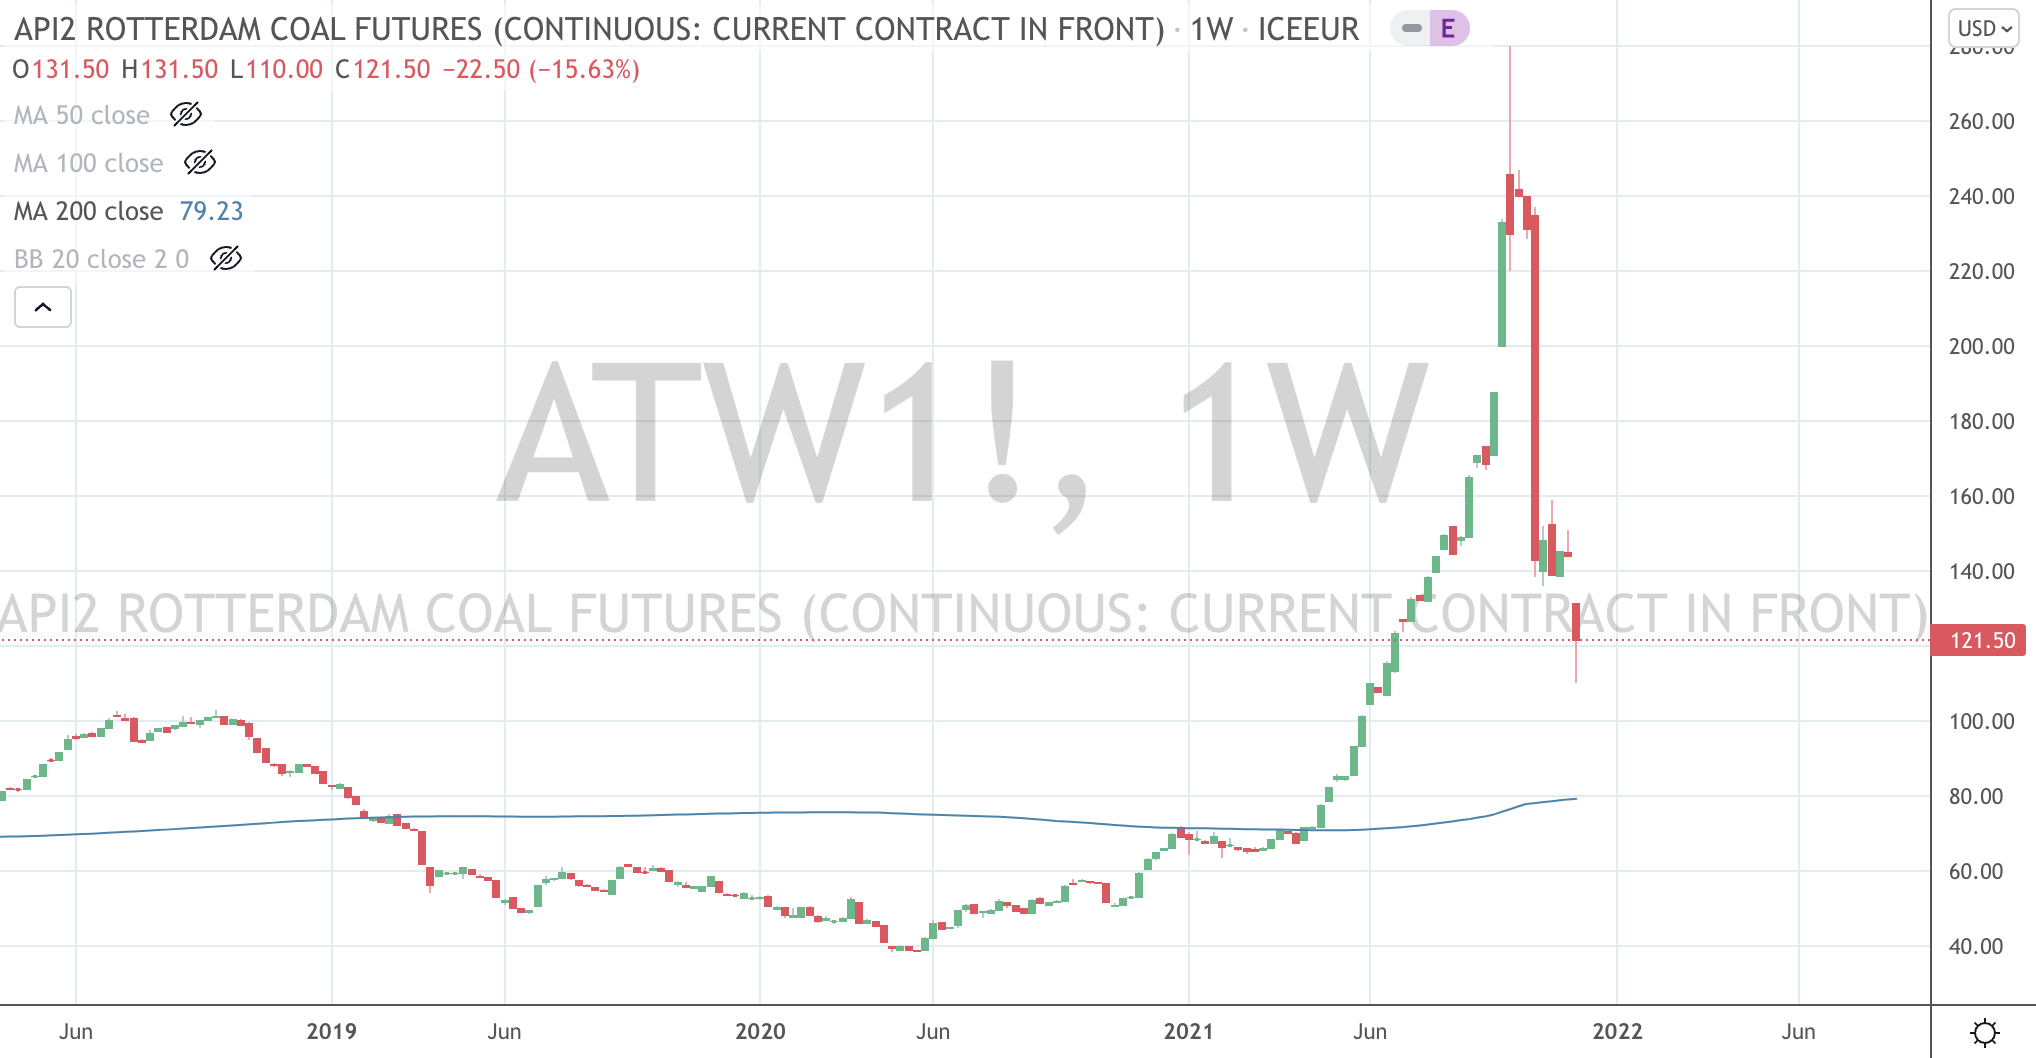
Amongst other commodities, Rotterdam Coal is 56% below its recent peak, Aluminium has fallen 20%, Soybeans is 22% below its high as is WTI Crude Oil, which happens to be recording its 6th consecutive ‘down’ week and it back at the same price seen in March 2021.
But I remind readers, that we only hear the ‘noisy’ financial media reporting the hoopla when these prices were rising. Mean reversion is a real thing, especially following parabolic rising moves.
Similar to the case when the Baltic Dry Index fell 57% through October and November. Incidentally, this decline coincided with an equally savage fall in the price of Iron Ore. When you marry these two occurrences, Iron Ore companies suddenly offset the decline in their commodity price with the savings made in shipping it.
In other news, the U.S. 10’s are currently on a 1.34% support line.
In early and mid October 2021, Turkey was in the midst of political weight being thrown against central bank policymaking. That is when I wrote a note suggesting Buying Turkish Banks. Since then Istanbul’s BIST equity index has featured in the list of advancers within this weekly publication. In the past week, the BIST rose 8.5% and this adds up to a 32% for this index within 7 weeks. Simply extraordinary.
This may seen perverse but it highlights a strategy of buying in the wake of what seems to be bad news. Over the past 7 weeks, shares in Akbank have risen 35%, Garanti advanced 33%, isBank climbed 36% and Yapi Kredi soared 48%.
The larger advancers over the past week comprised of the Baltic Dry Index 14.6%, (up 23% in 2 weeks), Cocoa 3%, Gasoil 2.4%, Lumber 18.3%, China Coal 10.5%, Bovespa 2.8%, MOEX 2.6%, TAIEX 1.9% and Istanbul’s BIST equity index rose 8.5%.
The group of decliners included Bloomberg Commodity Index (4.1%), WTI Crude (2.8%), JKM (2%), Tin (2.1%), Natural Gas (24.6%), Orange Juice (1.8%), Platinum (2.9%), Sugar (3.1%), Uranium (2.9%), Australian Coal (14.3%), Rotterdam Coal (15.6%), Wheat (4.4%), Brent Crude Oil (4.1%), Silver (2.7%), CRB Index (2.7%), KBW Banking Index (3.2%), IBEX (1.9%), S&P 400 Midcap (2.7%), Nasdaq (2%)< Nikkei (2.5%), Copenhagen 25 index (3.7%), Russell 200 (3.9%), Singapore’s Strait Times (2%) and Australia’s ASX 200 only fell 0.5% for the week.
December 5, 2021
by Rob Zdravevski
rob@karriasset.com.au
Rotterdam Coal prices on their way back to a 200 week mean