Biden will save the day


Russia says they will not invade Ukraine and are open to using diplomacy while America says they will invade and are poised to do so very soon.

I believe Russia will not initiate an invasion.

Firstly, Putin doesn’t have the money nor the troops.

Also, you don’t invade in the mud. You wait until the ground has dried.

However, Russia will retaliate and blame NATO if they throw the first stone.

Russia may already have a claim if they cite the threats of sanctions.

For the U.S. has already sanctioined companies involved in the NordStream 2 pipeline. Germany isn’t happy.

An outlier call is that Russia walks across the border and Ukraine accepts their terms of a ‘merger’.

My belief is that Biden is ‘creating a war’ for various reasons. He needs to improve his fall in the polls and he’ll do that by being tough on Russia (and China) while also increasing government spending.

Remember than Obama was softer and friendlier to Russia, which included assisting Russia joining the WTO in 2012.

Obama was also continuing the austerity measures adopted at the end of the Global Financial Crisis.

The Democrats lost heavily in the 2014 midterm elections and Biden has not forgotten Obama’s soft and friendly stance.

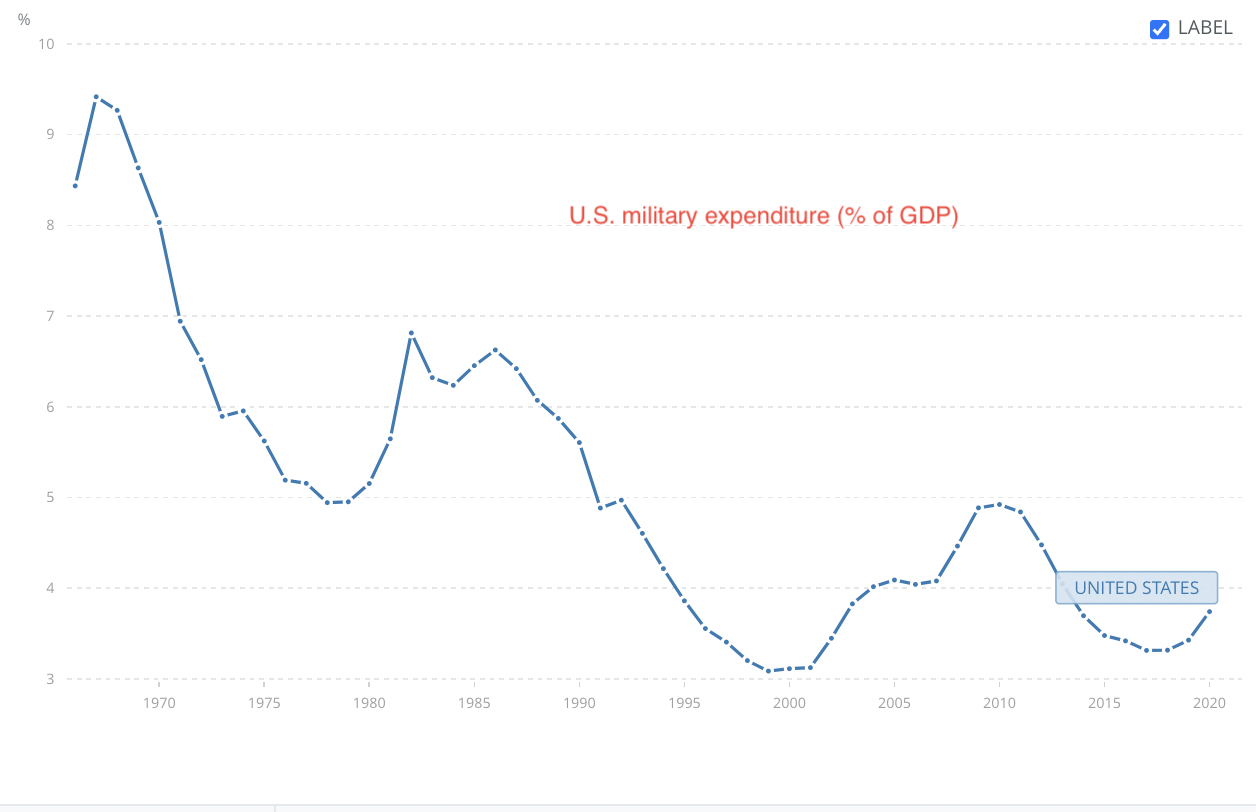
With Biden’s infrastructure spending bill not being passed, another way he can spend money is to increase military expenditures, especially as the Iraq and Afghanistan campaigns have ended.

The charts below show the ebbs of current U.S. military spending in the form of 1) as a percentage of GDP and 2) as a percentage of general government expenditure.

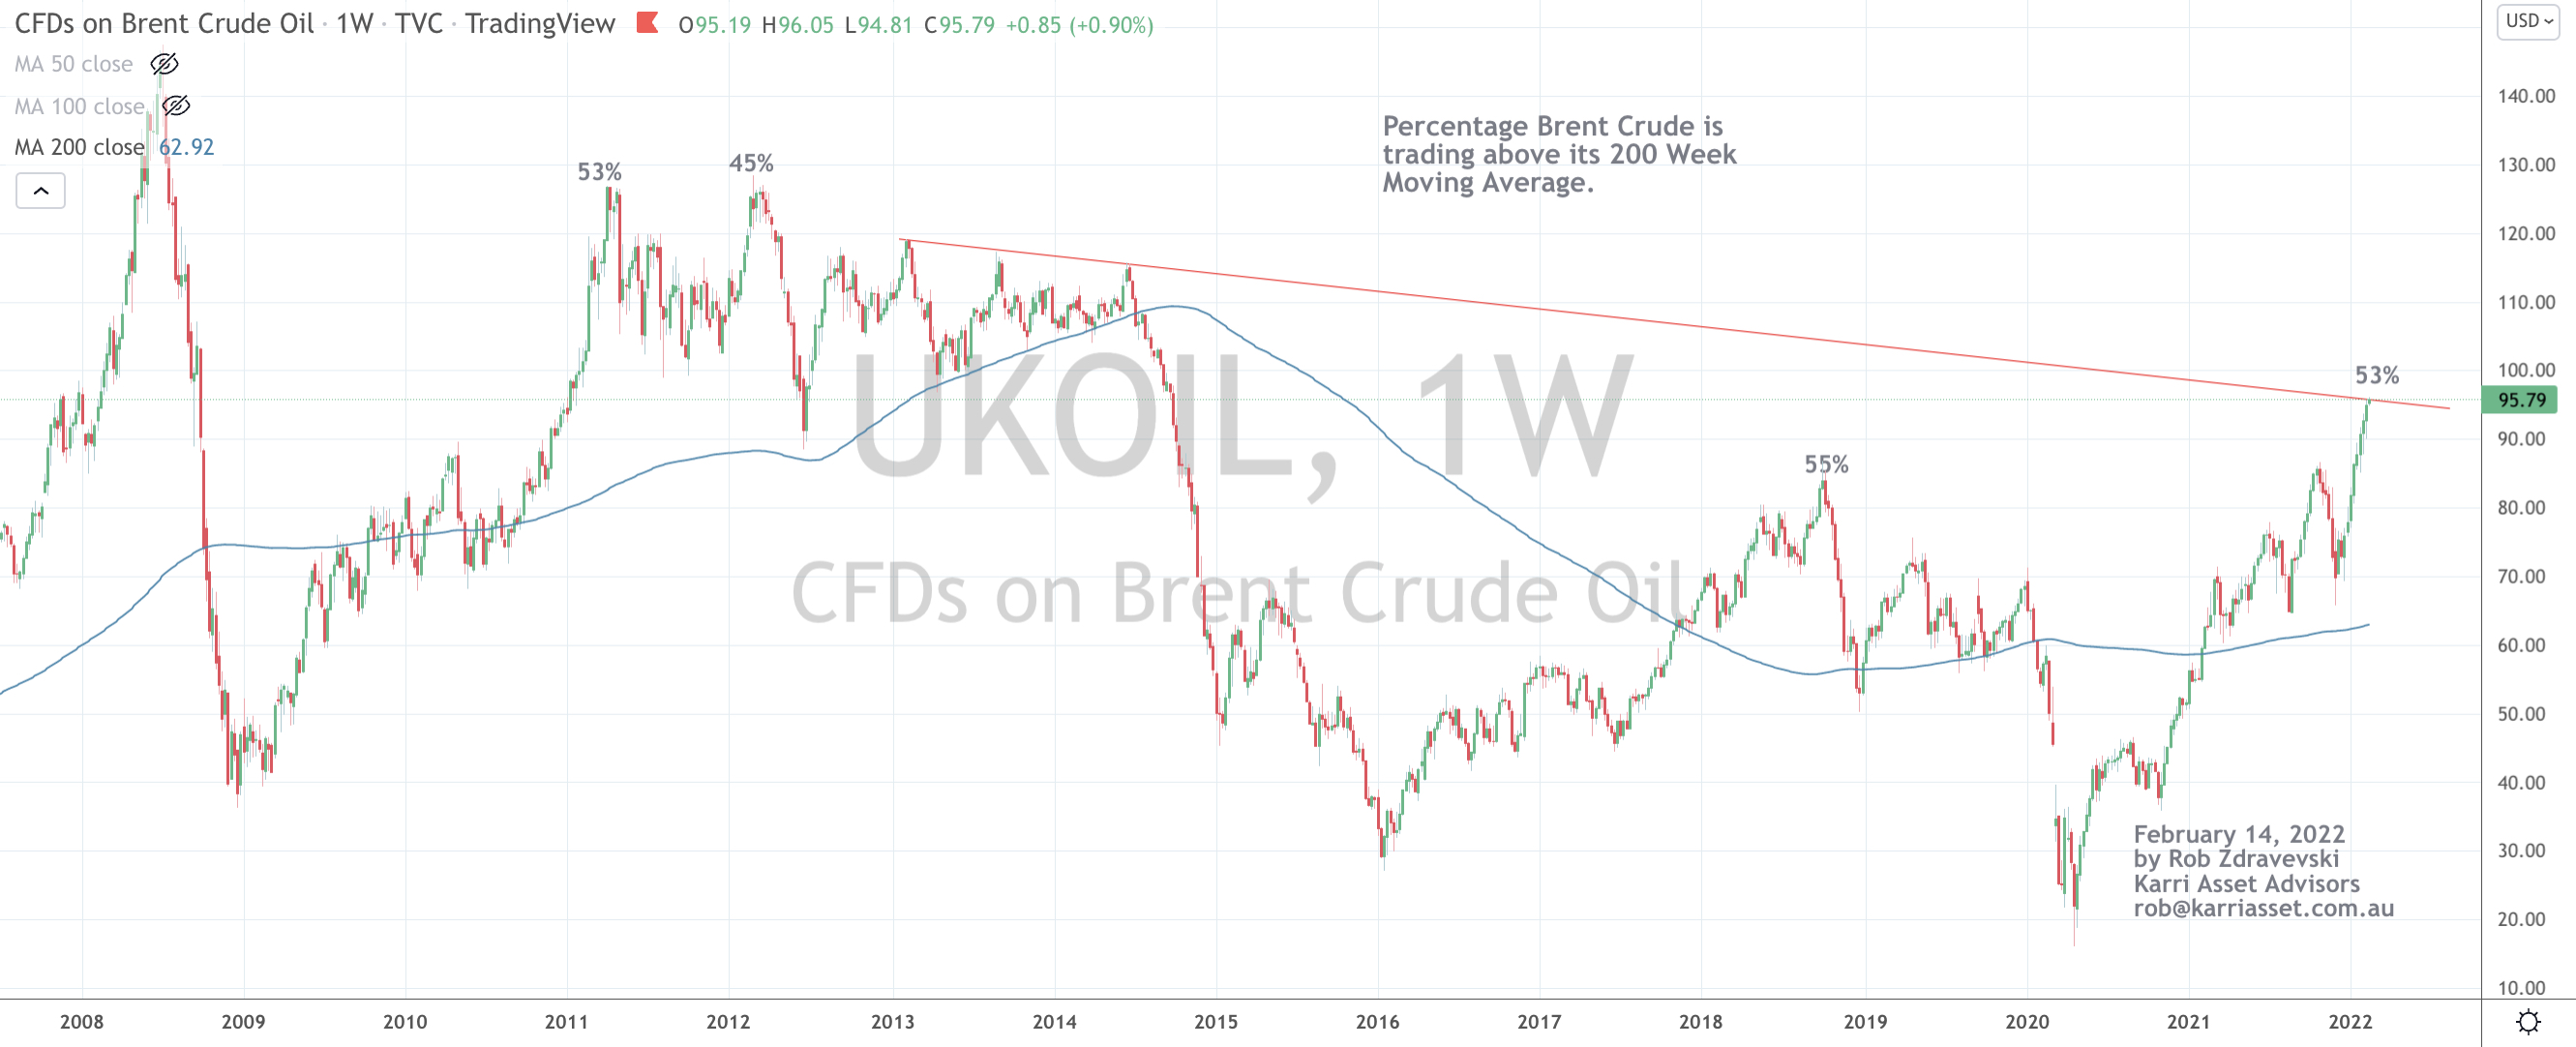
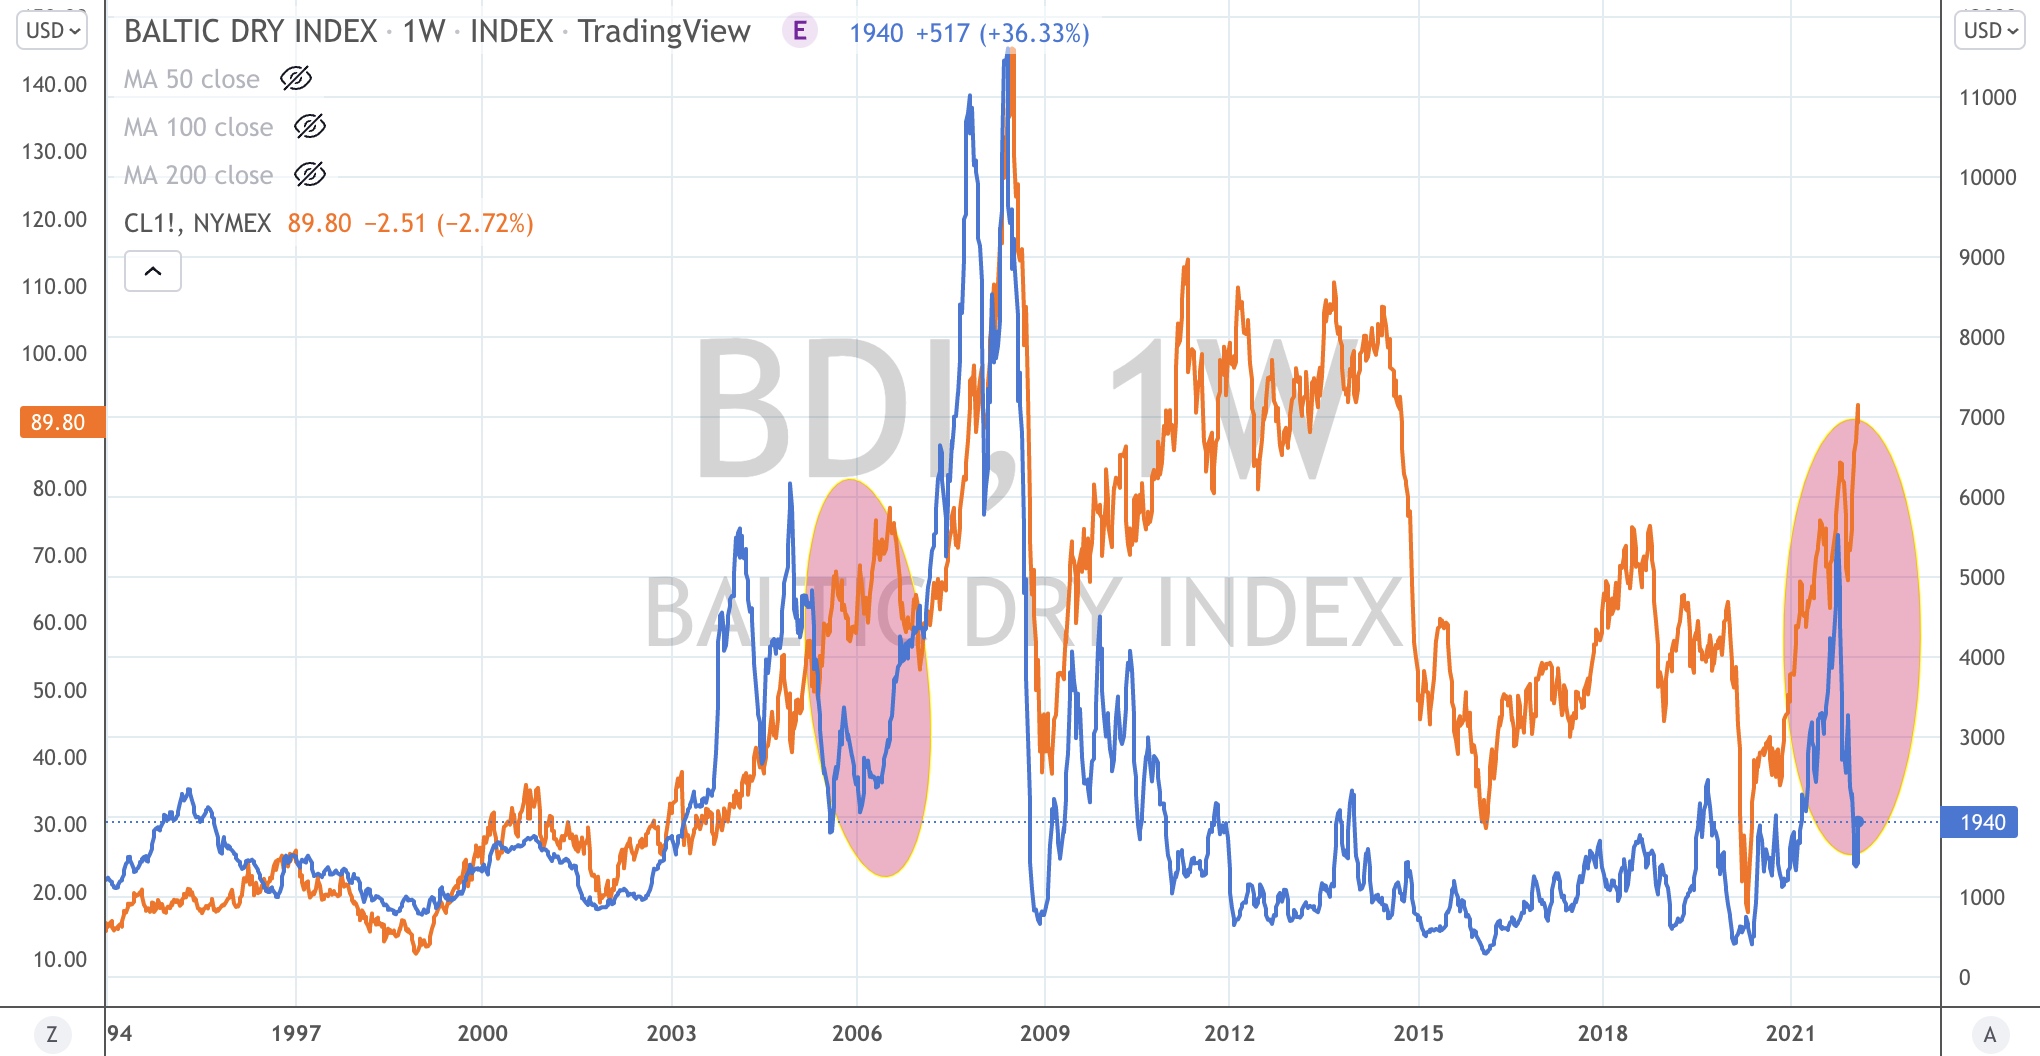
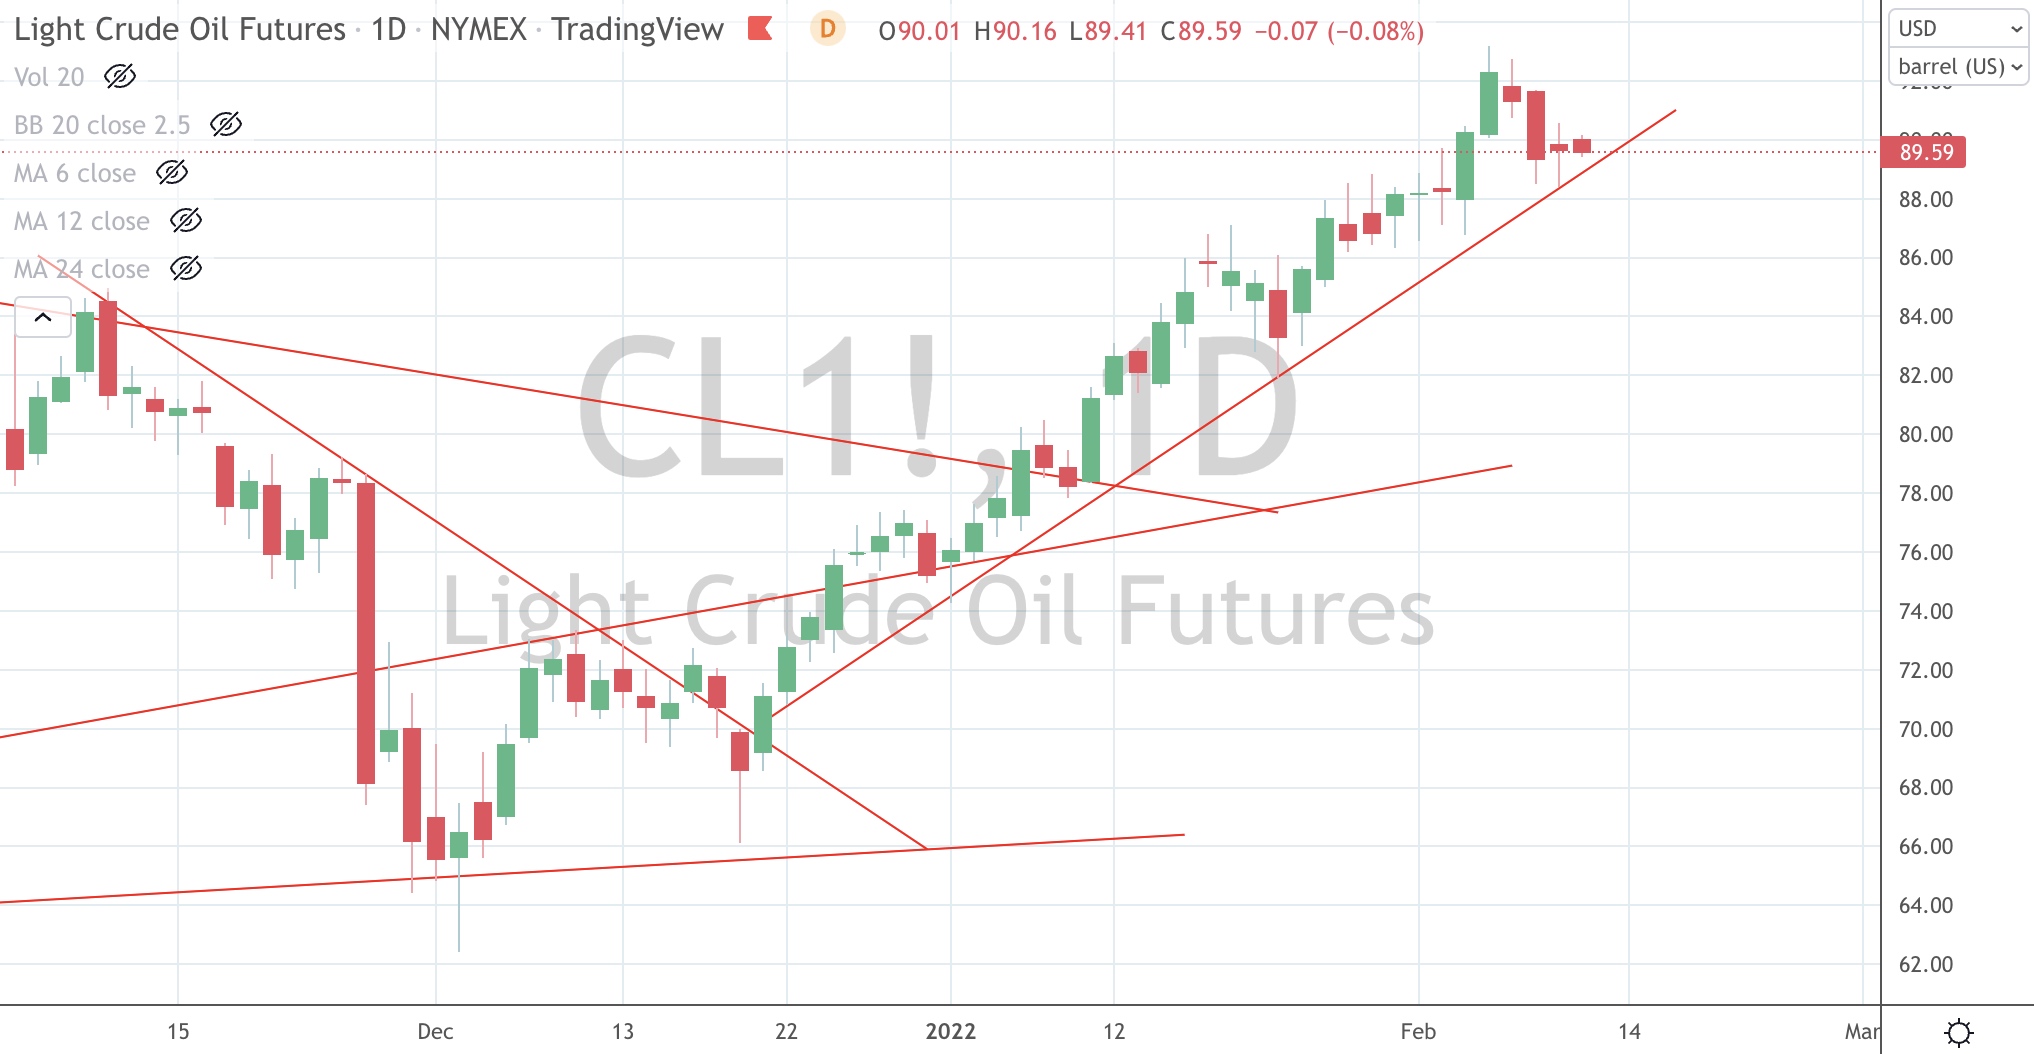
Beyond flooding his mates in Ukraine with more American weapons and ammunition, other incentives for Biden to cite that a war is imminent is that he’ll be able to blame Russia’s aggression for the higher oil and gasoline prices his citizens are experiencing. 

(It’s also plausible Ukraine has some ‘dirt’ on the Biden’s too)

In turn, higher energy prices creep into corporate operating costs which may lead into a lower GDP figure in the coming quarters.

Then corporations can also be blamed for passing on higher costs.

The main point is that Biden isn’t blamed for rising costs and inflation because he really needs to wins these mid-term elections in December.

Also, have you noticed France’s involvement in trying to broker talks.

In 2019, Macron declared NATO brain-dead.

Today, Macron has ‘arranged’ for a summit between Putin and Biden.

In the interim, I am surprised by Blinken’s rhetoric recently changing from pacifist to belligerent, to side more with Biden’s stance.

This is contrary to the paper Blinken wrote in 1987, titled Ally vs Ally.

Should Biden ‘negotiate a retreat’, he will certainly take credit for his toughness hoping this elevates his standing in the polls.

Although, if a war does eventuate, it’ll be brought to you by CBS News, CNN and the lobbyists for various U.S. military manufacturers and suppliers.

February 21, 2022

by Rob Zdravevski

rob@karriasset.com.au

Macro Extremes (week ending February 18, 2022)

The following assets (on a weekly timeframe) registered an Overbought reading or traded more than 2.5 standard deviations above its rolling mean.

Extremes “above” the Mean (at least 2.5 standard deviations)

German 5 & 10 year government bond yields

U.S., Japanese & Portuguese 10 year government bond yields

KBW Banking Index

Gold (in AUD)

Overbought (RSI > 70)

Australian 2, 3 and 5 year government bond yields

U.S 2 & 5 year government bond yields

Korean, Russian and New Zealand 10 year government bond yields

CRB Index

Bloomberg Commodity Index

Australian Coal

Aluminium

Tin

WTI Crude

Cattle

Soybeans

The Overbought Quinella – Both Overbought and Traded at > 2.5 standard deviations above the weekly mean)

Australian 10 year government bond yields

Spanish, French, Greek & Italian 10 year government bond yields

Lean Hogs

And Singapore’s Strait Times Index (for 2 consecutive weeks)

Assets (securities) which touched the other side of the extreme, being Oversold (where the RSI is < 30) or were at least 2.5 standard deviations below its mean are;

Extremes “below” the Mean (at least 2.5 standard deviations)

CSI 300

Helsinki OMX 25

Oversold (RSI < 30)

U.S. 10 year minus 2 year government bond yield spread

Hot Rolled Coil Steel (HRC)

The Oversold Quinella – Both Overbought and Traded at > 2.5 standard deviations above the weekly mean)

None

Notes & Ideas:

The big news is the careering of short duration bond yields into the stratosphere. Government 2 and 3 year bonds are now where 10 year bonds were yielding only 5 months (October 2021) ago.

After 6, 7 or 8 consecutive rising weeks, streaks come to an end and that was the case for many energy prices.

As was the case for last week’s overstretched prices in Coffee & Cotton.

Incidentally, Gasoline, Heating Oil and forward contracts in WTI Crude made bearish outside reversal weeks.

There is merit in referring back to the previous few weeks editions of ‘Marco Extremes’ to remind you of the relevance of the watching for the swings in the pendulum.

The larger advancers over the past week comprised of; 

Gold 3.1%, Hogs 20.9%, Natural Gas 12.4%, Nickel 2.5%, Palladium 6.6%, Platinum 5.7%, Silver 2.7% and Gold in AUD rose 2.1%.

The group of decliners included ;

Rotterdam Coal (2.9%), Cocoa (6.1%), WTI Crude (3.1%), Gasoil (1.9%), Heating Oil (4.5%), JKM (3.1%), Coffee (2.4%), Lumber (3.5%), Gasoline (2.5%), Cotton (3.3%), Dutch TTF Gas (4.7%), Oats (8.4%), KBW Banking Index (3%), AEX (2.2%), DAX (2.5%), Dow Jones Industrial (1.8%), Milano MIB (1.7%), HSCEI (2.8%), Hang Seng (2.3%), IBEX (2.4%), MOEX (4.3%), Nasdaq 100 (1.7%), Nikkei 225 (2.1%), Oslo (2%), Copenhagen (2.8%), Helsinki (2.9%), Stockholm (4.2%), Swiss SMI (1.8%), FTSE 100 (1.9%) and the S&P 500 fell 1.6% (having fallen 3.4% in the past 2 weeks.

February 20, 2022

by Rob Zdravevski

rob@karriasset.com.au 

Don’t buy at the wrong time

This chart below (and commentary) shows you when you should be buying Aluminium or associated proxies (such as Alcoa) and the power of operational leverage that a corporation can provide shareholders.

The blue line is the rolling 200 week moving average.

Gravity does exist.

While the theme of “having industrial capacity in moments of output gaps” remains intact, at this moment, it is a sellers market.

Beware of chasing the bullish (metals and energy) commodity prices higher.

It’s also the start of an odd period where higher prices of finished goods (due to the higher price paid by buyers of raw/base/industrial commodities) may be left on the shelf.

Rising prices have been evident but we can’t assume that higher prices are automatically paid for.

February 18, 2022

by Rob Zdravevski

rob@karriasset.com.au

Watching Woodside

I’m watching if Woodside Energy’s (WPL.AX) stock price breaks $27.60 this week.

If it does, it portends a move to the $30 level into a late March/early April window, with $30.85 being major resistance.

A break above $27.60 means the stock is making a ‘higher high’ than the same price seen in January 2021.

This is a market where I’m watching whether stocks are making ‘higher highs’ or ‘lower lows’ than their previous mark.

The overall message is that it’s a sellers market at these various levels.

And if the $27.60 level fails to be broken, selling at $26.50 (on the way down) will also be appropriate.

Buyers at today’s prices are playing for the last possible 10%, while medium term downside is 15% (back to $23.40)… makes for a terrible risk/reward consideration.

Coinciding with my Overbought Brent note (which I published immediately prior to this), Woodside’s stock price is also overbought on a Weekly basis and only its 6th such occurrence since 2007.

Furthermore, Woodside is mean reverting towards its 200 week moving average (that’s the blue line on the chart below).

February 14, 2022
by Rob Zdravevski
rob@karriasset.com.au

Brent at stretched percentages

I’m studying correlation, convergence & divergence activity across a cross selection of assets.

Oil is featuring heavily in my macro work.

Below is a chart of Brent Crude which shows it touching historic peak of the percentage it is trading above its 200 week moving average.

This also coincides with a visit to a longer term resistance line.

I’ll also watch currency crosses such as AUD/JPY to help me stay on the correct side of the move.

Fundamentally, sustained higher oil prices will crimp corporate earnings and stifle GDP expansion.

February 14, 2022

by Rob Zdravevski

rob@karriasset.com.au

Macro Extremes (week ending February 11, 2022)

The following assets (on a weekly timeframe) registered an Overbought reading or traded more than 2.5 standard deviations above its rolling mean.

Extremes “above” the Mean (at least 2.5 standard deviations)

U.S. 10 year government bond yields

KBW Banking Index

Cocoa 

Copper

Rice

Palladium

Overbought (RSI > 70)

Australian 2, 3 and 5 year bond yields

Russian and New Zealand 10 year government bond yields

CRB Index

Bloomberg Commodity Index

Australian Coal

Aluminium

Tin

Heating Oil

Brent Crude

WTI Crude

Gasoil

Gasoline

Cattle, Cotton and Coffee

The Overbought Quinella – Both Overbought and Traded at > 2.5 standard deviations above the weekly mean)

Australian 10 year government bond yields

U.S. 2 and 5 year government bond yields

German 2, 5 and 10 year government bond yields

Spanish, French, Greek, Italian, U.K. Japan, Korean, Swedish and Portuguese 10 year government bond yields

Soybeans

And Singapore’s Strait Times Index

Assets (securities) which touched the other side of the extreme, being Oversold (where the RSI is < 30) or were at least 2.5 standard deviations below its mean are;

Extremes “below” the Mean (at least 2.5 standard deviations)

Shanghai Composite

CSI 300

South Korea’s KOSPI

ASX 200

Oversold (RSI < 30)

U.S. 10 year minus 2 year government bond yield spread

Hot Rolled Coil Steel (HRC)

The Oversold Quinella – Both Overbought and Traded at > 2.5 standard deviations above the weekly mean)

None

Notes & Ideas:

The big news is the careering of short duration bond yields into the stratosphere. Government 2 and 3 year bonds are now where 10 year bonds were yielding only 5 months (October 2021) ago.

Subjectively, this tells me rate rises are being factored into and the longer bond yields are a better indicator than the distorted short end.

Watch for retracements following parabolic price moves.

Equities were mostly higher global for the week, with the exception of major U.S. indices. Asian equity markets caught a bid (whilst remaining unloved), Korea’s KOSPI is bouncing off an Oversold position while the U.K.’s FTSE 100 is approaching Overbought territory.

In other ‘big news’, the price of shipping soared 39% for the week.

The pullbacks and predictions of a low appear here;

and

I also think the price of Shipping and Oil will converge, as written here,

It’s no surprise to see lower Gasoline and Gas related prices lower, while recent extremes in currencies have abated.

In other tidbits of interest, the SOX is trading at the same price as last June (2021), WTI Crude, albeit squeezes out a 8th consecutive ‘up’ week, although it only rose 0.9% for the week amidst Russian/Ukraine tensions and Bitcoin can’t close above $44,000 on a weekly basis.

Continuing from last week, he CRB remains Overbought, German 10 year bond yields are above Zero, a bunch of bonds yields (as per last week’s ‘Extremes’) are at multi-year highs, 

Inversely, not many think yields or commodity prices can retrace or abate…

Reiterating at week’s comment, the U.S. yield curve has flattened and is now at its lowest since March 2020. This is a reasonably positive signal for equities, which I highlighted in this article, dated July 8, 2021.

And from the books of Pattern Recognition….

And I’m also repeating that 1 barrel of Oil is now buying the least amount of ounces of Gold (the Oil/Gold Ratio is $19.80) not seen since April 2019.

In fact, the Oil/Gold ratio is now back to $19.80, a level not seen since April 22, 2019.

Incidentally, that date also signalled the high in WTI Crude Oil and was followed by a 23% decline over the next 6 weeks. That peak was not re-broken until March 2021.

Equally, Copper put in a high of $3.00 that week, to then dropped 33% over the next 11 months.

That peak of $3.00 was not re-broken until the week of August 3, 2020

Spookily, that decline in Copper from its April 2019 levels, started from a lower low which was 9% below the previous high which was set 11 months earlier.

Today, Copper is 9% below a higher high, which was set 11 months earlier.

Inversely, Gold found a floor that same week and commenced a notable rally from $1,200 and peaked at $2,075 in the week of August 3rd, 2020.

So your trade positioning is exiting your overpriced Oil and Copper exposures (this will aide my Short Commodities and CRB call) and accumulate Long’s in Gold and perhaps other precious metals.

And we’ll watch the AUDJPY whether it makes a higher high or a lower low.

The larger advancers over the past week comprised of; 

Aluminium 5.4%, Rotterdam Coal 3.6%, Baltic Dry Index 39%, China Coal 11.4%, Cocoa 5.4%, Gold futures 1.9%, Gold in AUD 2%, Gold in USD 2.8%, Gold in EUR 3.8%, Hogs 4%, Coffee 4.2%, Lumber 13.7%, Gasoline 2.2%, Silver 4%, Brent Crude 2.4%, Corn 4.9%, Oats 2.6%, Soybeans 1.9%, Wheat 4.5%, Shanghai 3%, AEX 1.9%, DAX 2.2%, IBEX 2.4%, FTSE 100 1.9%, HSCEI 2.3%, TAEIX 3.3%, Russia’s MOEX 4.2%, Straits Times 2.9% (rising 5.5% in 2 weeks) and Istanbul 4.6%.

The group of decliners included ;

Gasoil (2.9%), JKM (3.1%), LNG (11%), Natural Gas (13.8%), Palladium (4.2%) down 8% in 2 weeks, Dutch TTF Gas (6.3%) down 17% in 2 weeks), Urea (11.7%), Nasdaq (3%), Philadelphia Semiconductor Index ‘SOX’ (2.5%) and the S&P 500 fell 1.8%.

February 13, 2022

by Rob Zdravevski

rob@karriasset.com.au

Shipping and Oil prices to converge

The coming convergence between the prices of the Baltic Dry Index (BDI) and West Texas Intermediate (WTI) Crude Oil.

There have been 2 distinct divergences between the prices of these two prices over the past 30 years.

We are in amongst one of them now.

I’ve recently written about the ‘satisfied’ lows in the BDI and only days ago, cited Overbought conditions in the WTI as its poised on a ‘support’ line.

My bet is that shipping prices rise again and the price of oil moderates.

February 11, 2022

by Rob Zdravevski

rob@karriasset.com.au

$9 lower if it can’t hold support

With recording its 7th straight “up” week (those streaks don’t occur too often) along with a Weekly Overbought RSI, next month OPEC+ will increase output by 400,000 barrels and oil rig counts are rising….and then, what if, what if Ukraine/Russian tensions subside??

I’ll watch if WTI Crude holds this support line.

If not, it may be a quick $8-$9 decline.

It would certainly be welcomed, for rising energy costs will surely crimp corporate earnings in the next couple quarters.

February 10, 2022

by Rob Zdravevski

rob@karriasset.com

The Canadians are drilling more

69 more oil or gas rigs were put to work in January 2002, when compared to immediately previous month.

Canadians were responsible for 40, as they increased their rig count by 27% from December to January.

Whoot ! Oil Sands must be economical with WTI Crude at $90

February 10, 2022

by Rob Zdravevski

rob@karriasset.com.au.

Macro Extremes (week ending February 4, 2022)

Extremes “above” the Mean (at least 2.5 standard deviations)

Japanese, Chinese and Swedish 10 year government bond yields

Rice

US dollar Index (DXY)

Palladium

Overbought (RSI > 70)

Australian 2 and 5 year bond yields

U.S. 2 and 5 year government bond yields

Russian, Korean and U.K. 10 year government bond yields

Australian Coal

Heating Oil

Brent Crude

Cattle

Cotton

The Overbought Quinella – Both Overbought and Traded at > 2.5 standard deviations above the weekly mean)

German 2, 5 and 10 year government bond yields

Spanish, French, Greek, Italian and Portuguese 10 year government bond yields

CRB Index

Bloomberg Commodity Index

WTI Crude

Gasoil

Soybeans

Extremes “below” the Mean (at least 2.5 standard deviations)

KBW U.S. Bank Index

Shanghai Composite

CSI 300

South Korea’s KOSPI

Nikkei 225

ASX 200

Oversold (RSI < 30)

U.S. 10 year minus 2 year government bond yield spread

Hot Rolled Coil Steep (HRC)

The Oversold Quinella – Both Overbought and Traded at > 2.5 standard deviations above the weekly mean)

None

Notes & Ideas:

This week’s big news was a combination highs not seen for some time in the CRB Index and certain bond yields.

The CRB Index touched its highest level since December 2014 and is currently Overbought and trading at a notable resistance level. (A previous post makes a call for lower commodity prices)

The biggest move in bond yields was seen in the German 2 year’s which rose from (0.67%) to (0.26%). The German 10’s traded ‘positive’ up to 0.2%, for the first time (and their highest) since April 2019.

The yields in the U.K. Gilts haven’t seen their current level since October 2018 and the JGB’s (Japan) are re-visiting their January 2016 levels.

On the other side of the bond market, saw the Chinese 10 year yields at their lowest since May 2020.

While the U.S. yield curve has flattened and is at its lowest since October 2020. This is a reasonably positive signal for equities, which I highlighted in this article, dated July 8, 2021.

Meanwhile Gold is trading around an important support level….

And today, 1 barrel of Oil is buying the least amount of ounces of Gold since April 2019, thus moving back into its historically average range. I monitor this via the Crude (WTI) Oil / Gold ratio.

Amongst the agricultural’s, the price of rice is seldom discussed, yet it is rising and often carries more acute concerns around food security.

The chart below also shows the coincidence of when a parabolic move in Rice (accompanied by an Overbought weekly) signal, also leads to a temporary peak in equities resulting in either a decline or sideways travel.

In other news, equity markets bouncing from oversold levels seen 10 days ago. One example is Korea’s KOSPI bouncing 3.3% off a 14 month low

And we’ll watch the AUDJPY.

The larger advancers over the past week comprised of; 

WTI Crude 6.3% (up 21% in 5 weeks), Gasoil 6.2%,  Australian Coal 6.2%, Bloomberg Commodity Index 2.3%, Baltic Dry Index 3%, Cocoa 7%, Copper 4.1%, Heating Oil 3.2%, HRC 1.7%, Coffee 2.5%, Lumber 4.4%, Nickel 2.9%, Platinum 1.8%, Gasoline 5.5%, CRB Index 3.3%, Brent Crude 2.3%, urea 3%, Rice 2%, Soybeans 5.7%, Oats 8.2%, Cotton 2.4%, KBW Bank Index 4.2%, HSCEI 4.6%, Hang Seng 4.3%, Kospi 3.3%, Midcap 400 1.8%, Nasdaq 100 1.7%, Nikkei 225 2.7%, Sensex 2.5%, Oslo Bors 1.9%, Russell 2000 1.7%, Philadelphia Semiconductor Index (SOX) 4.5%, S&P 500 1.6%, Straits Times 2.6% and the ASX 200 rose 1.9%.

The group of decliners included ;

Japan Korea ‘JKM’ Marker (5.5%), Orange Juice (8.4%) – remember to was Overbought last week, Dutch TTF Gas (9.9%), Corn (2.4%), Whet (2.9%), Palladioum (3.6%) and Istanbul (2%). 

February 6, 2022

by Rob Zdravevski

rob@karriasset.com.au