Macro Extremes (week ending February 4, 2022)
February 6, 2022 Leave a comment
Extremes “above” the Mean (at least 2.5 standard deviations)
Japanese, Chinese and Swedish 10 year government bond yields
Rice
US dollar Index (DXY)
Palladium
Overbought (RSI > 70)
Australian 2 and 5 year bond yields
U.S. 2 and 5 year government bond yields
Russian, Korean and U.K. 10 year government bond yields
Australian Coal
Heating Oil
Brent Crude
Cattle
Cotton
The Overbought Quinella – Both Overbought and Traded at > 2.5 standard deviations above the weekly mean)
German 2, 5 and 10 year government bond yields
Spanish, French, Greek, Italian and Portuguese 10 year government bond yields
CRB Index
Bloomberg Commodity Index
WTI Crude
Gasoil
Soybeans
Extremes “below” the Mean (at least 2.5 standard deviations)
KBW U.S. Bank Index
Shanghai Composite
CSI 300
South Korea’s KOSPI
Nikkei 225
ASX 200
Oversold (RSI < 30)
U.S. 10 year minus 2 year government bond yield spread
Hot Rolled Coil Steep (HRC)
The Oversold Quinella – Both Overbought and Traded at > 2.5 standard deviations above the weekly mean)
None
Notes & Ideas:
This week’s big news was a combination highs not seen for some time in the CRB Index and certain bond yields.
The CRB Index touched its highest level since December 2014 and is currently Overbought and trading at a notable resistance level. (A previous post makes a call for lower commodity prices)
The biggest move in bond yields was seen in the German 2 year’s which rose from (0.67%) to (0.26%). The German 10’s traded ‘positive’ up to 0.2%, for the first time (and their highest) since April 2019.
The yields in the U.K. Gilts haven’t seen their current level since October 2018 and the JGB’s (Japan) are re-visiting their January 2016 levels.
On the other side of the bond market, saw the Chinese 10 year yields at their lowest since May 2020.
While the U.S. yield curve has flattened and is at its lowest since October 2020. This is a reasonably positive signal for equities, which I highlighted in this article, dated July 8, 2021.
Meanwhile Gold is trading around an important support level….
And today, 1 barrel of Oil is buying the least amount of ounces of Gold since April 2019, thus moving back into its historically average range. I monitor this via the Crude (WTI) Oil / Gold ratio.
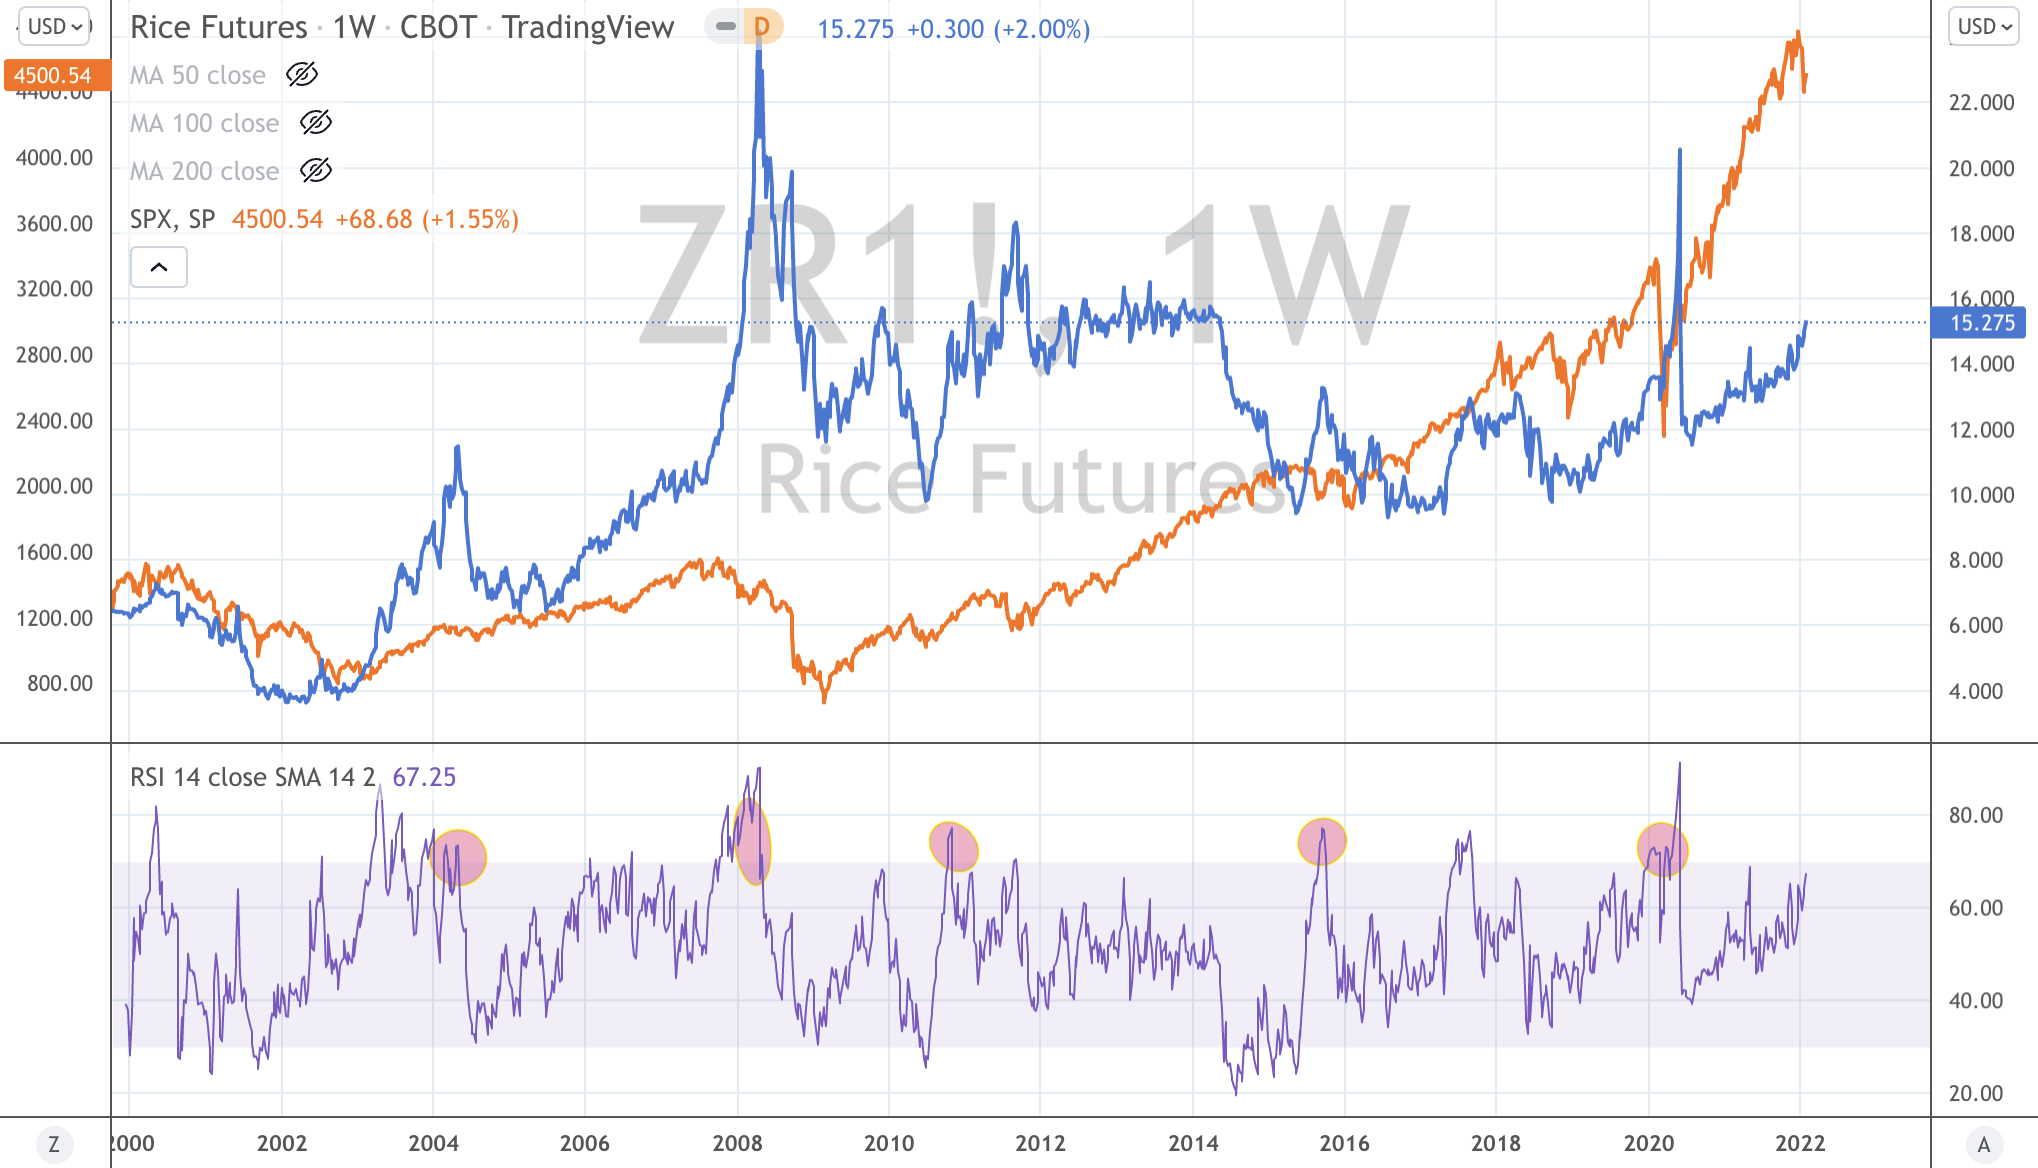
Amongst the agricultural’s, the price of rice is seldom discussed, yet it is rising and often carries more acute concerns around food security.
The chart below also shows the coincidence of when a parabolic move in Rice (accompanied by an Overbought weekly) signal, also leads to a temporary peak in equities resulting in either a decline or sideways travel.
In other news, equity markets bouncing from oversold levels seen 10 days ago. One example is Korea’s KOSPI bouncing 3.3% off a 14 month low
And we’ll watch the AUDJPY.
The larger advancers over the past week comprised of;
WTI Crude 6.3% (up 21% in 5 weeks), Gasoil 6.2%, Australian Coal 6.2%, Bloomberg Commodity Index 2.3%, Baltic Dry Index 3%, Cocoa 7%, Copper 4.1%, Heating Oil 3.2%, HRC 1.7%, Coffee 2.5%, Lumber 4.4%, Nickel 2.9%, Platinum 1.8%, Gasoline 5.5%, CRB Index 3.3%, Brent Crude 2.3%, urea 3%, Rice 2%, Soybeans 5.7%, Oats 8.2%, Cotton 2.4%, KBW Bank Index 4.2%, HSCEI 4.6%, Hang Seng 4.3%, Kospi 3.3%, Midcap 400 1.8%, Nasdaq 100 1.7%, Nikkei 225 2.7%, Sensex 2.5%, Oslo Bors 1.9%, Russell 2000 1.7%, Philadelphia Semiconductor Index (SOX) 4.5%, S&P 500 1.6%, Straits Times 2.6% and the ASX 200 rose 1.9%.
The group of decliners included ;
Japan Korea ‘JKM’ Marker (5.5%), Orange Juice (8.4%) – remember to was Overbought last week, Dutch TTF Gas (9.9%), Corn (2.4%), Whet (2.9%), Palladioum (3.6%) and Istanbul (2%).
February 6, 2022
by Rob Zdravevski
rob@karriasset.com.au