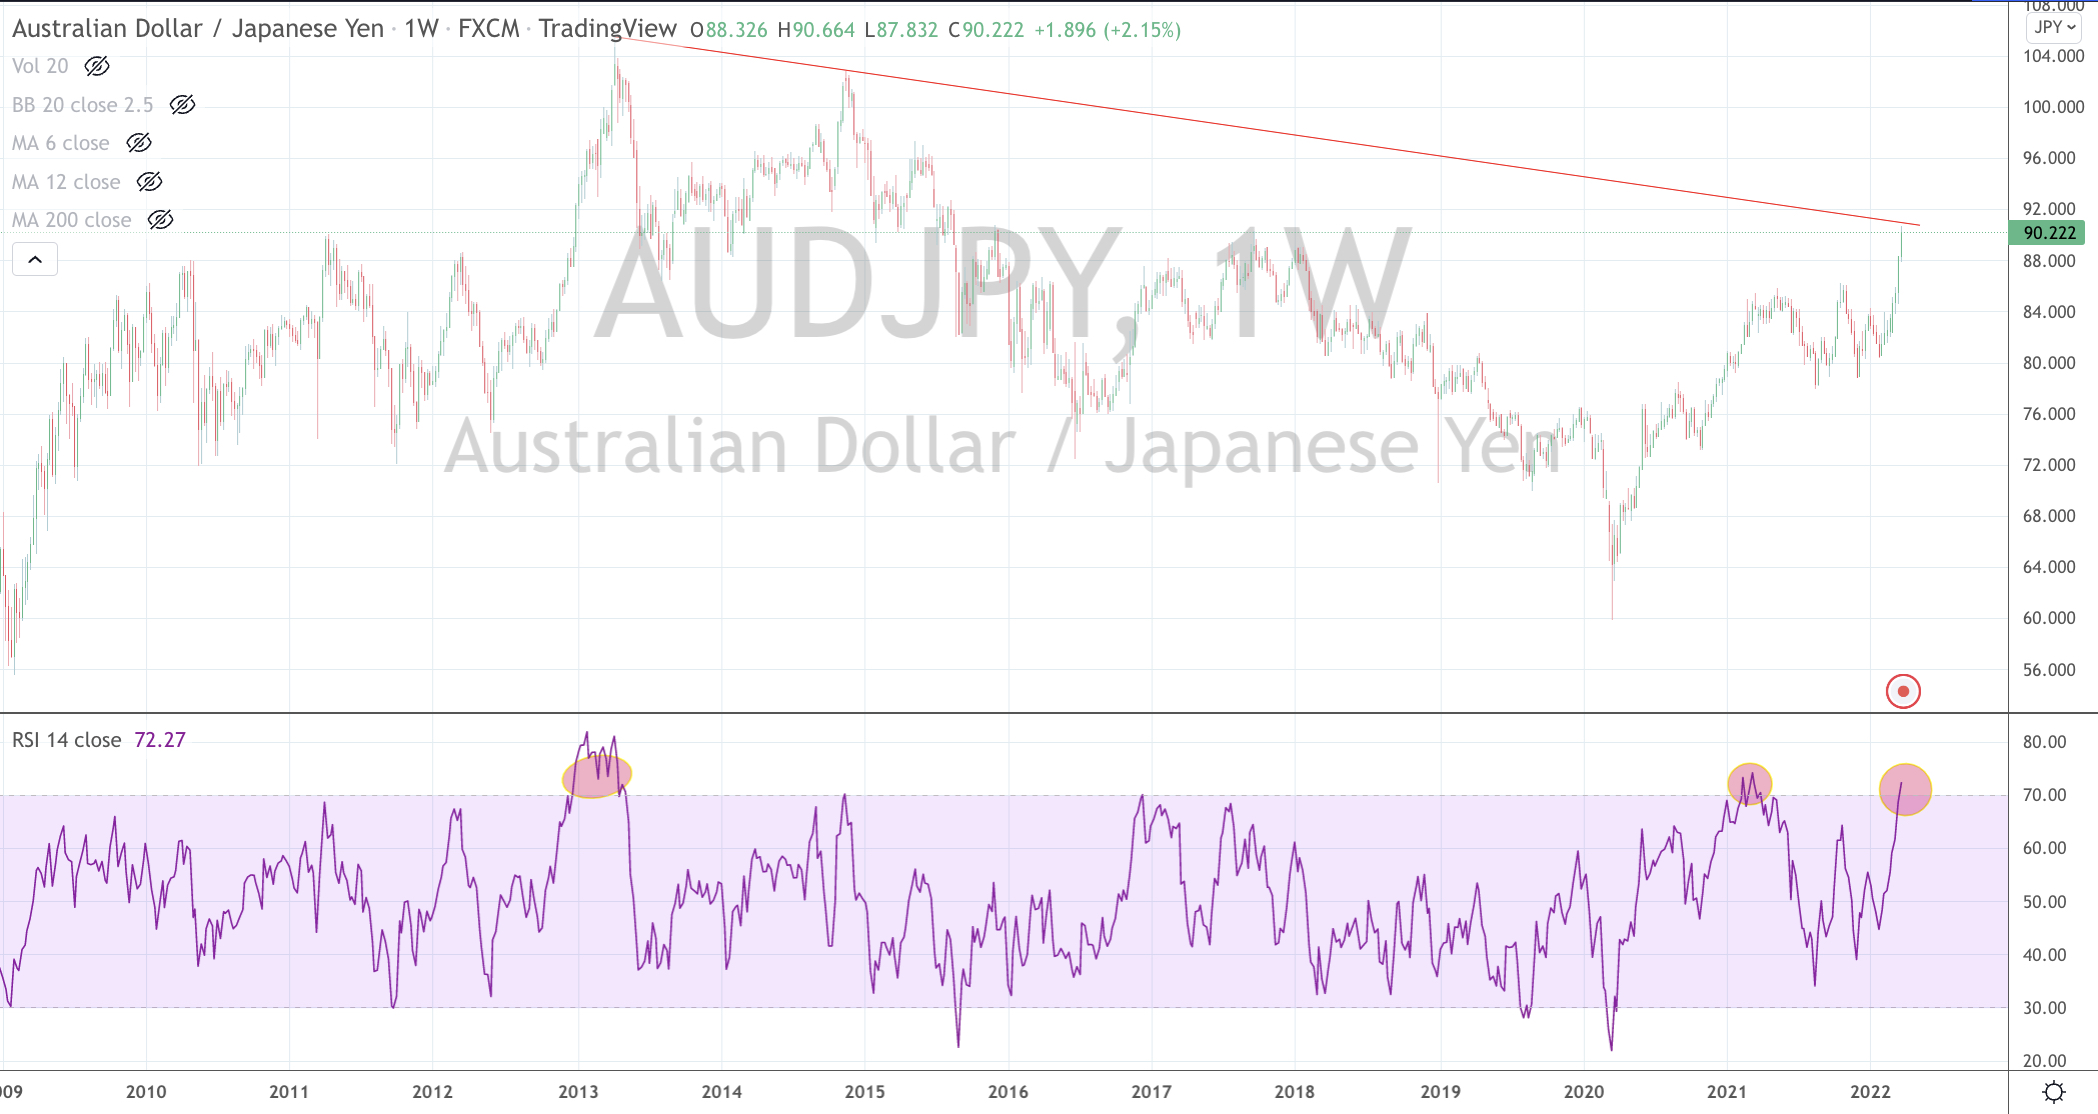
One of the more decisive currency moves over the past 2 years has been the 50% rise in the AUD versus the JPY.
Today, it’s recording its highest level since November 2015.
This often watched indicator of risk-on/risk-off sentiment has reached an overbought level seldom seen and when coupled with its butting up against a resistance line, makes me think the ‘fat part of the trade’ has been had.
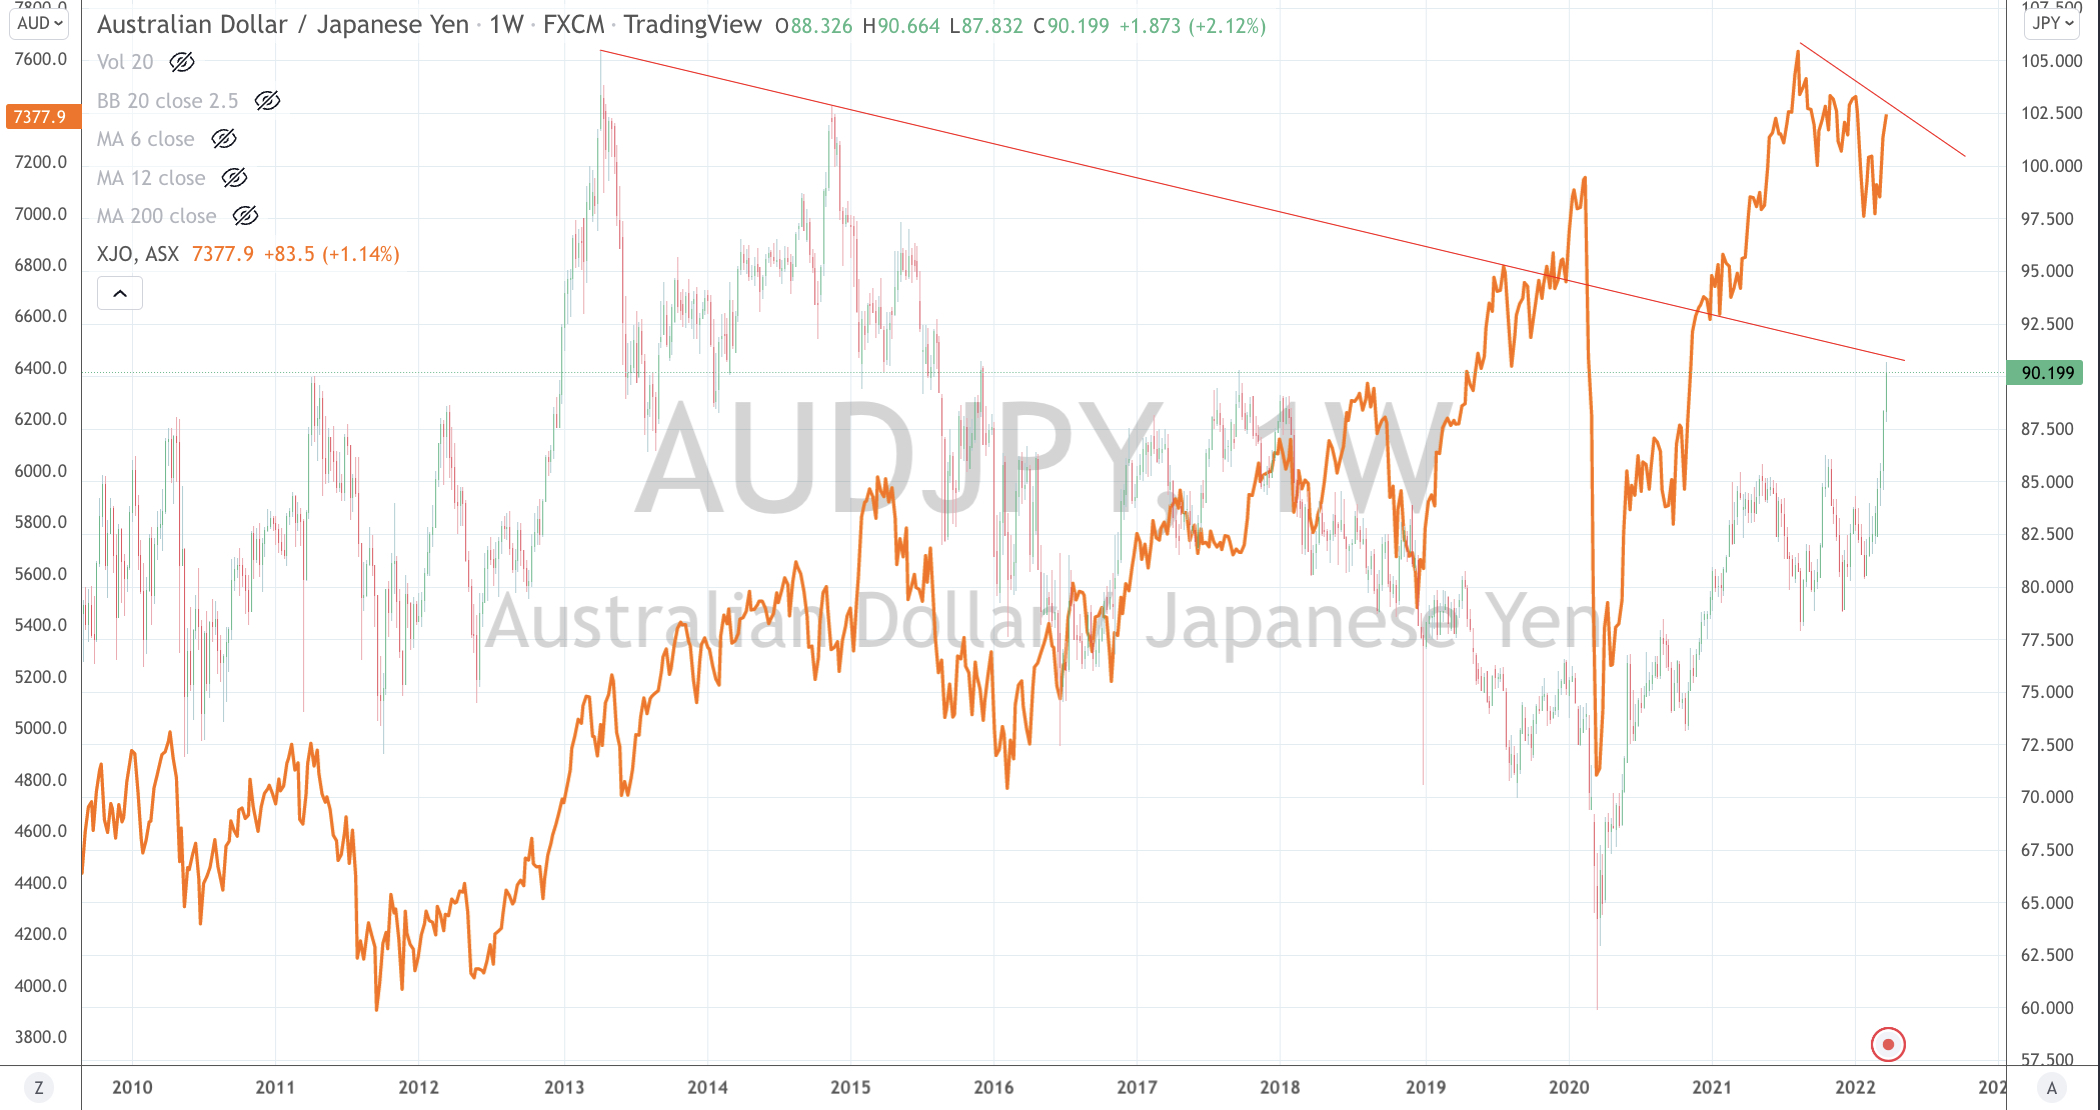
In the other chart below, I’ve overlaid the ASX 200 index and coincidentally it too is tickling a resistance line.
You see a nice companionship between the two.
So now, I’ll sell some AUD and buy JPY.
What to do then?
There are plenty of good Japanese businesses, not expensively valued and are conservatively operated which are carrying 20% of their market capitalisation in cash.
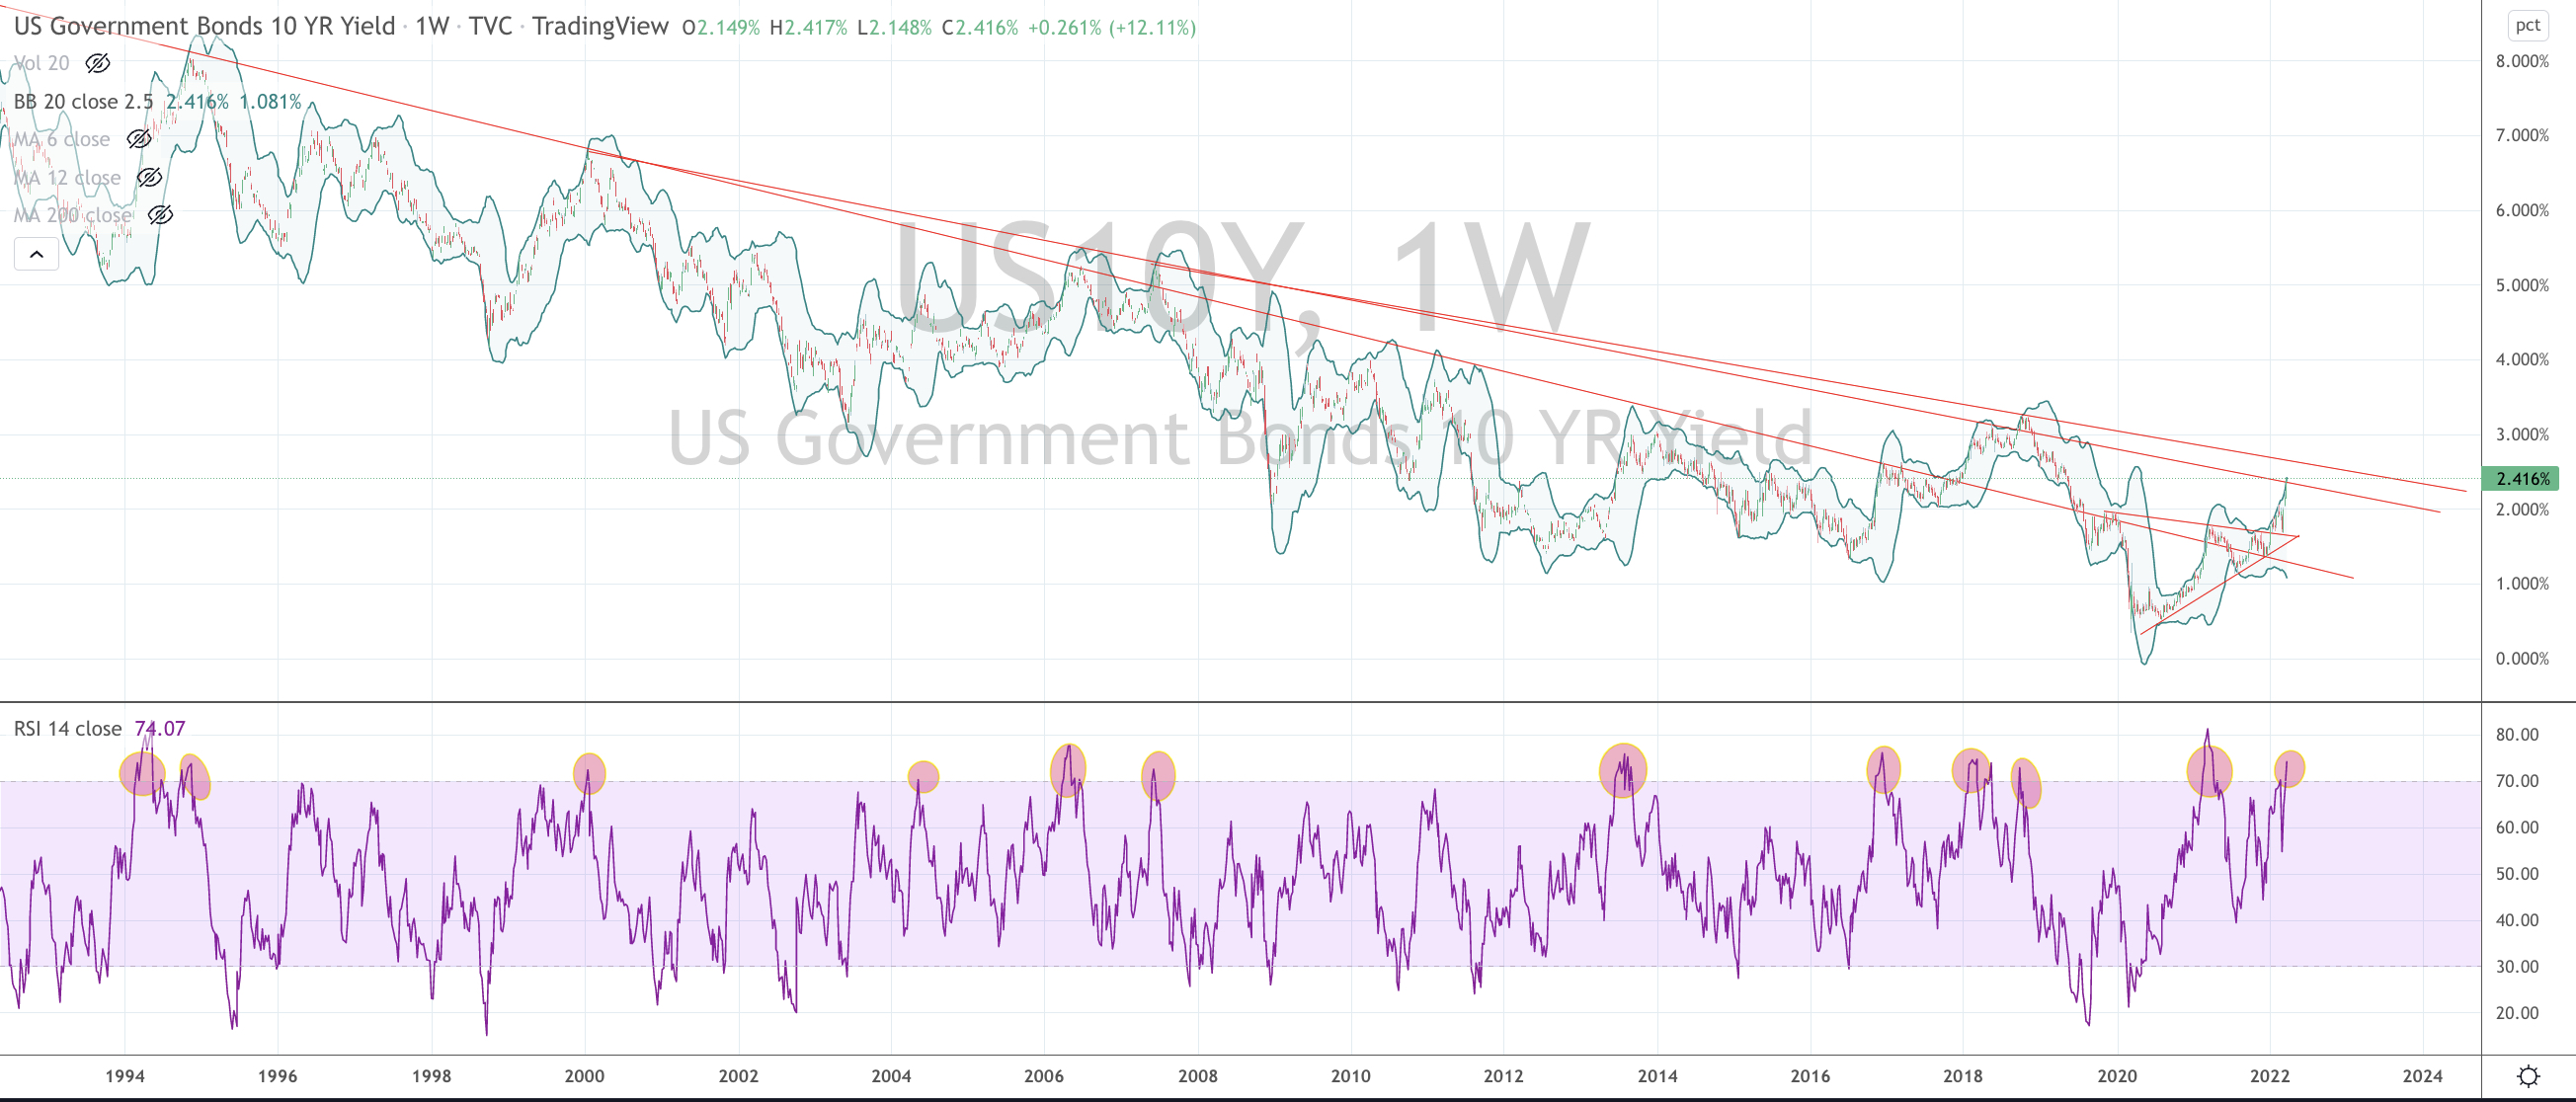
U.S. 10 year bond yield are at ‘overbought extremes’.
At 2.41%, it’s kinda done or at the least, at the upper end of being so.
I’ll give a move to 2.6% (that downward sloping resistance line in the chart below) but I’ll say that you don’t want to be shorting bonds at these levels.
Beyond the subjective notion that short bonds is a crowded trade and the chart below showing a unison registration of a 70 RSI reading (it’s 12th visit in 30 years) with a 2.5 weekly standard deviation above the mean, my other work tells me that the 10’s are the most stretched since October 2018.
In fact, other than 2018 and now, we haven’t seen the 10’s this ‘stretched’ at any other time in 40 years of data.
Additionally, the U.S. 10 year bond yields have doubled in 8 months and quadrupled in 18 months.
If you think 2.4% is low compared to where we once came from, the quantum of this ‘recent’ move should count for something.
p.s. once again, tune in to the noise amongst the market pundits, chat rooms and the media again. ‘Today’s’ hyper-ventilation is now about falling bond market yields.
Similar to recent moments seen in Nickel, Oil, Crypto, Wheat, Chinese equities etc etc, consider the opposite side of what the crowd is crowing about.
It’s funny, I just can’t seem to remember ‘them’ saying anything when interest rates were 1%……
The following assets (on a weekly timeframe) registered an Overbought reading or traded more than 2.5 standard deviations above its rolling mean.
Extremes “above” the Mean (at least 2.5 standard deviations)
Brazil and Canadian 10 year government bond yields
Gold (in USD and AUD)
AUD/JPY
DXY (U.S. Dollar Index)
TBT & TBX (U.S. listed “Short” bond ETF’s), confirming the inverse reading of the overbought U.S. bond yields listed in the next category.
Overbought (RSI > 70)
Australian 2, 3, 5 & 10 year government bond yields
U.S. 2, 5 & 10 year government bond yields
Greek, Spanish, Turkish & Korean 10 year government bond yields
Australian Coal
CRB Index
Bloomberg Commodity Index
Heating Oil
Nickel
Gasoline
Corn
Soybeans
The Overbought Quinella – Both Overbought and Traded at > 2.5 standard deviations above the weekly mean)
New Zealand 10 year government bond yields
Uranium
Assets (securities) which touched the other side of the extreme, being Oversold (where the RSI is < 30) or were at least 2.5 standard deviations below its mean are;
Extremes “below” the Mean (at least 2.5 standard deviations)
EUR/USD
GBP/USD
HKD/USD
DKK/USD
JPY/USD
KRW/USD
Taiwan’s TAIEX equity index
Oversold (RSI < 30)
U.S. 10 year minus 2 year government bond yield spread
U.S. 10 year minus 5 year government bond yield spread (as it flirts with inverting)
(Now at the same level as March 9th, 2020)
The Oversold Quinella – Both Overbought and Traded at > 2.5 standard deviations above the weekly mean)
CSI 300 equity index
Notes & Ideas:
The big news in this week’s edition is the decidedly smaller list of overbought commodities prices as many took a break from their recent surges.
Other news amongst performance was the rally in global indices while many currencies eased away from their recent ‘extremes’.
Avid readers of this weekly edition may find cross-referencing last week’s edition with this one beneficial.
I’m seeing the AUD and USD at 4 year and 6 year respective highs agains the Japanese Yen;
The price of WTI Crude was down 14% at its lowest point this week (from last week’s close);
China’s CSI 300 and Germany’s DAX rose 8% from its intra-week low;
Amazingly, the HSCEI is 22% higher from the low seen earlier in the week, while the hang Seng’s 17.5% reversal along with the Nasdaq’s 11% isn’t too shabby either.
Frances’s CAC40 rose 7% from the week’s nadir and is up 15% overall from the previous week’s low and Germany’s DAX is similarly 16% higher from the same trough.
A small thing to watch is the Nasdaq performed a bullish outside reversal week while the S&P 500 didn’t.
The larger advancers over the past week comprised of;
Gasoil 5.2%, Copper 2.5%, Heating Oil 5.3%, Lumber 2.3%, LNG 14.5%, Natural Gas 2.9%, Orange Juice 6.5%, Cotton 4.8%, Oats 5%, Bitcoin 10.7%, MIB 5.1%, Hang Seng 4.3%, HSCEI 4.2%, AEX 6.2%, KBW Bank Index 6%, CAC 5.8%, DAX 5.8%, Dow Jones Industrials 5.2%, Nikkei 6.6%, Sensex 4%, DJ Transports 8.3%, Oslo 2.9%, IBEX 3.4%, Bovespa 3.2%, S&P 400 Midcap 5%, Nasdaq-100 8.4%, Russell 2000 5.4%, S&P 500 6.2%, Swiss SMI 6%, Philadelphia Semiconductor Index (SOX) 9.2%, Singapore’s STI 2.5%, Istanbul 5%, Copenhagen 6%, Helsinki 5.4%, Stockholm 5.2%, TAEIX 1.1%, FTSE-100 3.5% and Australia’s ASX-200 3.3%.
The group of decliners included;
Baltic Dry Index (4.2%) (understandably considering it rose 76% in the previous 6 weeks), Aluminium (2.6%), Rotterdam Coal (11%), B’berg CCI (2.4%), Cocoa (3.2%), WTI Crude Oil (5.7%), Gold (3.4%), GVX (11%), Lean Hogs (3.2%), JKM LNG (4.4%), Tin (3.2%), Nickell (12.2%), Palladium (10.9%) extending last week’s 6% decline), Platinum (4.8%), Gasoline (2.2%), Silver (4.1%), Dutch TTF Gas (20%) compounding last week’s 32% fall, Brent Crude (4%), Uranium (4.3%) pulling back part of last week’s 16% advance, Gold in AUD (5%), Corn (2.7%), Wheat (3.9%), Shanghai Composite (1.8%) and China’s CSI 300 equity index fell 1%.
BP said it will ‘exit’ its 20% holding in Rosneft.
Rosneft accounts for half of BP’s proven oil and gas reserves and one-third of its production.
What is an ‘exit’?
Is it a sale or a complete write-down?
It takes time to sell a $20 billion stake in a stock that the world doesn’t want to touch.
Or does BP accept payment in lieu of the government nationalising Rosneft securities?
It’s believed that BP’s Rosneft holding is worth $25 billion, while there is talk of a write-down provision or hit equalling $14 billion.
This is all quite notable when you consider BP’s market cap is $91 billion.
Interestingly, BP’s stock is trading at the same price (368p) when this news was announced on February 27, 2022.
Perhaps the market doesn’t believe that they will ‘sell’ or ‘exit’ once ‘things smoothen over’?
Keep in mind that in August 2020, BP announced its desired shift to reduce its oil and gas production by 40% by 2030.
BP has said it will no longer report reserves, production or profit for Rosneft.
Has BP just met its 2030 production reduction in a foul swoop, 8 years before schedule?
This could turn out to be a cleverly opportunistic move by BP’s CEO, Bernard Looney and his team.
Other companies such as BHP are also trying to reach their decarbonisation targets with the selling or transfer of selected assets but under less drastic conditions.
The Canadians are the only category in this month’s BH Rig Count to have the same or more rigs working than as at March 2020.
Finally, the price of oil is high enough to make those tar sands The rest of the world is yet to do get close to having the same amount of wells in operation.
The Middle East is lagging behind significantly. Perhaps it pays better to limit production supply?
While the African’s need to play a little more catch up, I think the European’s are stifled by ESG ’embarrassment’.
Other factors may also be at work. When wells are ’shut-in’, its not always certain they can be operable again. Some wells can collapse.
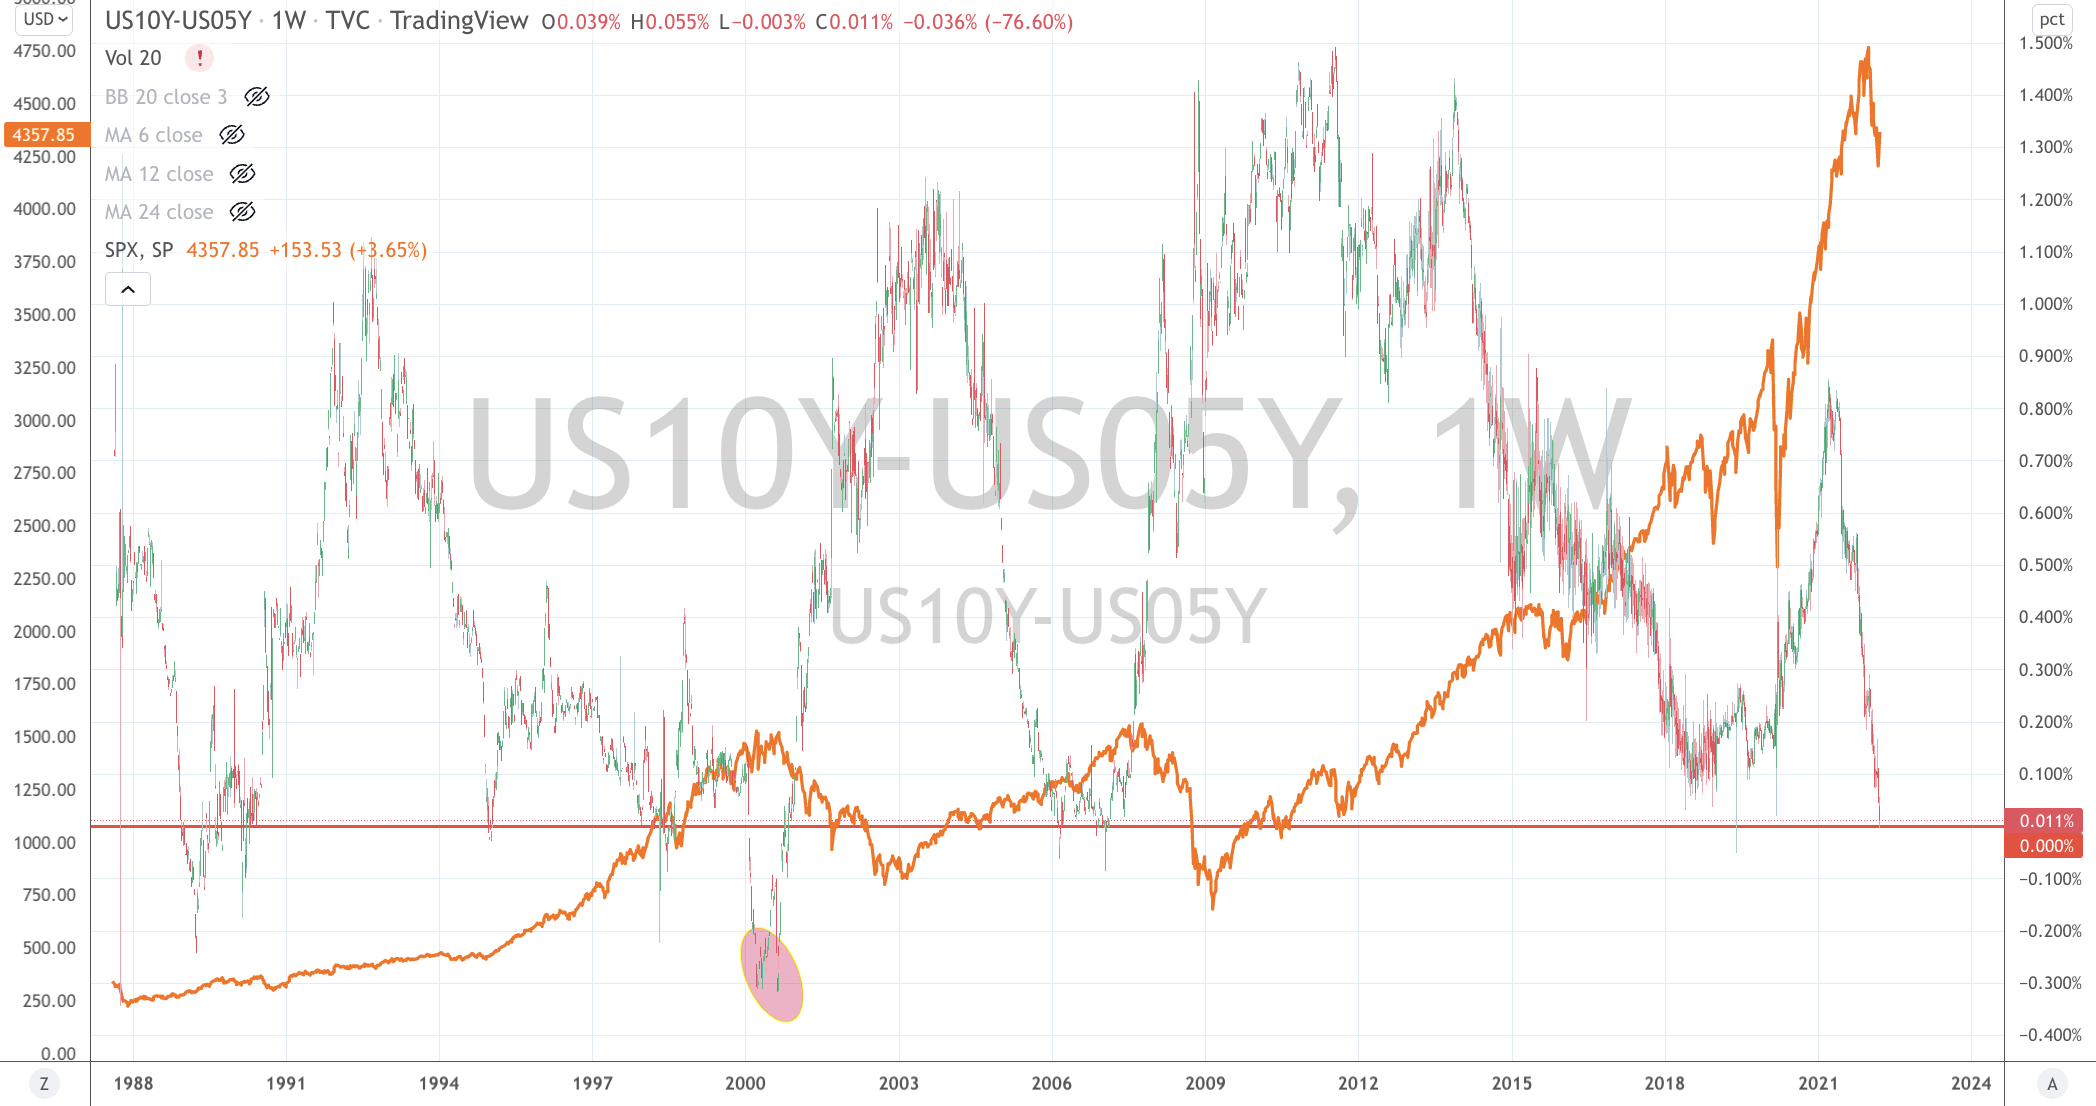
Financial media are excitedly reporting about the US10Y minus US05Y spread inverting.
Firstly, they’re grasping at straws seeking out any yield curve combination which may have inverted, albeit for a 2 hour period.
Secondly, if we gave them some credence for this one, inversions of this curve have not been an accurate timing signal of poorer returns ahead for the stockmarket.
Quite the contrary in most cases.
If ‘they’ choose to cite the 2000 period (as circled in the chart below), that also remains a long bow to draw.
It took the stock market 9 months to start turning lower after the US10-US5 curve initially inverted and to boot, it required some serious negative inverting action.
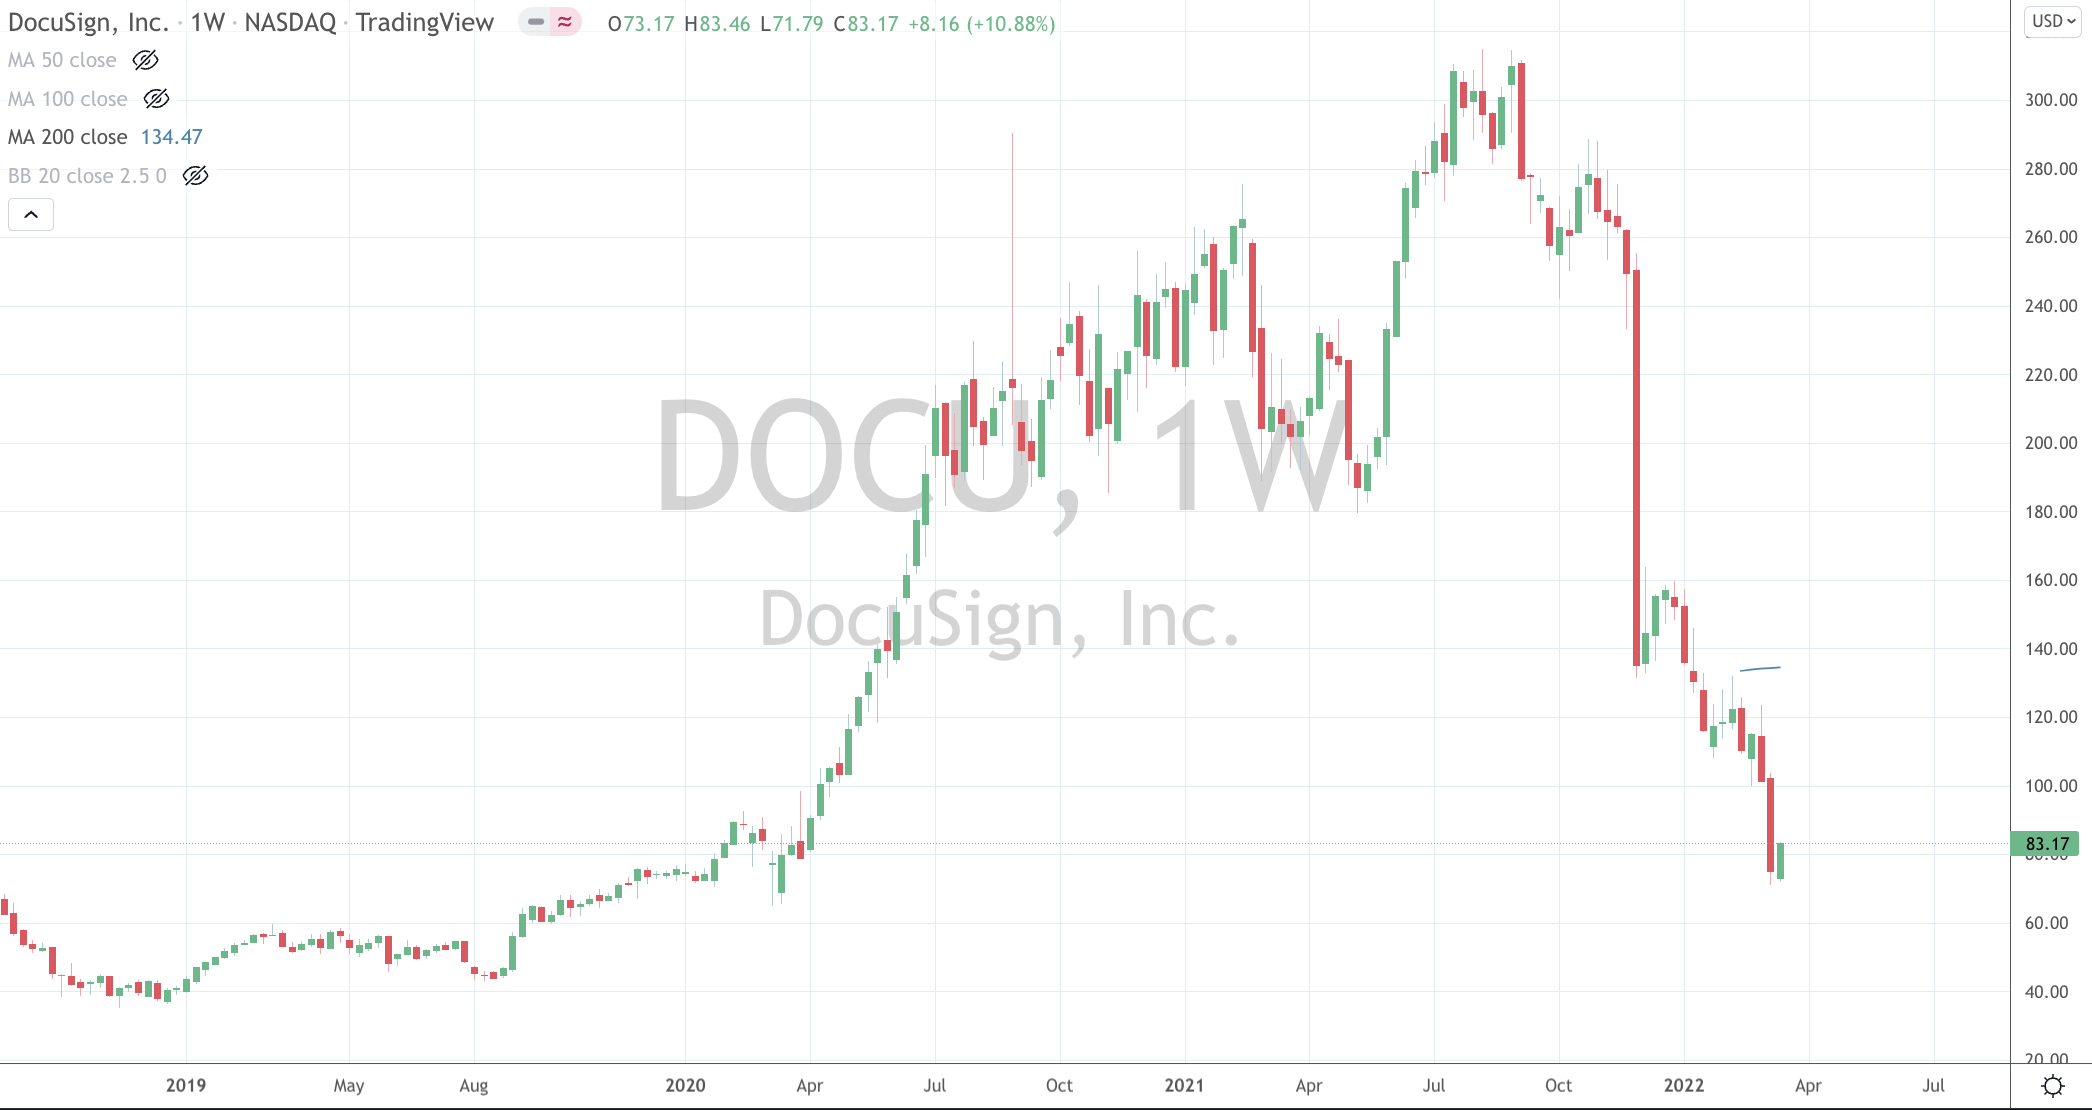
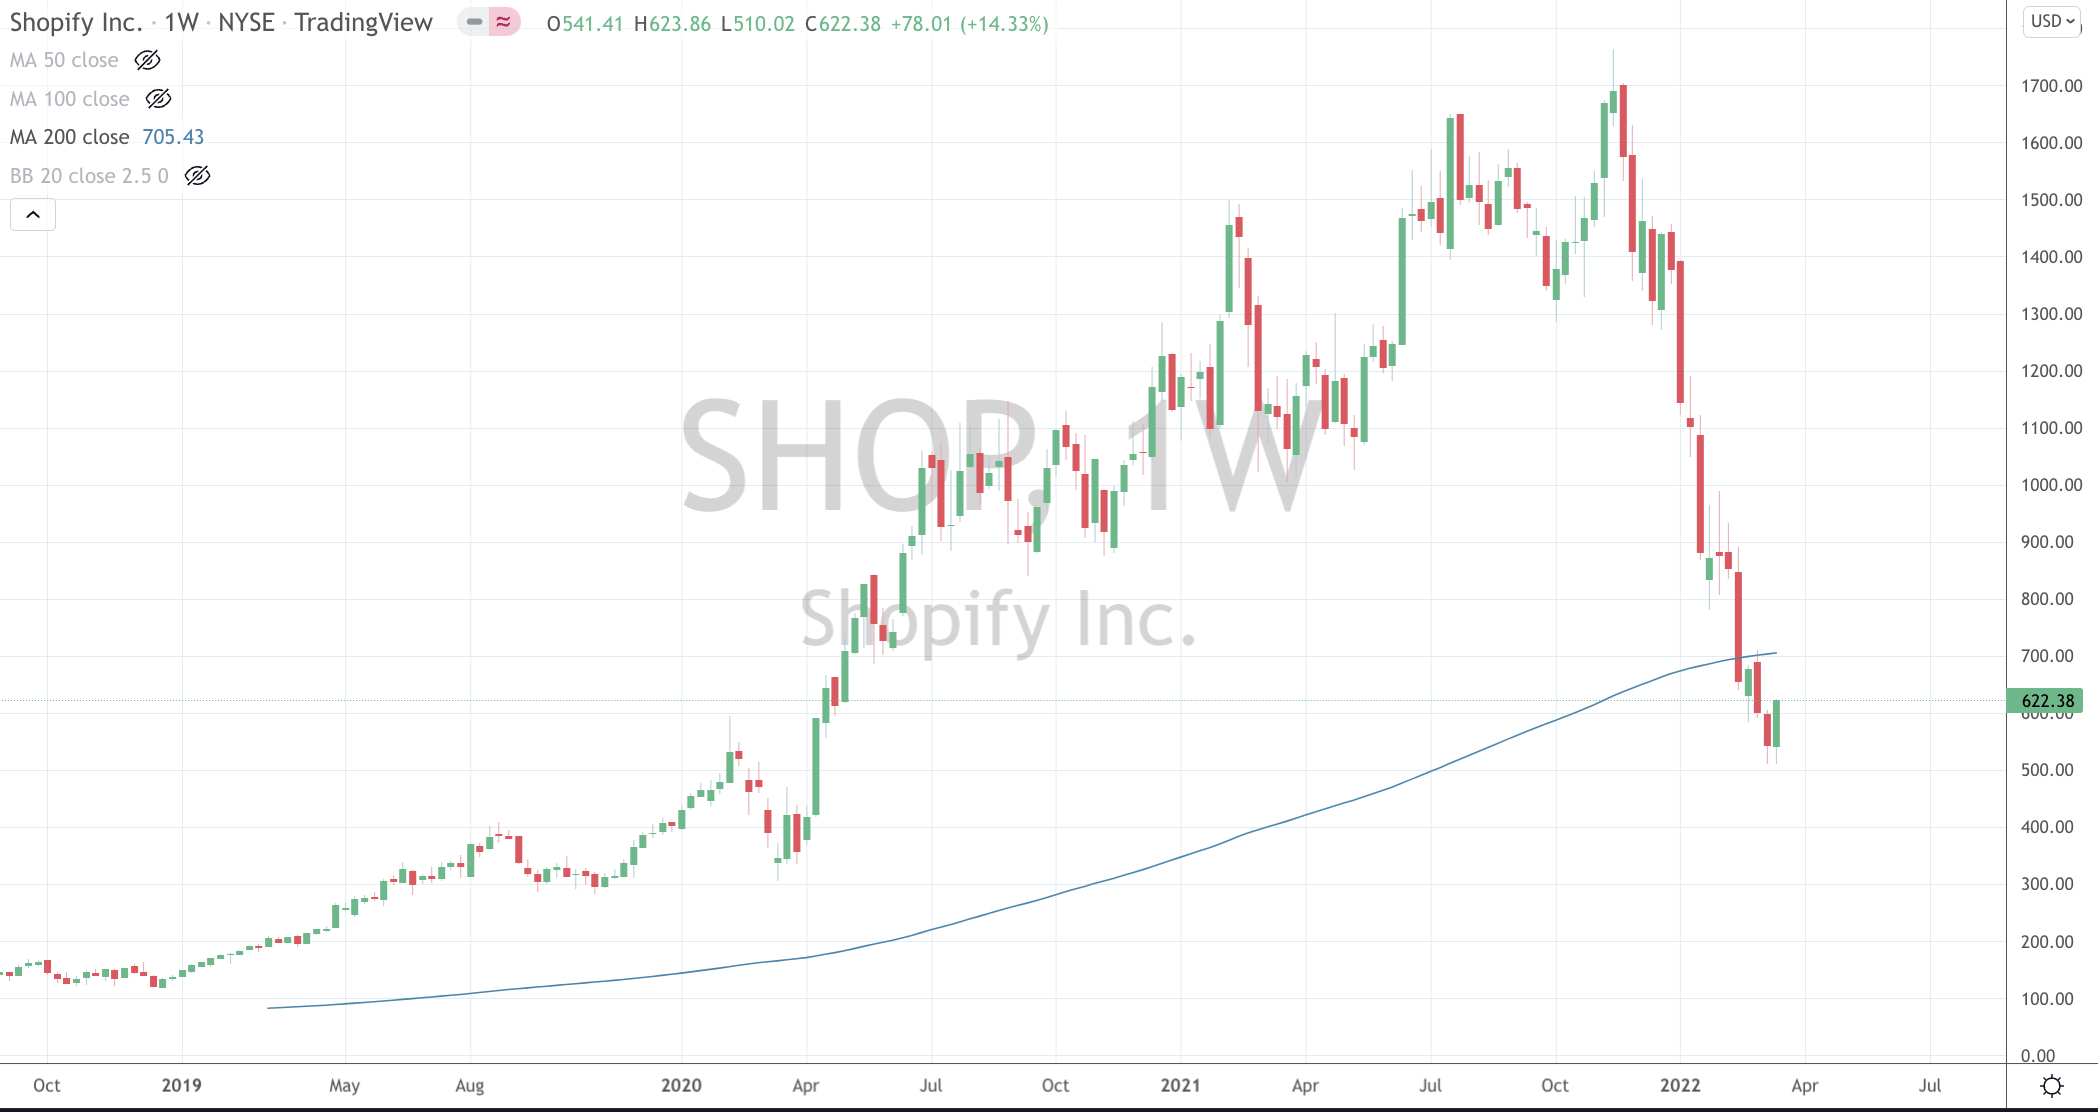
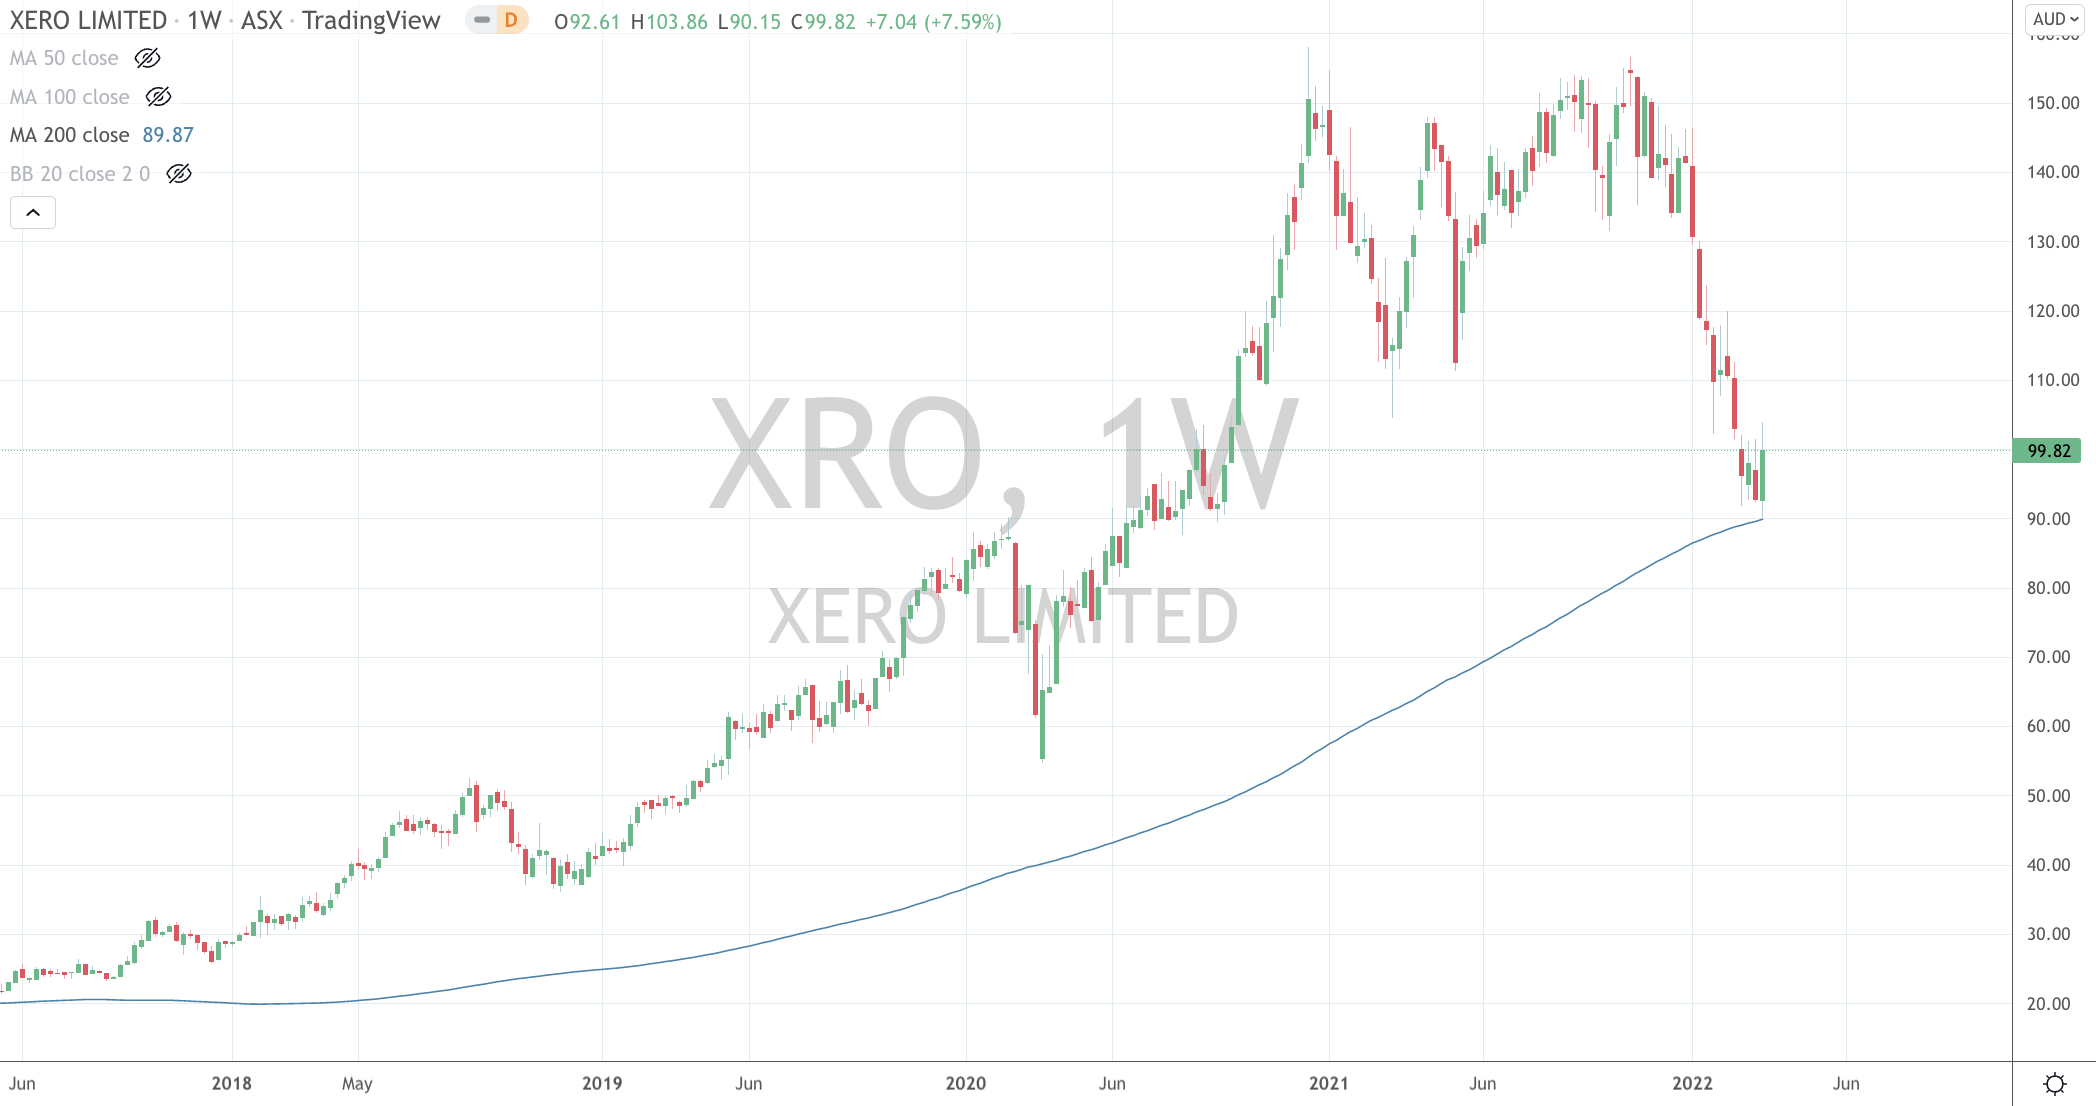
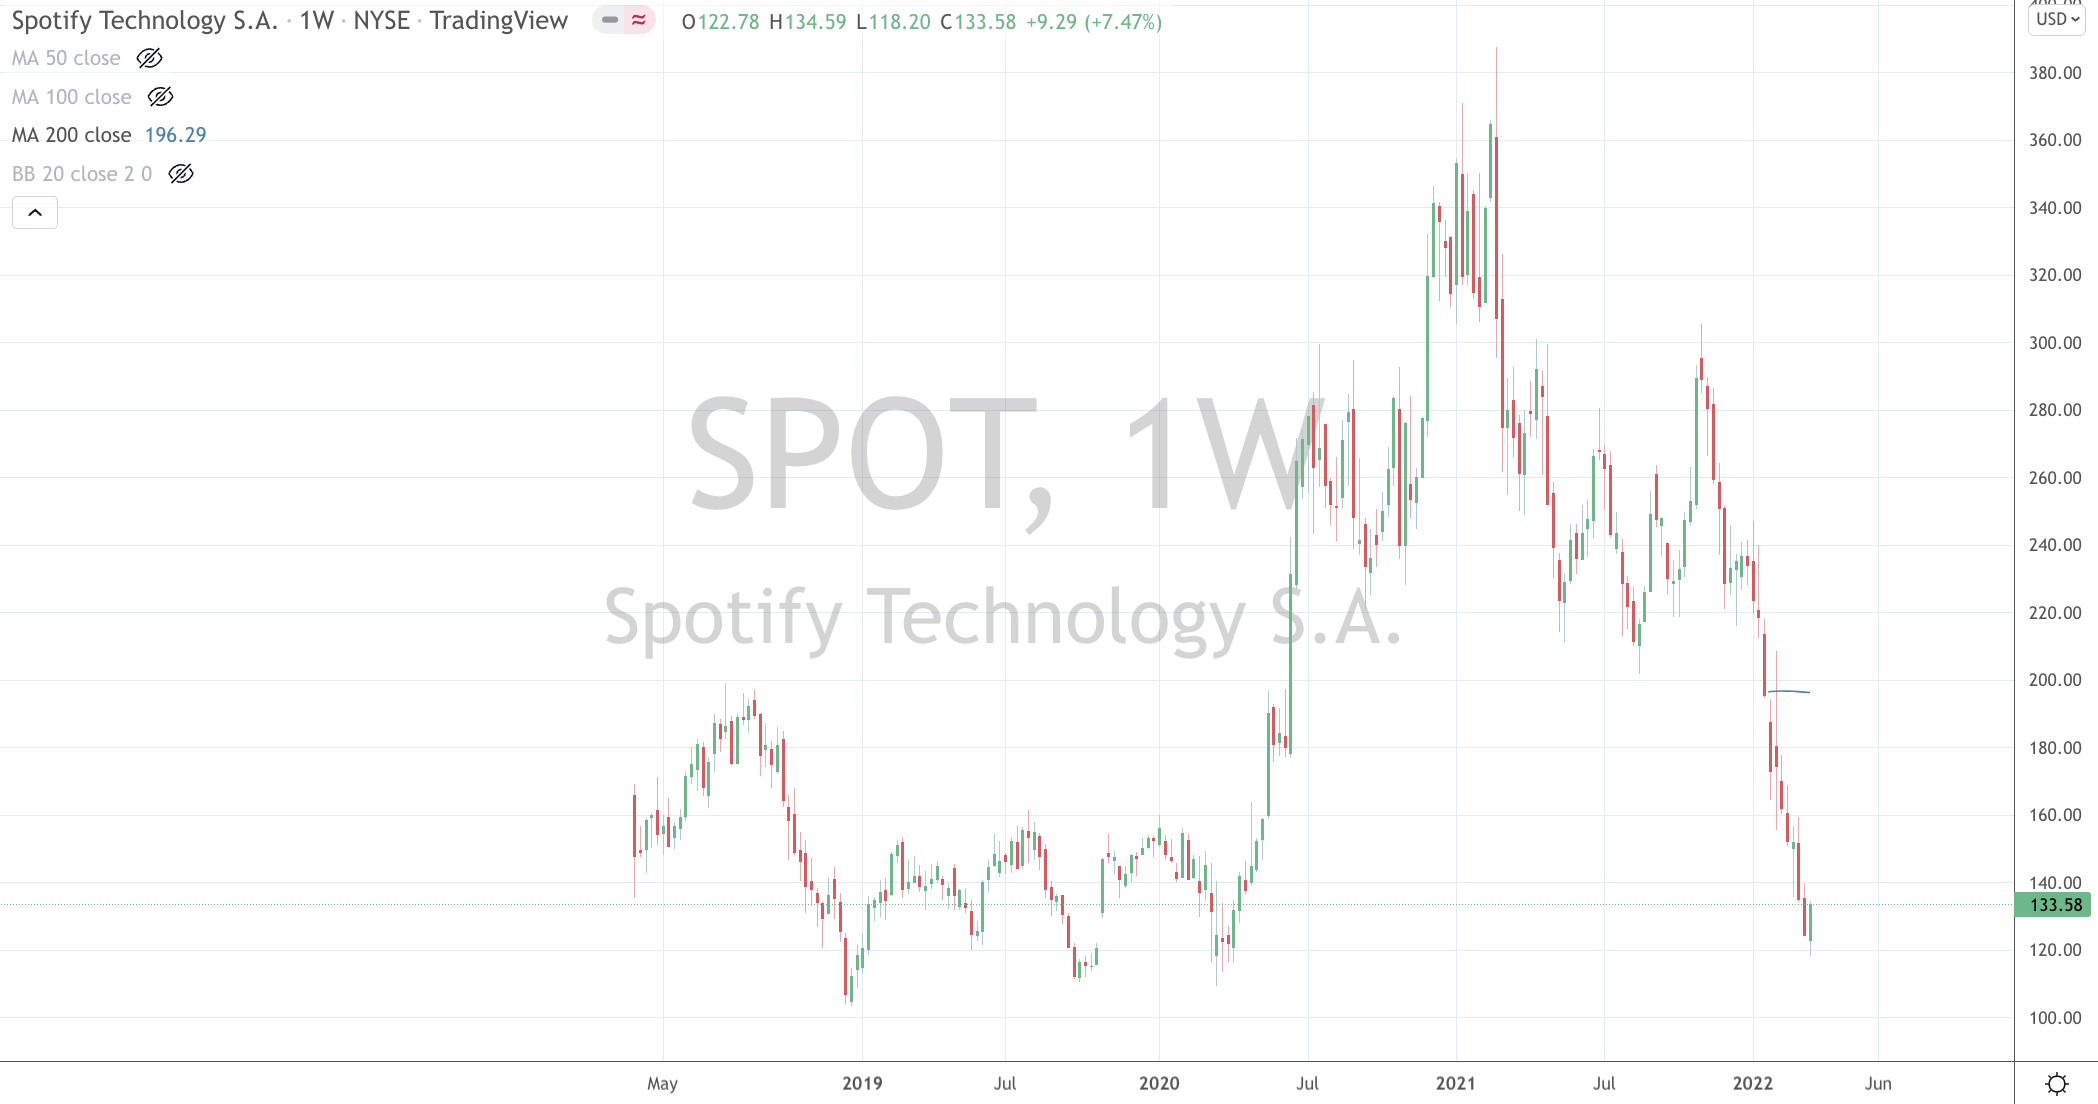
One of my ‘investing buckets’ and sectors of interest covers Cloud SaaS Software.
I think there are many stocks worthy of analysis.
My preference are the ‘giants’ with reasonable market share and ‘sticky customers’, which implies difficulty or bother should you choose to discontinue their service or product.
They may offer a free 14 or 30 day trial but not a ‘freemium’ product.
Thus Spotify, Zoom and Dropbox aren’t of interest,
while SAP, Docusign, SAP, Salesforce, Xero and Shopify are attracting my attention.
Charts below.
March 17, 2022 by Rob Zdravevski rob@karriasset.com.au
Isn’t it interesting who the willing buyers still are?
Natural resources and their prices find their own levels.
Commerciality does prevail, it’s the price which differs under particular circumstances.
Today, I hear that Russian oil is being sold at $30 below spot price.
For example, while the United States doesn’t buy any oil from Venezuela 🇻🇪 (who has nearly 20% of the world’s proven reserves), Venezuela does in fact sell Oil to many Asian nations including India, who buys approx. 120,000 barrels per day of Venezuela’s 500,000 daily exports.
China, India, South Korea and Japan buy plenty of Iran’s 2.3 million barrel daily export. It just may not be at the current $96 market price.