Macro Extremes (week ending April 14, 2023)
April 16, 2023 Leave a comment
A weekly Macro, Cross Asset review of prices trading at extremes which may generate future investment ideas and opportunities.
The following assets (on a weekly timeframe) registered an Overbought or Oversold reading and/or have traded more than 2.5 standard deviations above or below its rolling mean.
Extremes “above” the Mean (at least 2.5 standard deviations)
Coffee
Copenhagen
BRL/USD
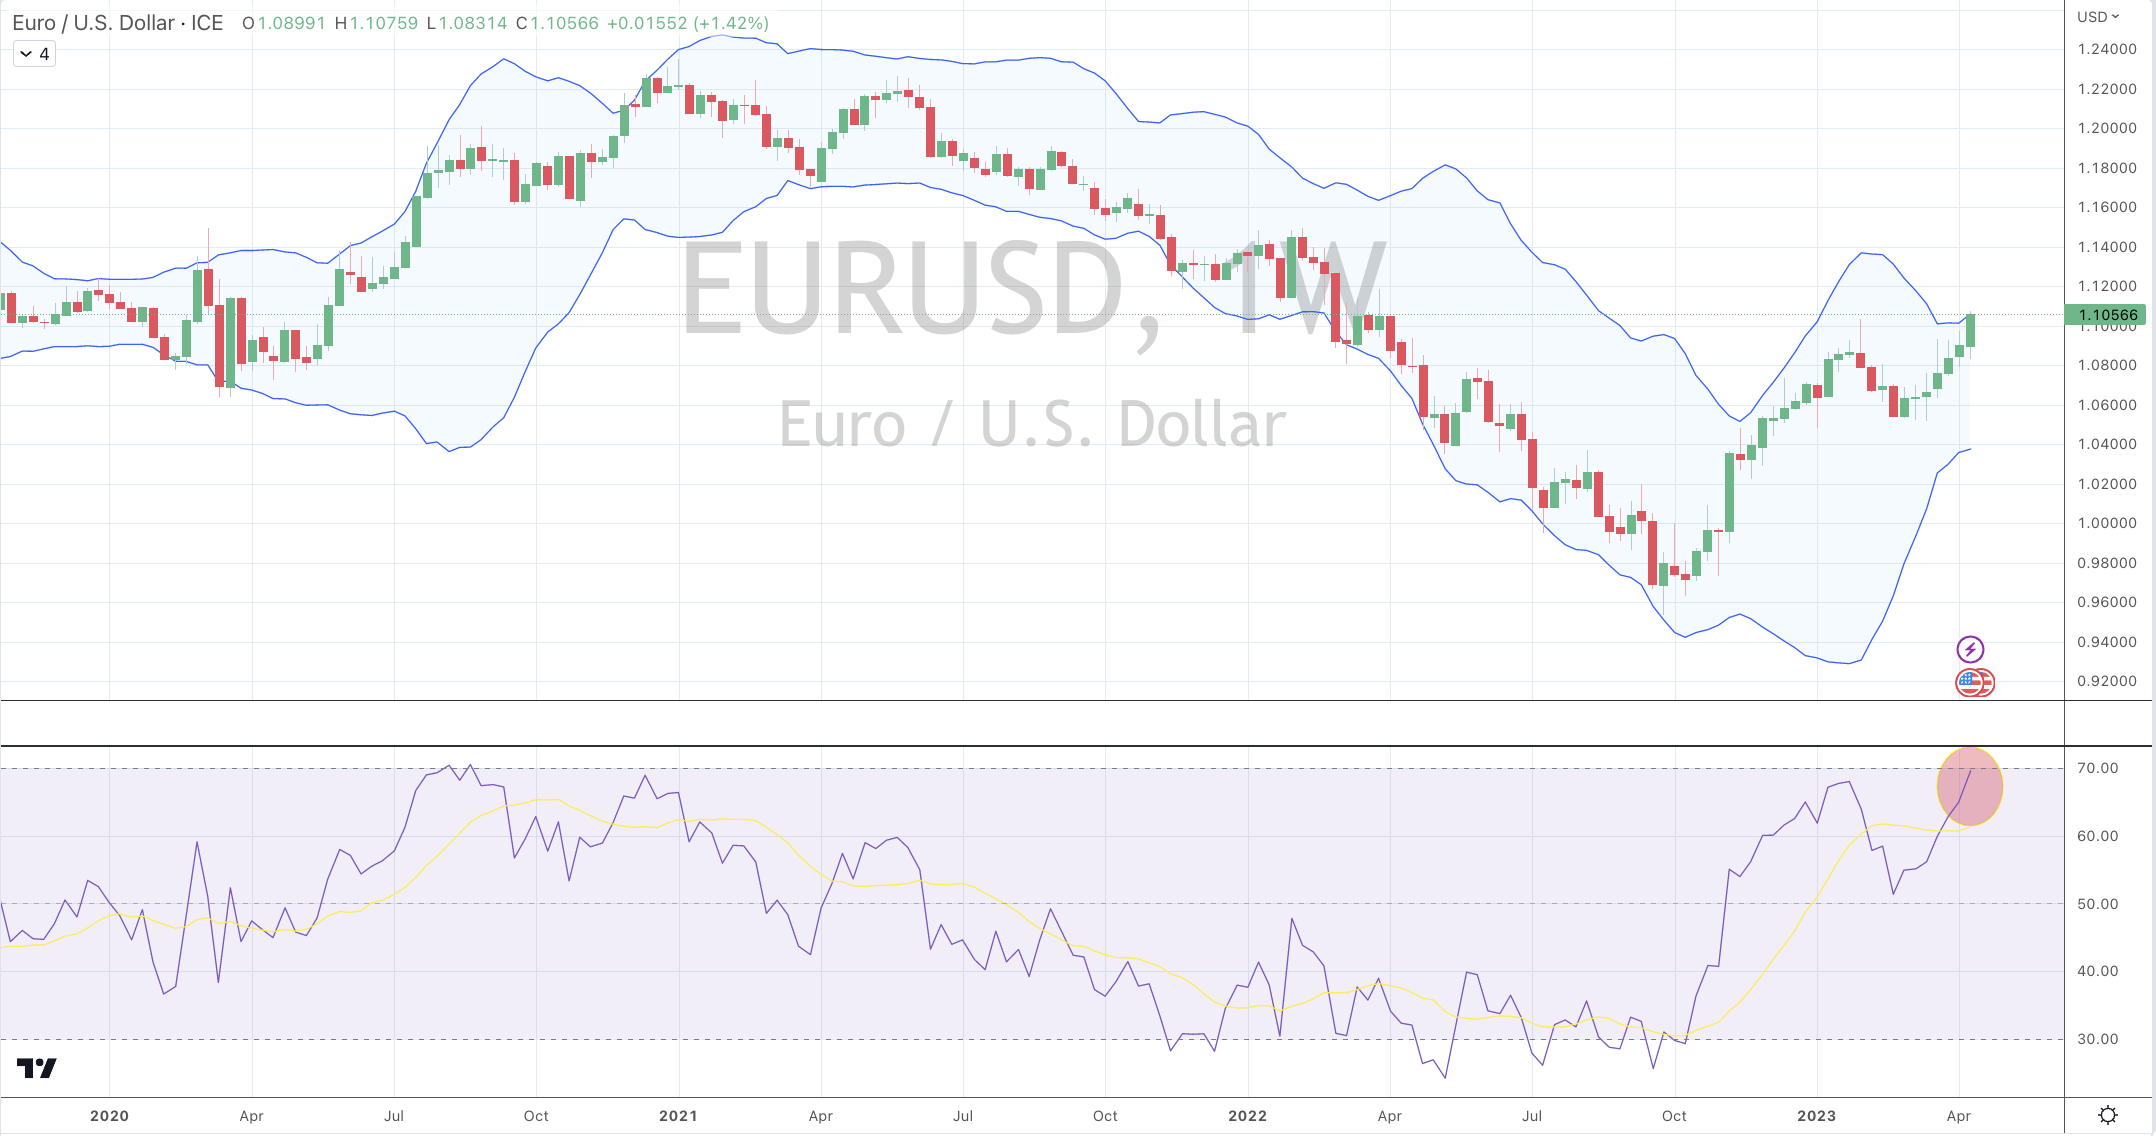
EUR/USD
FXE
GBP/USD
DKK/USD
Overbought (RSI > 70)
Hot Rolled Coil Steel (HRC)
Orange Juice
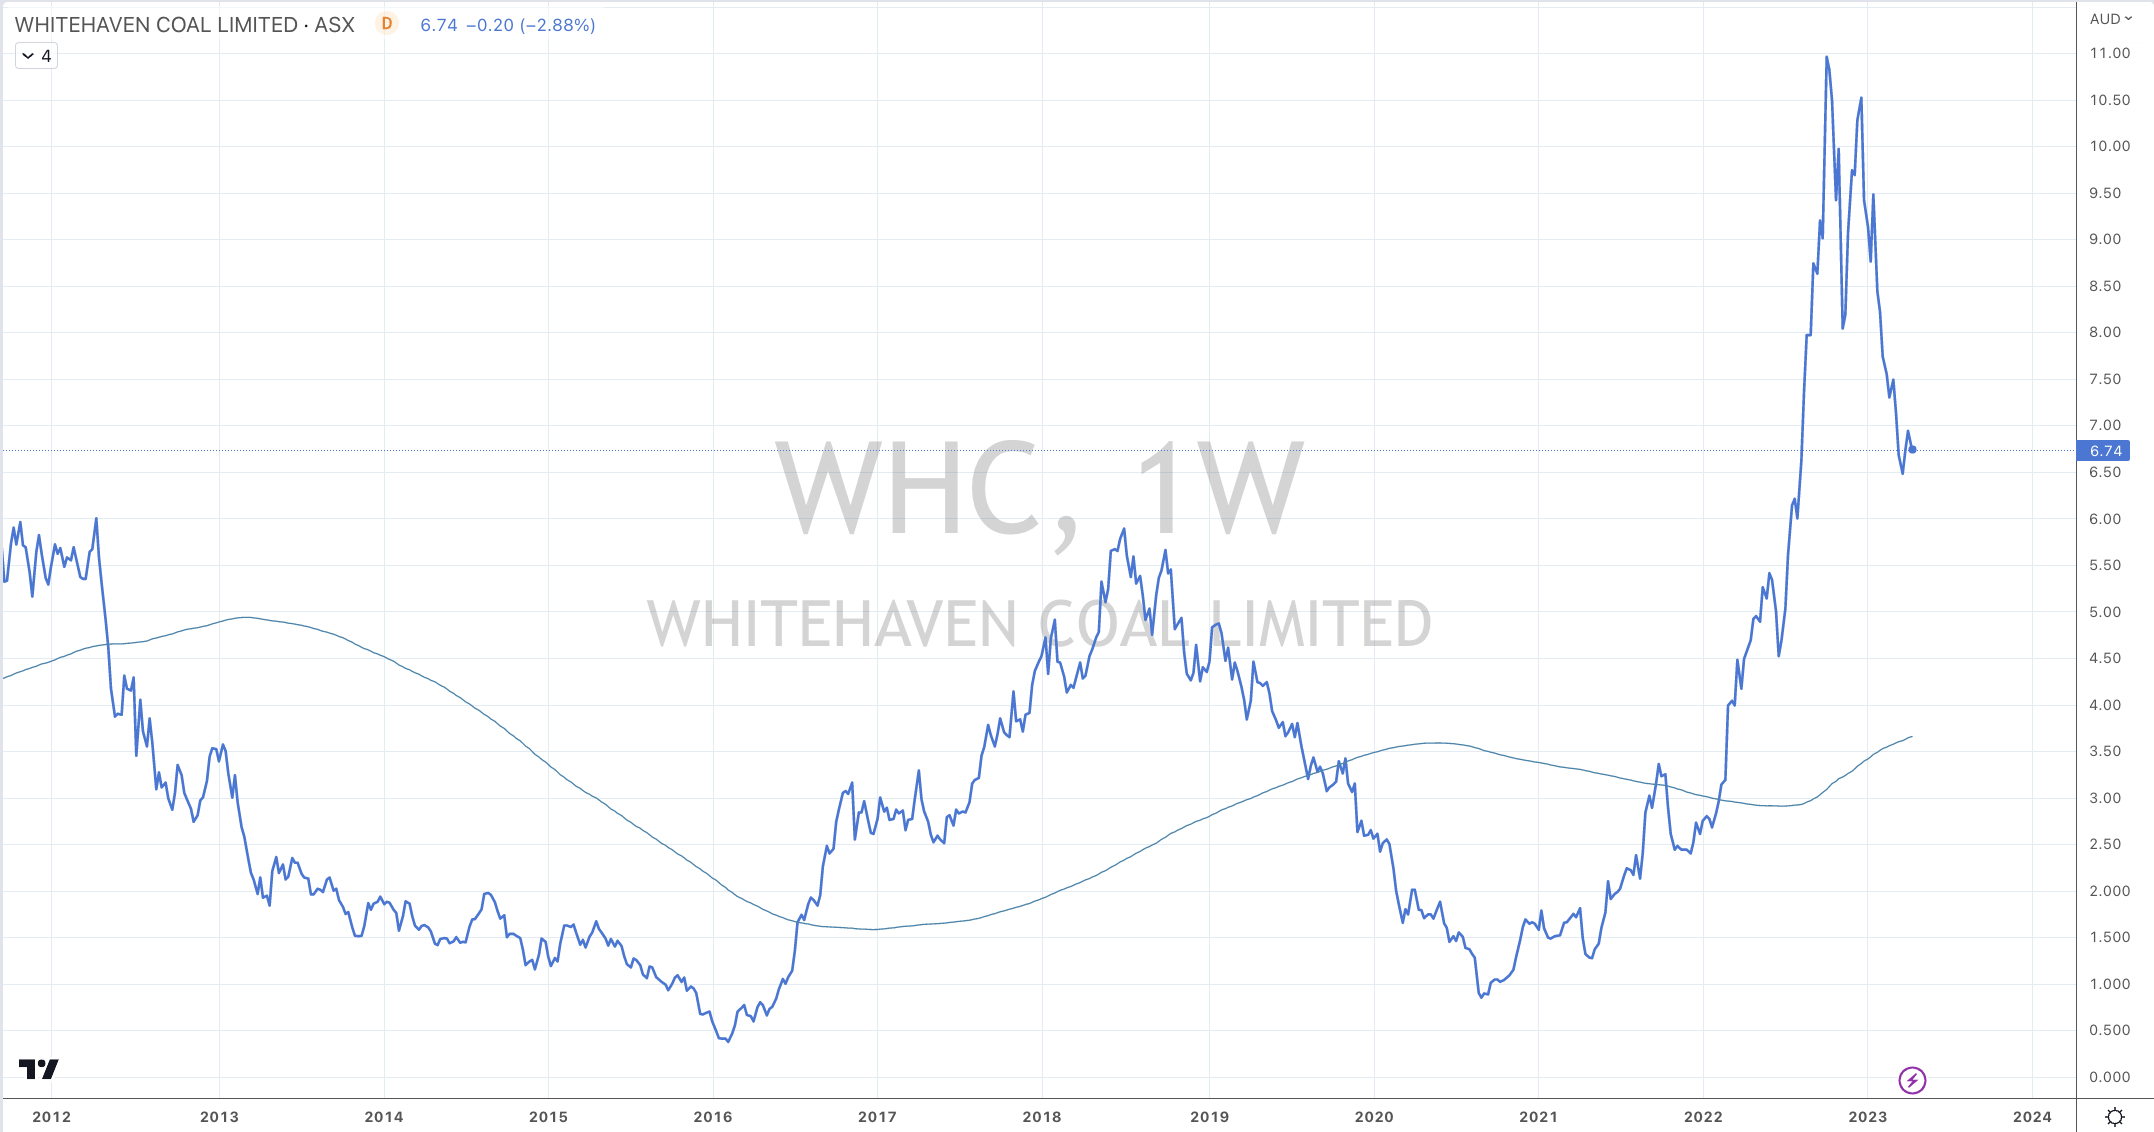
Gold (in AUD)
Silver (in AUD)
The Overbought Quinella – Both Overbought and Traded at > 2.5 standard deviations above the weekly mean)
Cattle
Sugar
Russia’s MOEX Index
Extremes “below” the Mean (at least 2.5 standard deviations)
U.S. Dollar Index (DXY)
Oversold (RSI < 30)
Urea (Middle East)
The Oversold Quinella – Both Overbought and Traded at > 2.5 standard deviations above the weekly mean)
U.S. 5 year bond yield minus U.S. 3 month bond yield
Lithium Hydroxide
Notes & Ideas:
Equities generally firmed around the world, with many seeing 4 consecutive weeks of positive returns, while not all are exhibiting strong trends.
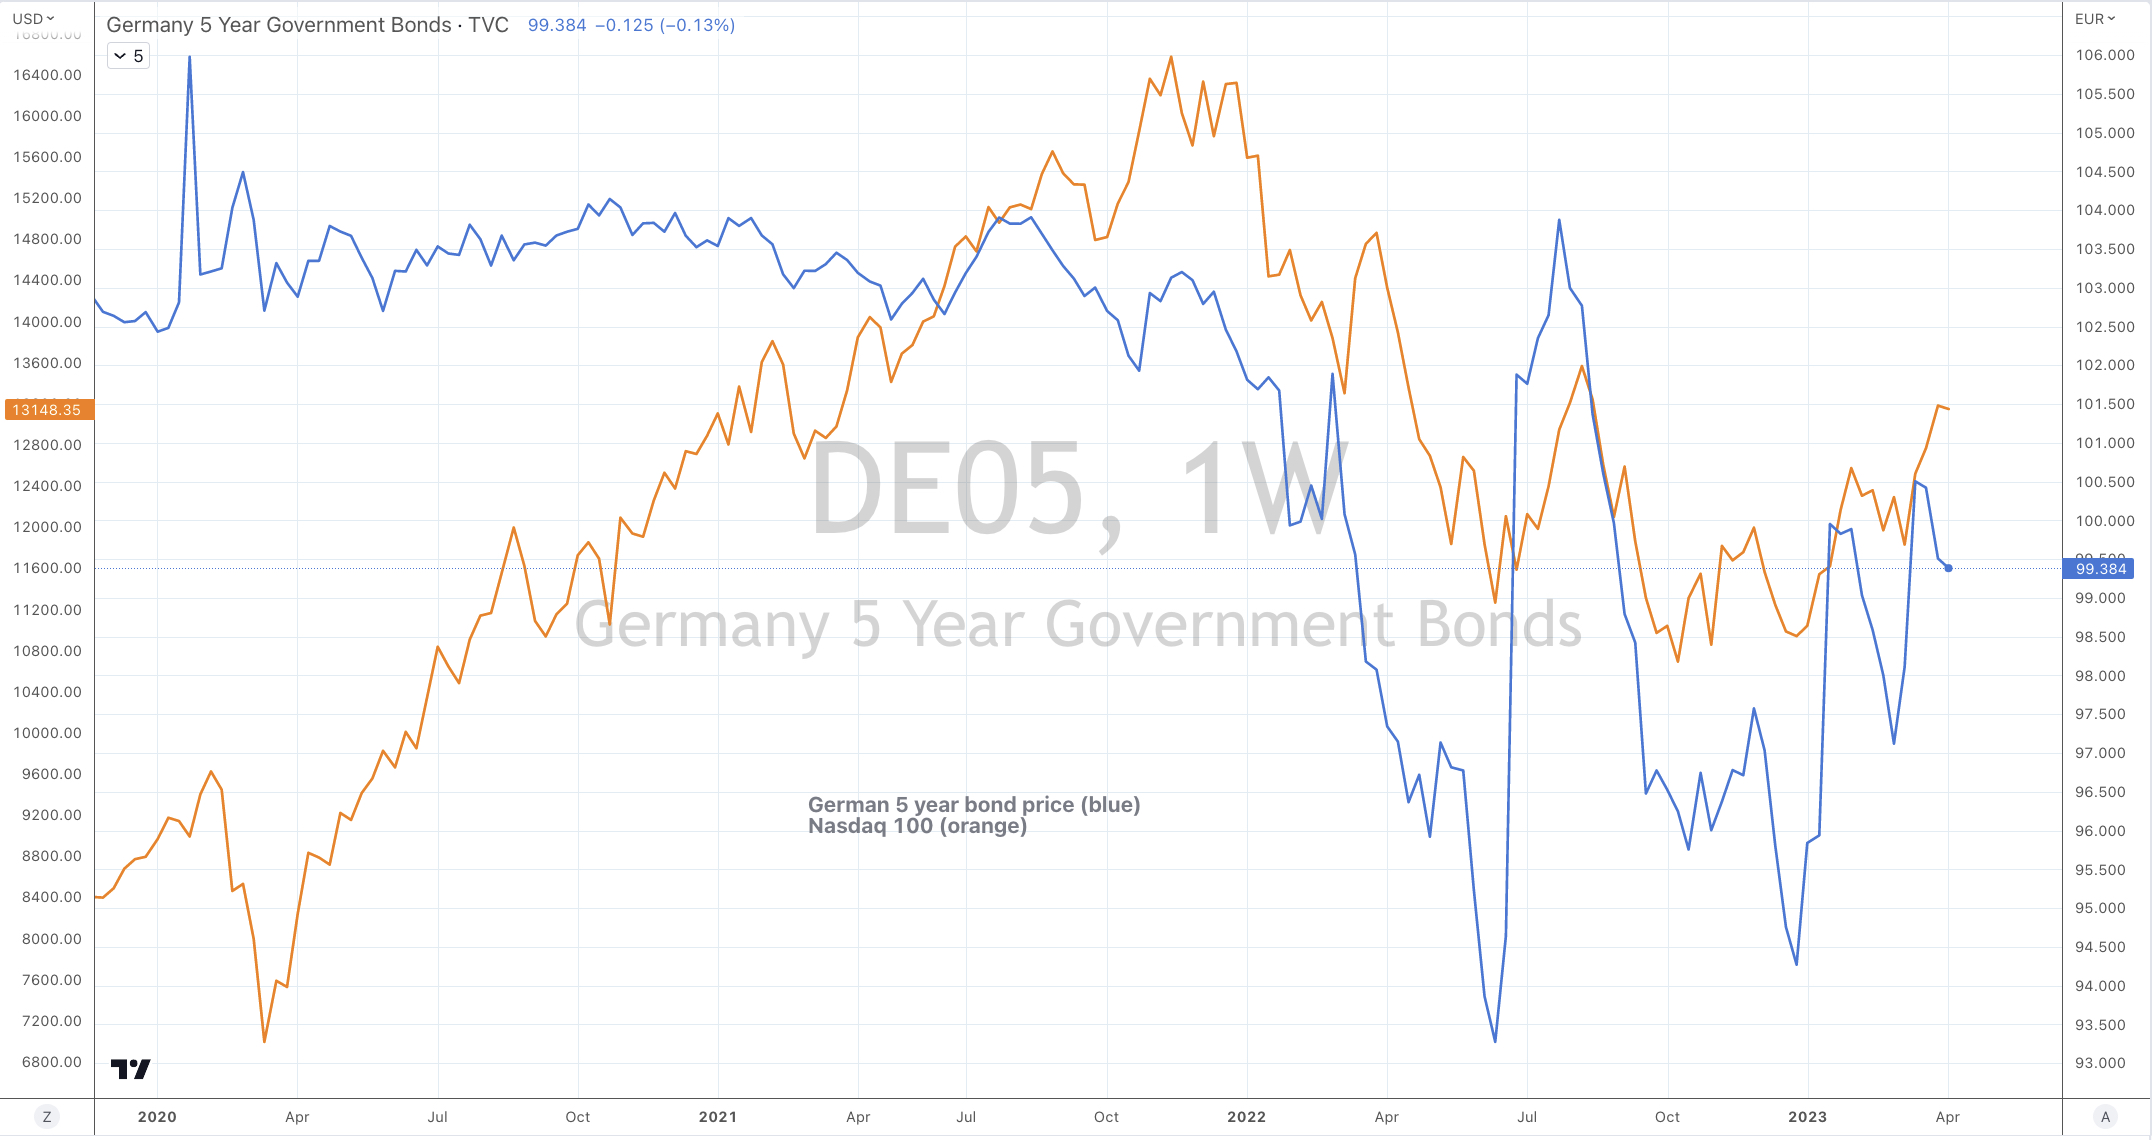
The Nasdaq 100 is the exception while the 8% advance in the Nasdaq Biotech market isn’t.
The Copenhagen equity market made a return to the Overbought ‘extremes’ and it was accompanied by a sympathetic overly-bought DKK (versus the USD).
And I’ll be watching if Switzerland’s SMI and the SPX 500 can make ‘higher highs’.
Amongst bonds, government bond yields rose and this has type of consolidation has been entirely expected following such newsworthy declines. I’ll watch closely if yields rise a little more so to temporarily hurt those late comers who have bet the opposite way.
Commodities generally continued their strength.
Over the past 4 weeks, Sugar has risen 15%, while WTI Crude has extended its run to 22% and Brent Crude has advanced 18% whileSilver priced in AUD has soared 20% in the past 5 weeks.
Some currencies are beginning to touch some extremes again.
With weakness seen in the U.S. Dollar, as evidenced in the DXY Index trading at extreme in this week’s list, the Euro, British Pound and the Danish Krone are showing ‘extreme’ strength against the U.S. Dollar.
i.e. I am seller of some Euro and Pound Sterling and buying USD.
The larger advancers over the past week comprised of;
Aluminium 2.3%, WTI Crude 2.3%, Lean Hogs 8.5%, Copper 2.3%, Lumber 8.9%, Cattle 2.2%, Natural Gas 5.1%, Sugar 2.1%, Palladium 3.7%, Urea U.S. Gulf 8.3%, Brent Crude 2%, Urea Middle East 2.5%, Corn 3.5%, Rice 4.5%, KBW Baking Index 3.2%, CAC 2.7%, DJ Transports 2%, MIB 2.4%, Bovespa 5.4%, KOSPI 3.3%, S&P MidCap 400 1.7%, Nikkei 3.5%, Oslo 2.5%, Copenhagen 3.8%, Stockholm 3%, Russell 2000 1.5%, S&P SmallCap 600 1.2%, TSX 1.9%, FTSE 1.7%, MOEX 3.4%, Chile 2.7%, Mexico 1.8%, Australia’s Small Cap rose 2.8% and the ASX 200 climbed 2%
The group of decliners included;
Australian Coking Coal (2.3%), Baltic Dry Index (8%),Tin (8%) and Dutch TTF Gas fell 4.6% as it works its way towards on Oversold reading.
April 15, 2023
by Rob Zdravevski
rob@karriasset.com.au