A weekly Macro, Cross Asset review of prices trading at extremes which may generate future investment ideas and opportunities.
The following assets (on a weekly timeframe) either registered an Overbought or Oversold reading and/or have traded more than 2.5 standard deviations above or below its rolling mean.
Extremes “above” the Mean (at least 2.5 standard deviations)
Nasdaq Transports
USD/CNH
Overbought (RSI > 70)
Australia 2 year government bond yields
British 2, 3 & 5 year government bond yields
U.S. 3 month bill yields
Cocoa
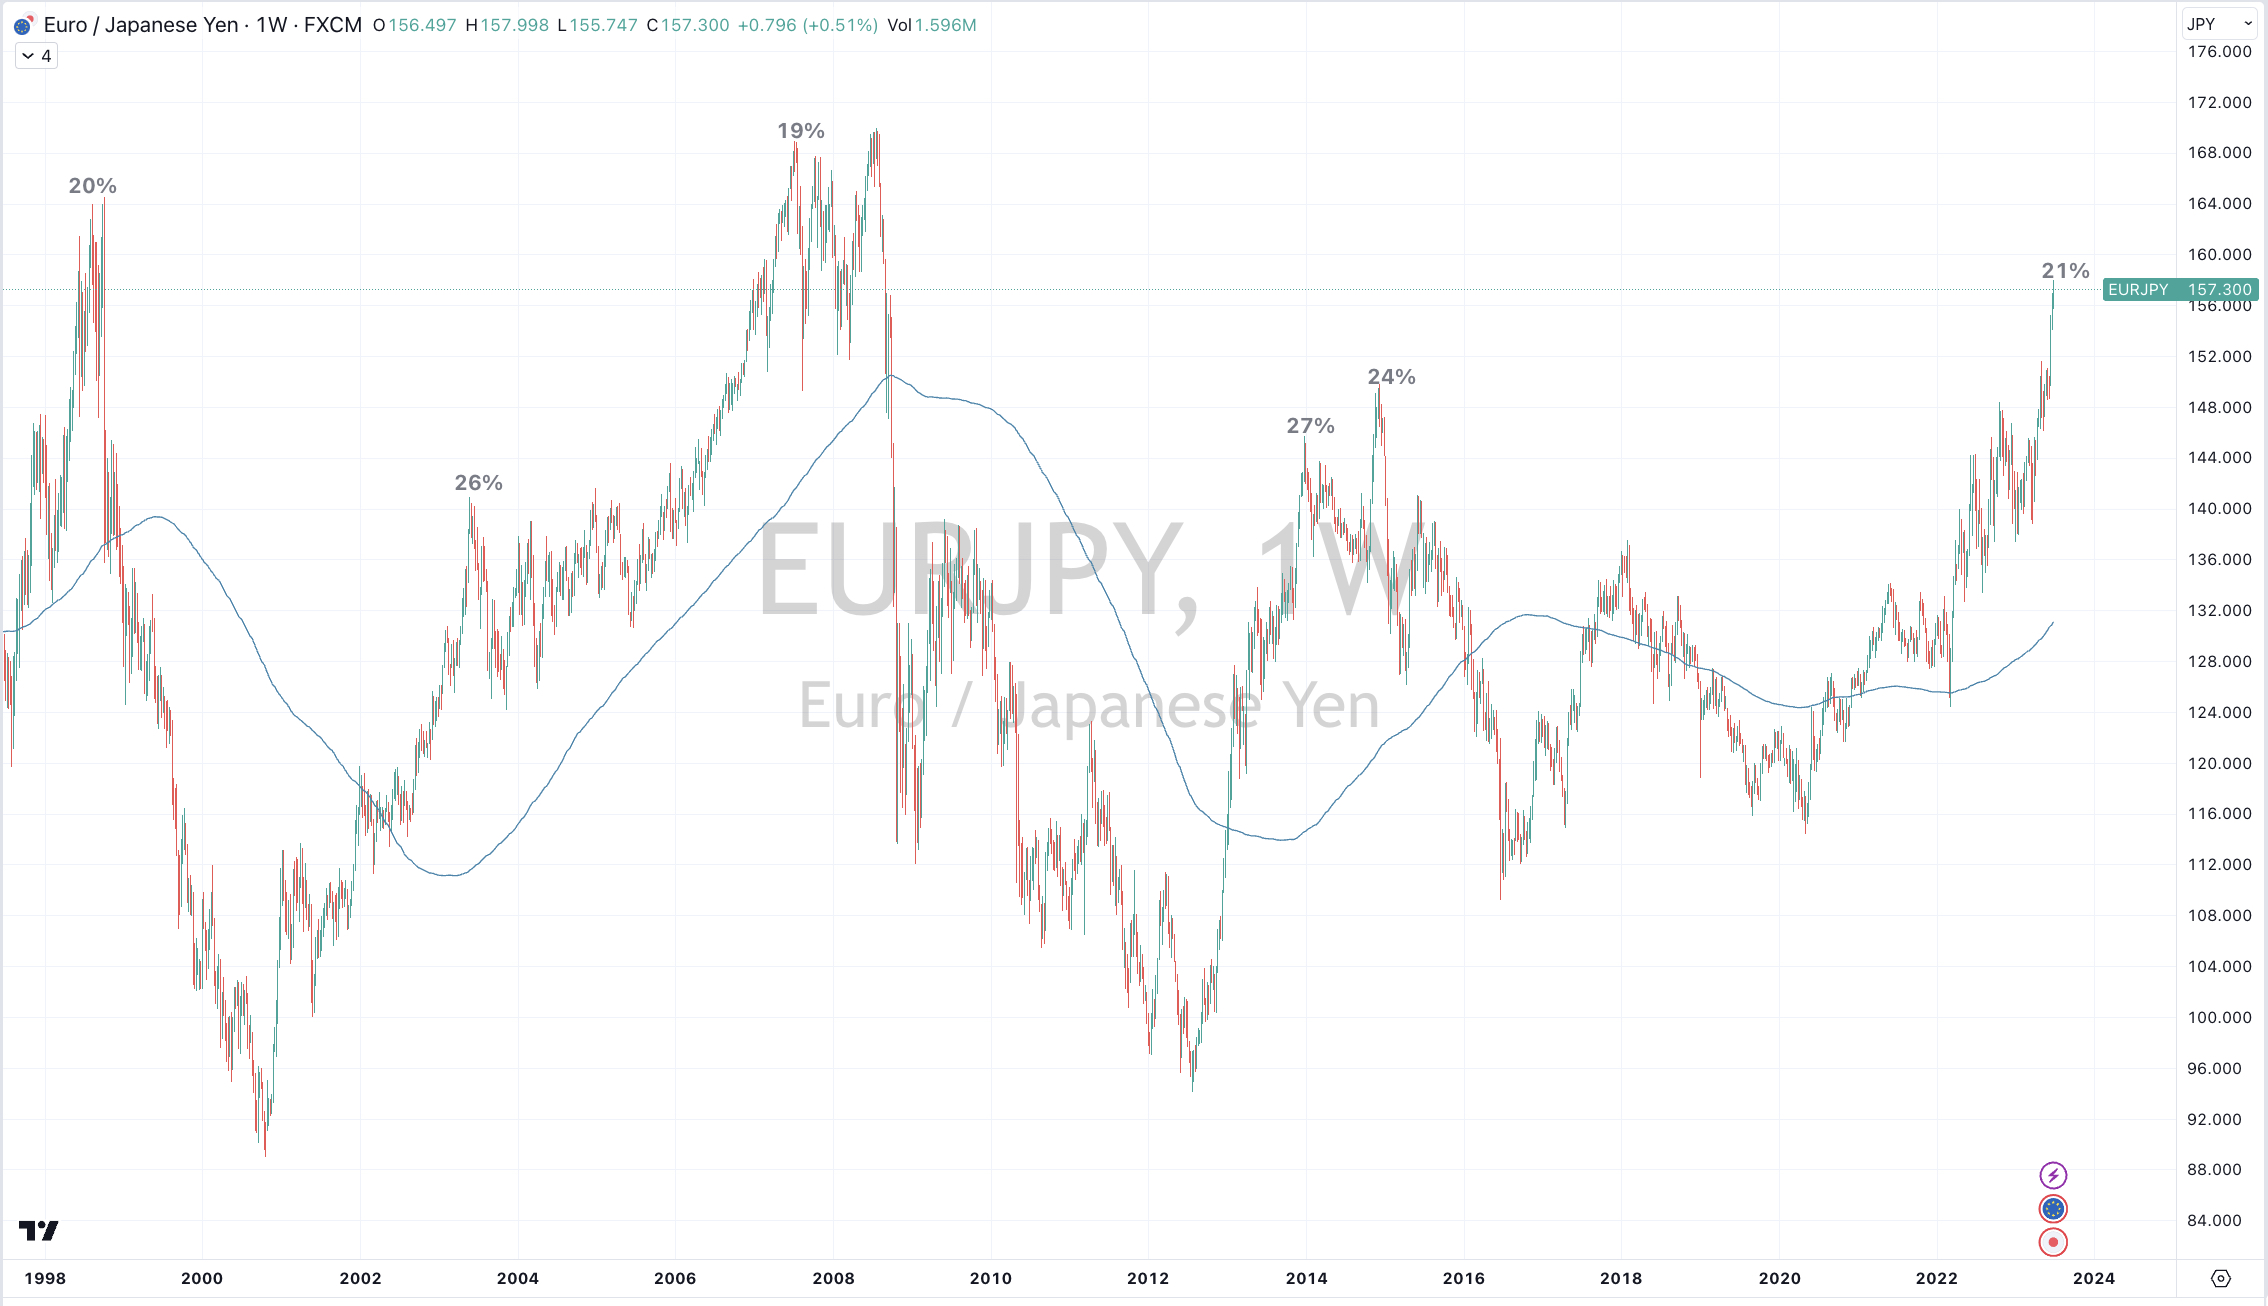
EUR/JPY
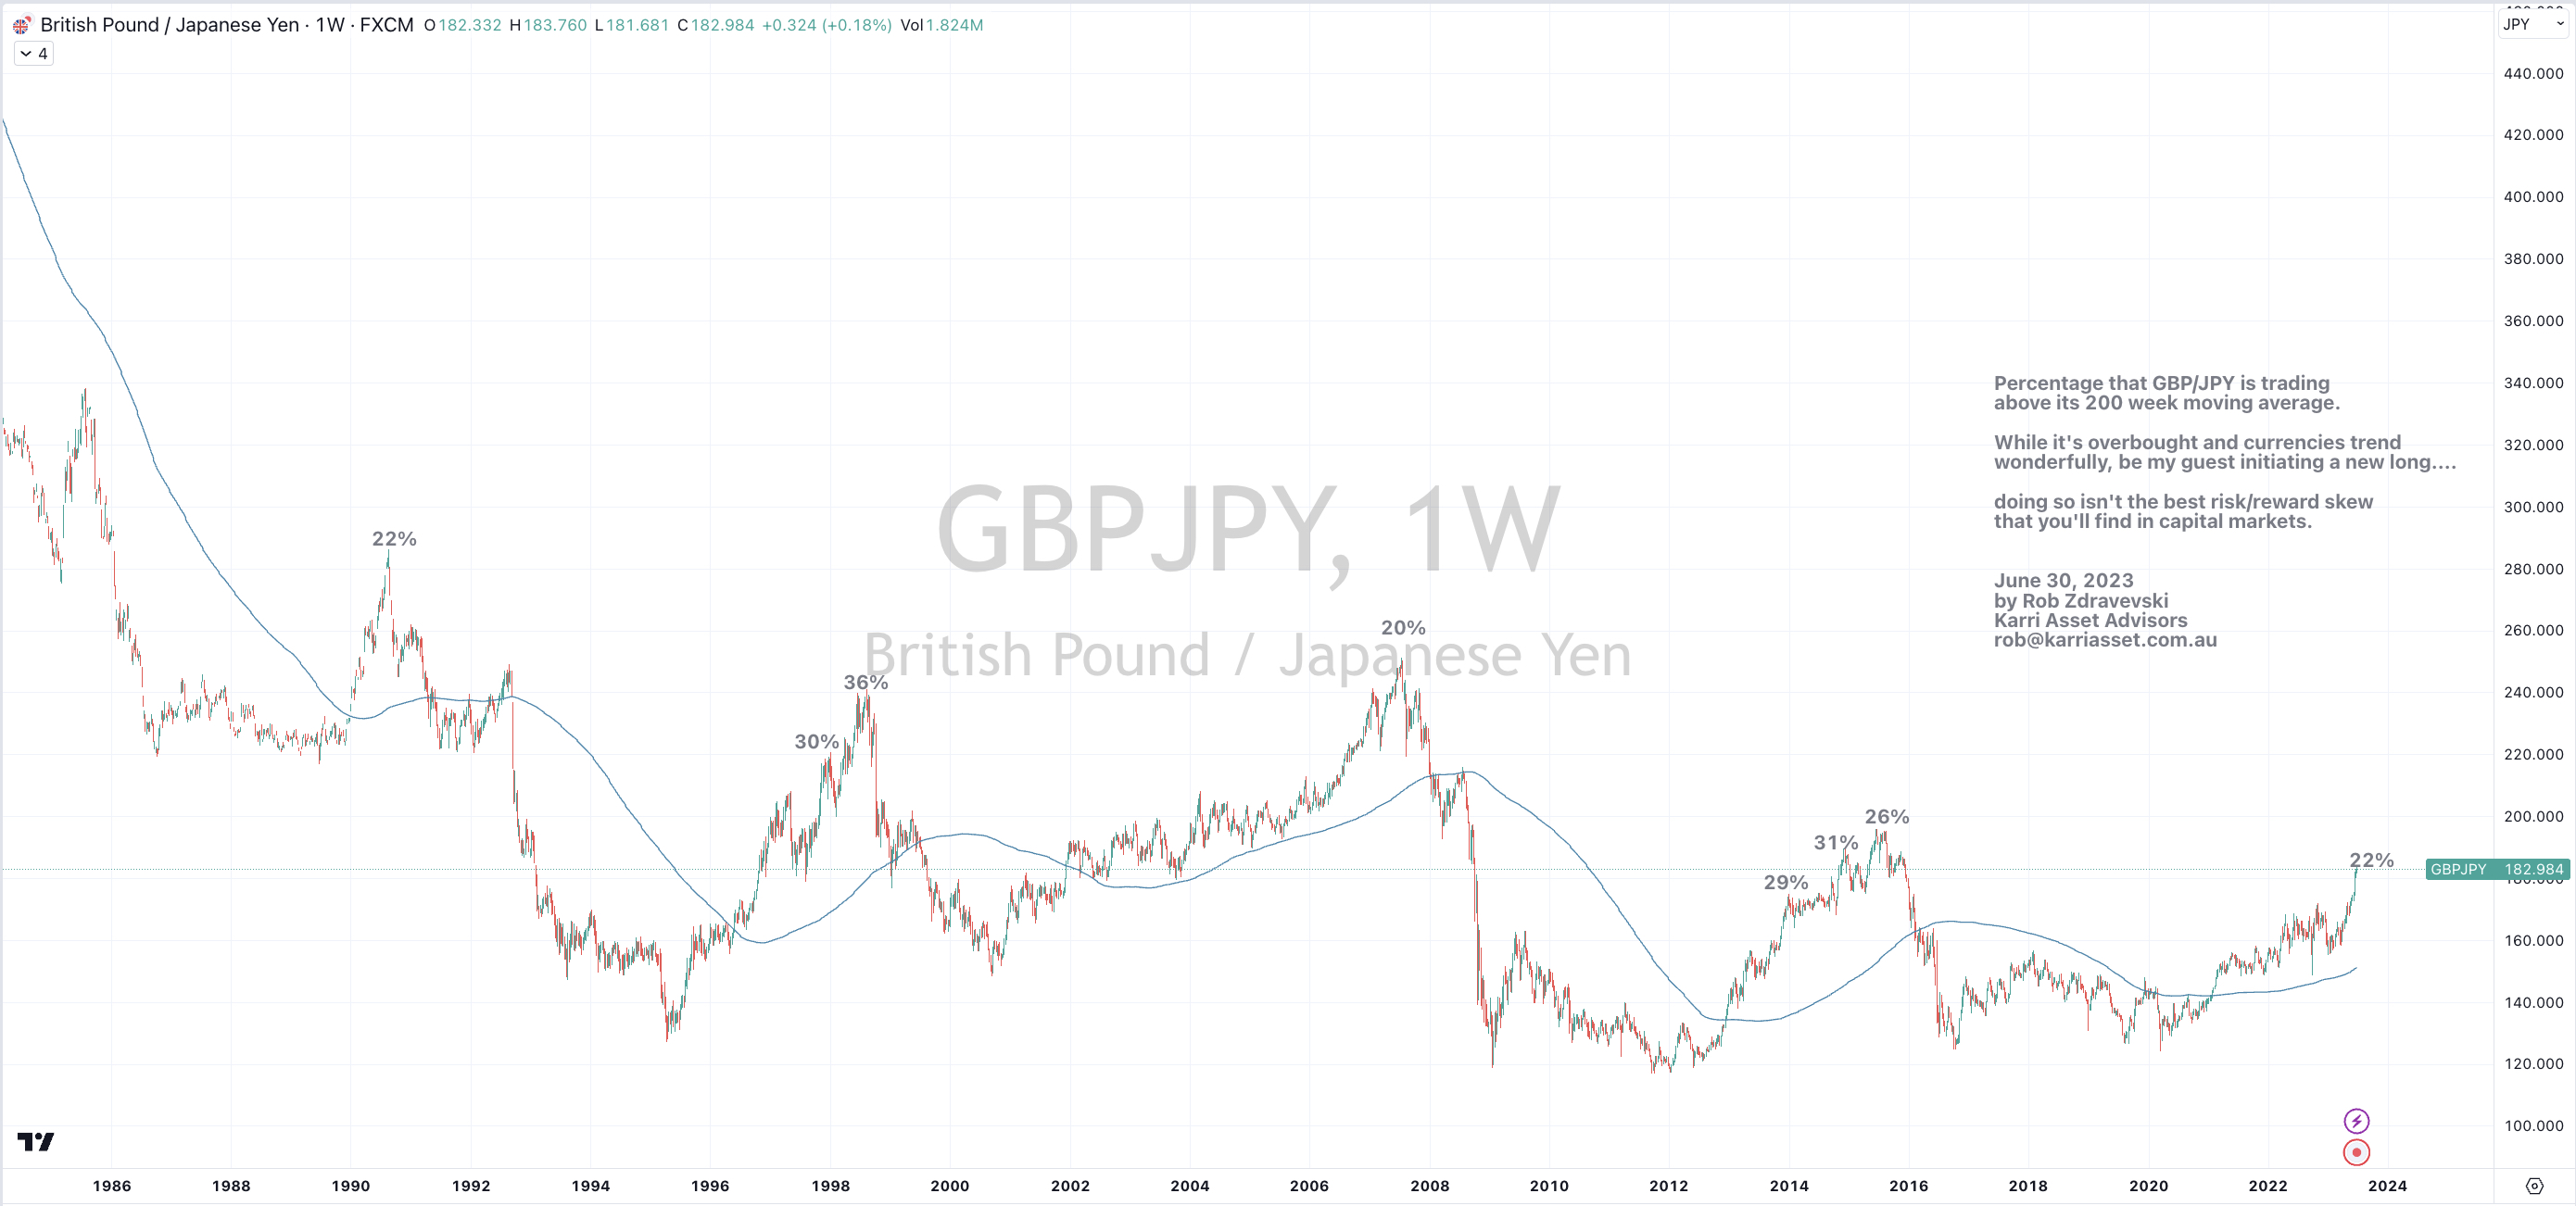
GBP/JPY
Nasdaq Composite
Nasdaq 100
Nikkei 225
And Russia’s MOEX equity index
The Overbought Quinella – Both Overbought and Traded at > 2.5 standard deviations above the weekly mean)
None
Extremes “below” the Mean (at least 2.5 standard deviations)
Aluminium
Coffee
Rice
THB/USD
Shanghai Composite
And Thailand’s SET Index
Oversold (RSI < 30)
Australian 10 year minus 2 year bond yield spread
Brazil 10 year government bond yields
CNH/USD
The Oversold Quinella – Both Oversold and Traded at < 2.5 standard deviations below the weekly mean)
None
Notes & Ideas:
After taking a break last week, Equities were mainly higher around the world.
The Nasdaq Composite joined the Nasdaq 100 in overbought territory.
European bourses performed well along with American transports along the small and mid caps.
In last week’s commentary, I wrote that Japan’s Nikkei 225 ended its 10 consecutive week of gains. It still remains overbought.
While we saw some consecutive weekly rising streaks come to an end over the past 2 weeks, their upward trends aren’t broken.
The S&P 500 and the SOX are attempting a new march towards overbought territory.
Australia’s (XSO) Small Cap index rose 1.9% which disproved last week’s note about the bearish outside reversal week it posted. However, it is worthy to watch as it’s one of the few indices which is in a downward trend.
Speaking of outside reversal week’s, the following indices performed bullish one’s; France’s CAC 40, the Dow Jones Industrials, Spain’s IBEX, the Nasdaq Composite, the S&P 500 and Chile’s IGPA and IPSA indices.
Most Government bond yields rose
Australian 2 & 3 year bond yields closed at their highest point since July 2011.
The U.S. 2’s saw their highest closing yield since June 2007 but it’s intra-week high is yet to breach the ‘higher high’ of 5.09%, seen in early March of 2023.
While the U.K. 2’s and 3’s continue to barrel higher and make ’ higher highs. They are now at their highest yields since June 2008.
U.S. 10 year yield minus U.S. 2 year yield spread is approaching oversold territory, which means something.
The U.S. 3 month bill yield made a return to overbought territory.
The U.S. 10 year minus U.S. 5 year yield spread registered its 8th consecutive ‘losing’ week.
Commodities were mixed with a slight bias towards weakness.
Energy prices generally rose and prevented the commodity indices from posting a larger losing week than they did.
Lean Hogs and Oats aren’t overbought this week.
Inversely, Lithium Hydroxide and Urea have left oversold territory. Both jumped 11% for the week.
The former has soared 29% over the past 8 weeks.
U.S. Midwest Hot Rolled Coil Steel is into a 5 week losing streak.
Corn and Wheat had a shocker of a week.
Tin and Nickel are stealthy falling.
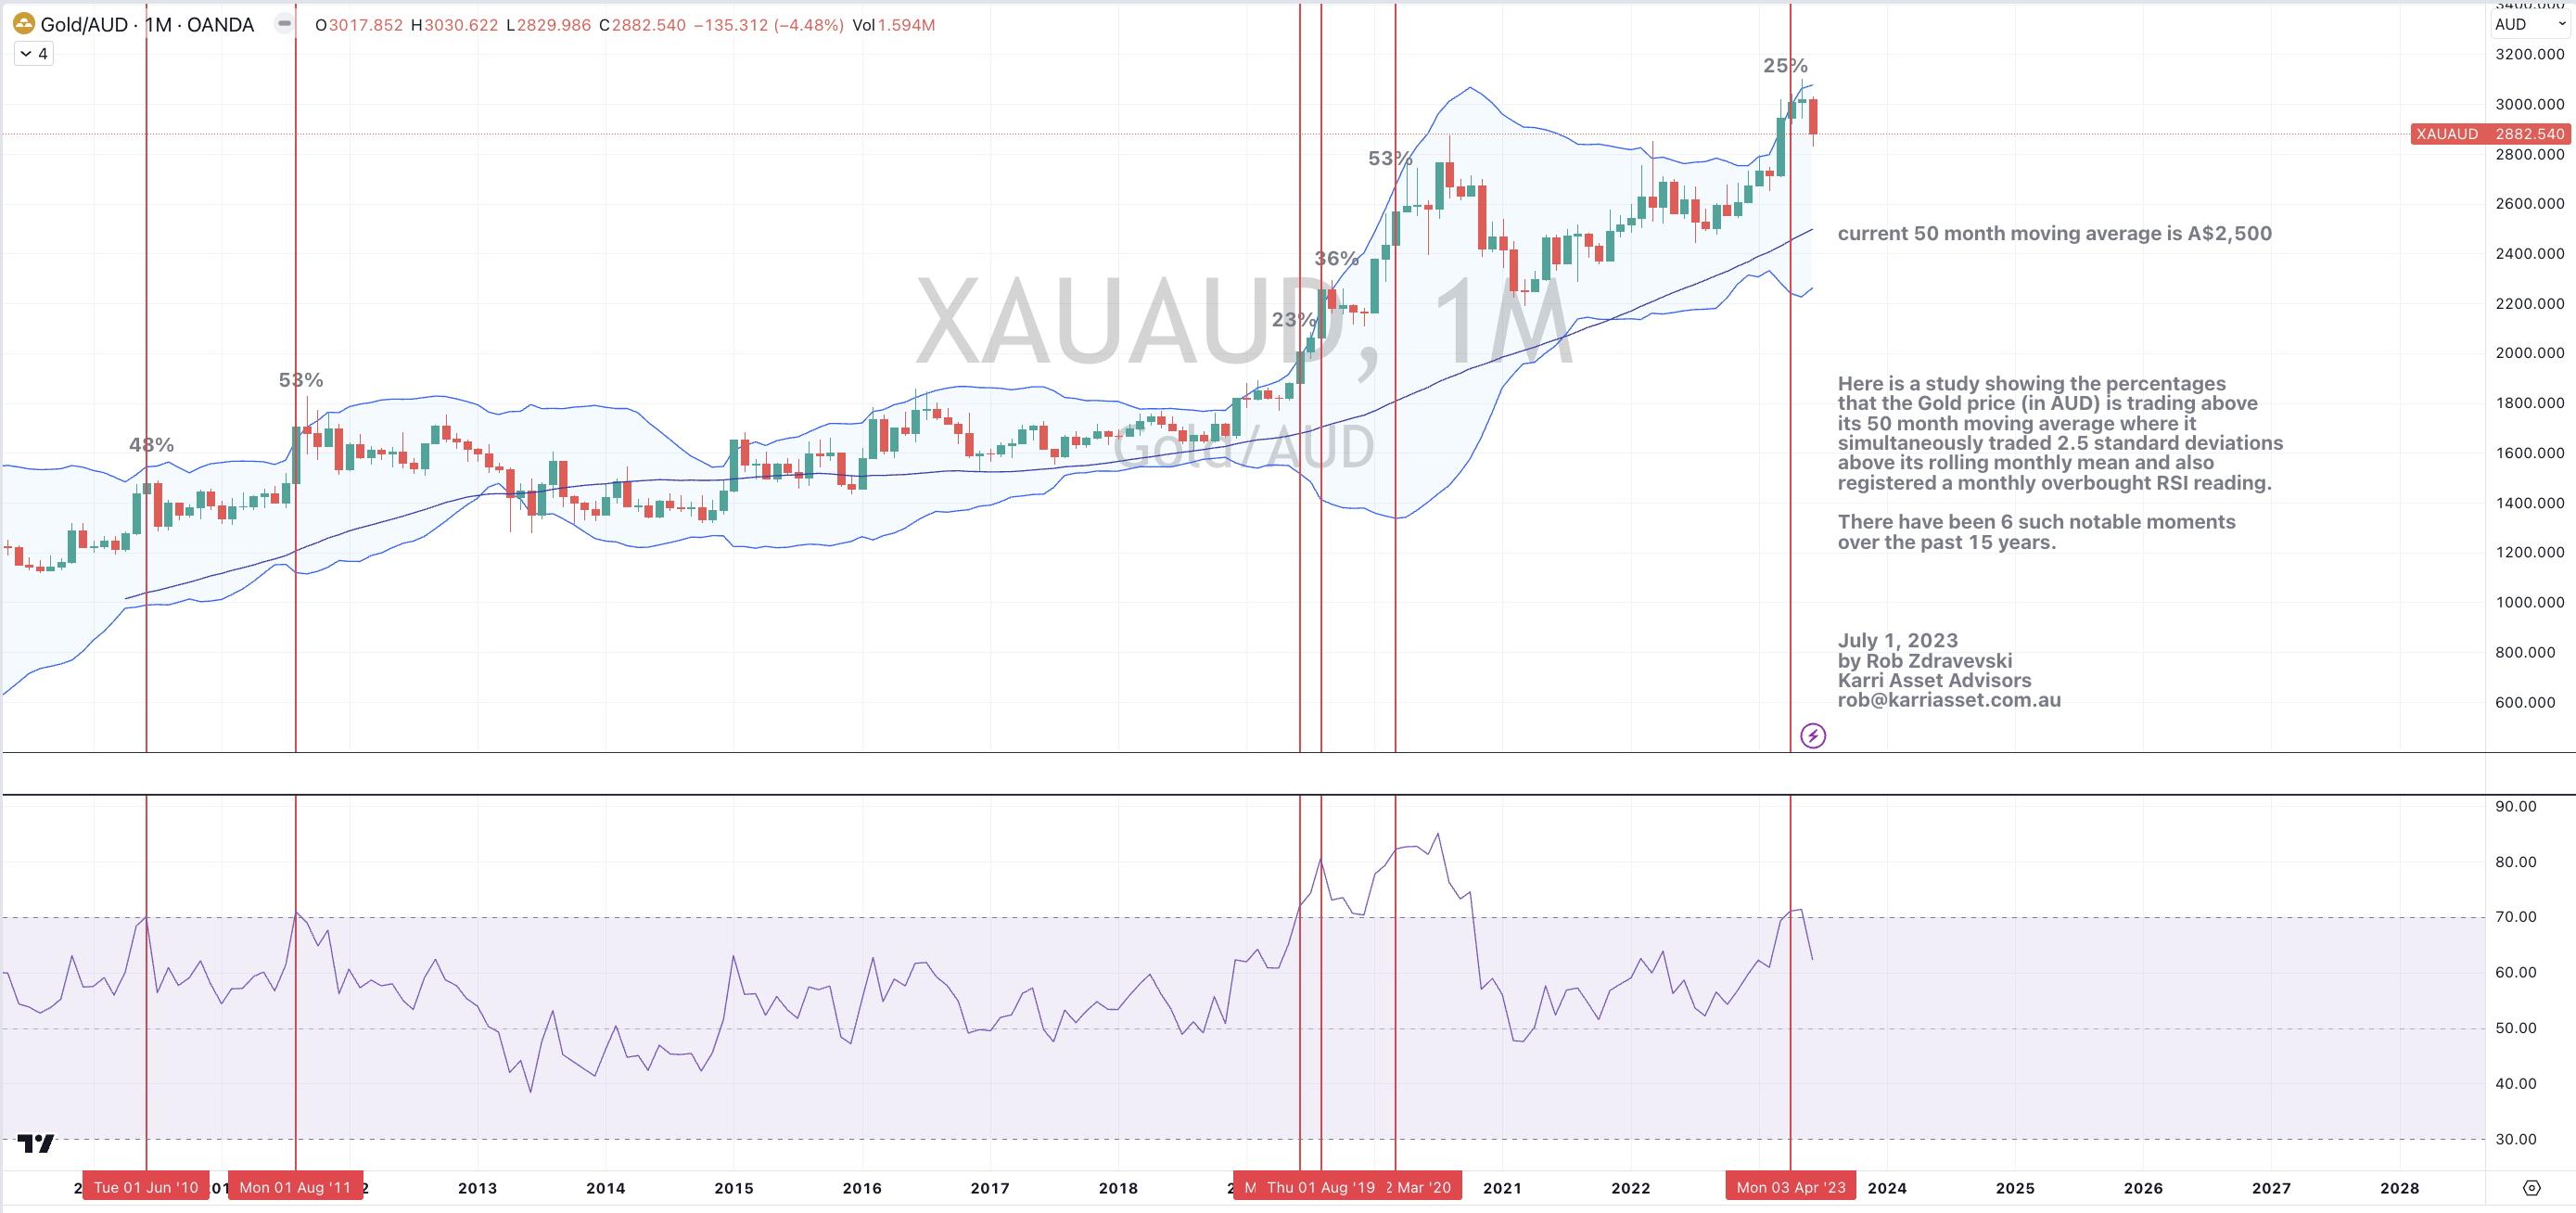
Gold closed at its lowest price since March 6, 2023.
Coffee has lost 15% over the past 3 weeks, while Palladium has seen the same decline in only 2 weeks.
As portended in last week’s note, the latter ventured into Oversold territory this week, along with the Aluminium price.
Natural Gas has soared 27% in 4 weeks.
Sugar continues its opposite travel from extreme overbought readings by falling 6% for the week (even after Friday’s 3% pop) and confirming the previous weeks bearish outside reversal.
And Silver bounced a little after last week’s visit back to its 200 week moving average.
Currencies were benign and mixed with slight moves by many in either direction.
The Euro was consistently stronger against its various crosses.
AUD/JPY took a break from its overbought status. This currency cross featured in last week’s commentary.
The Malaysian Ringgit moved out of oversold territory while the Chinese Yuan remains so for the 2nd consecutive week as it flirts with recent lows and making a even cheaper currency difficult to ignore amidst the shunning of globalisation in favour for ‘on-shoring’.
The larger advancers over the past week comprised of;
Rotterdam Coal 7%, Brent Crude 1.9%, Cocoa 4.7%, WTI Crude 2.1%, Lean Hogs 4.8%, Heating Oil 1.7%, JKM LNG 3.4%, Lithium 11.6%, Natural Gas 2.5%, Cotton 2.2%, Dutch TTF Gas 14.1%, Urea Middle East 11.7%, Silver AUD 1.8%, Oats 5.8%, Soybeans 2.5%, AEX 2.3%, KBW Bank Index 3.4%, CAC 3.3%, DAX 2%, DJ Industrials 2%, DJ Transports 5.7%, MIB 2.6%, IBEX 3.5%, Nasdaq Composite 2.2%, S&P MidCap 400 4.4%, Nasdaq 100 1.9%, Sensex 2.8%, Oslo 1.7%, Copenhagen 1.8%, Stockholm 3.3%, Russell 2000 3.6%, Philadelphia Semiconductor Index 4.7%, S&P 500 2.4%, S&P SmallCap 600 4.3%, Nasdaq Transports 6.2%, TSX 3.8%, ASX 200 1.5%, ASX SmallCaps 1.9%, Chile 1.9% and KRE Regional Bank index climbed 3.2%.
The group of decliners included;
Baltic Dry Index (10.3%), Aluminium (2.5%), Hot Rolled Coil Steel (3.2%), Coffee (3.6%), Lumber (5.1%), Tin (3.8%), Nickel (3.9%), Palladium (4.5%), Sugar (5.8%), Urea U.S, Gulf (1.8%), Corn (15.4%), Rice (4.7%), Wheat (12.1%), Nasdaq Biotech (1.6%) and Taiwan’s TAEIX fell 1.7%.
July 2, 2023
by Rob Zdravevski
rob@karriasset.com.au