A weekly Macro, Cross Asset review of prices trading at extremes which may generate future investment ideas and opportunities.
The following assets (on a weekly timeframe) either registered an Overbought or Oversold reading and/or have traded more than 2.5 standard deviations above or below its rolling mean.
Extremes “above” the Mean (at least 2.5 standard deviations
Australian 3 year government bond yields
Australian and U.S. 5 year government bond yields
Australian, Swiss and French 10 year government bond yields
U.S. 5 year breakeven inflation rate
U.S. 10 year breakeven inflation rate
U.S. 5 year bond minus 3 month bill yield spread
Rotterdam Coal
U.S. 10 year bond minus 5 year yield spread
Gold Volatility Index
Gold as priced in AUD and CAD
EUR/GBP
Overbought (RSI > 70)
Chilean, Japanese, New Zealand and Turkish 10 year government bond yields
Japanese 5 year government bond yield
U.S. 7, 10, 20 and 30 year government bond yields
TBT & TBX
U.S. 10 year bond minus 2 year yield spread
U.S. 10 year minus U.S. inflation rate
U.S. 10 year minus 10 year breakeven inflation rate
Australian Coking Coal
Baltic Dry Index
Orange Juice
Uranium
Rubber
And Russia’s MOEX
The Overbought Quinella – Both Overbought and Traded at > 2.5 standard deviations above the weekly mean)
U.S. 5 – 7 year corporate bond yields
South Korean 10 year government bond yield
U.S. 10 year minus German 10 year government bond yield spread
Extremes “below” the Mean (at least 2.5 standard deviations)
Copper/Gold Ratio
IEI & SHY
MXN/USD
Shangai Composite
CSI 300
CAC 40
China A50
IDX, KOSPI, BOVESPA & IBEX
FTSE 250
Nasdaq Biotech Index
And the Copenhagen, Helsinki and Swiss equity indices
Oversold (RSI < 30)
U.S. Mid West Hot Rolled Coil Steel
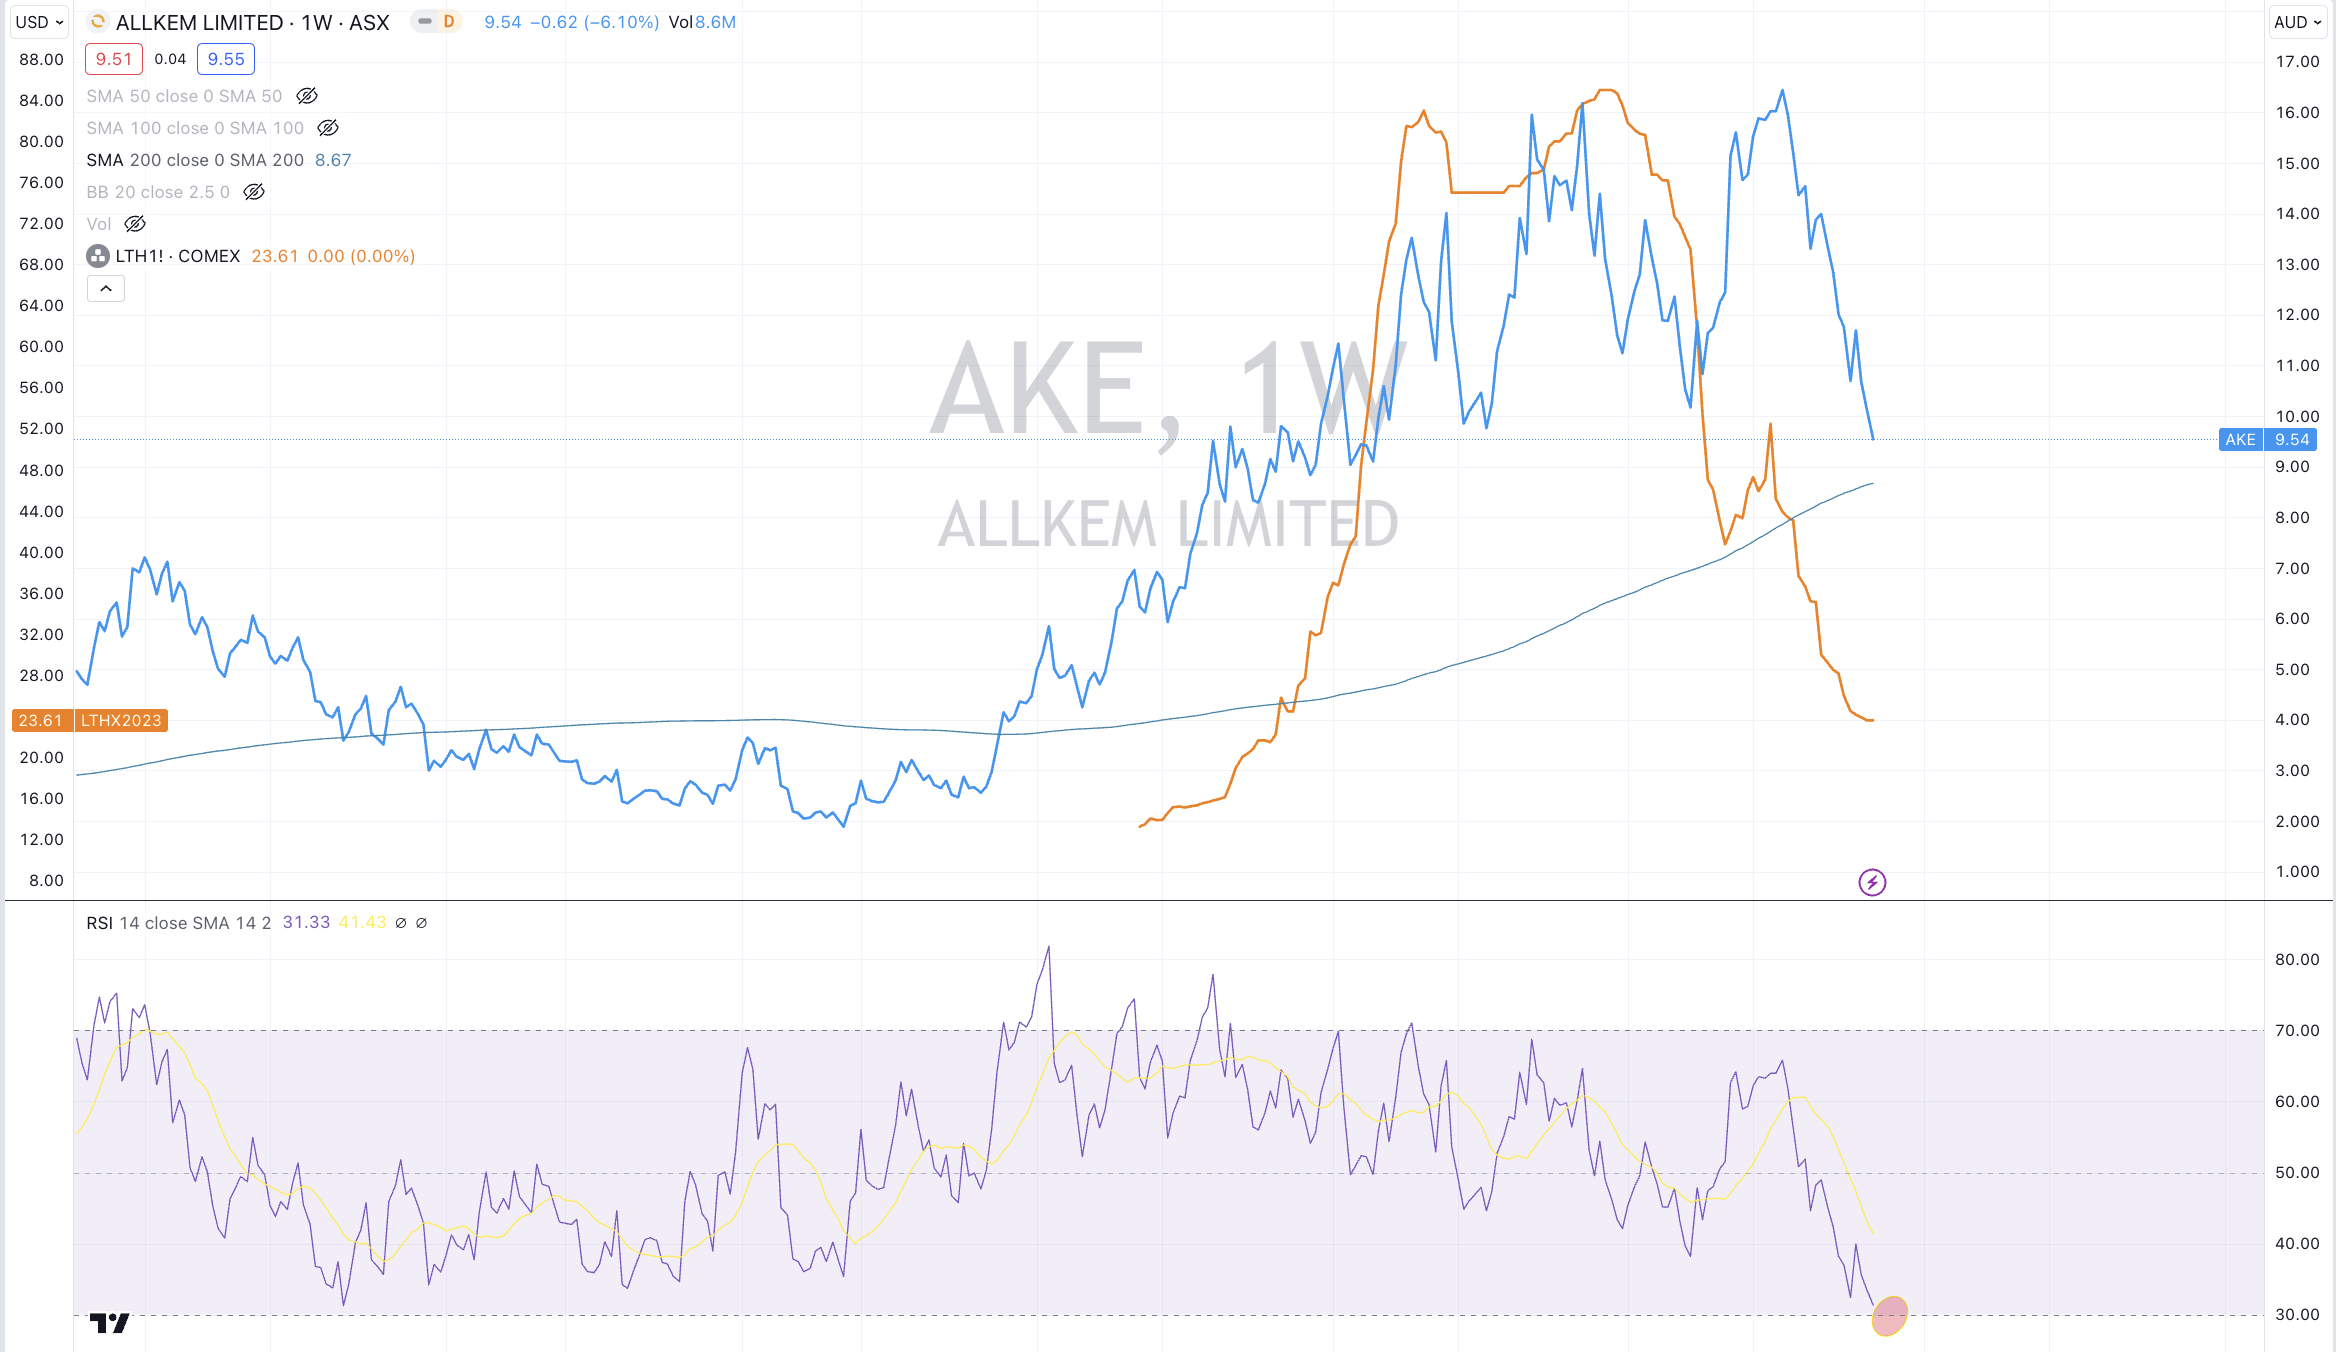
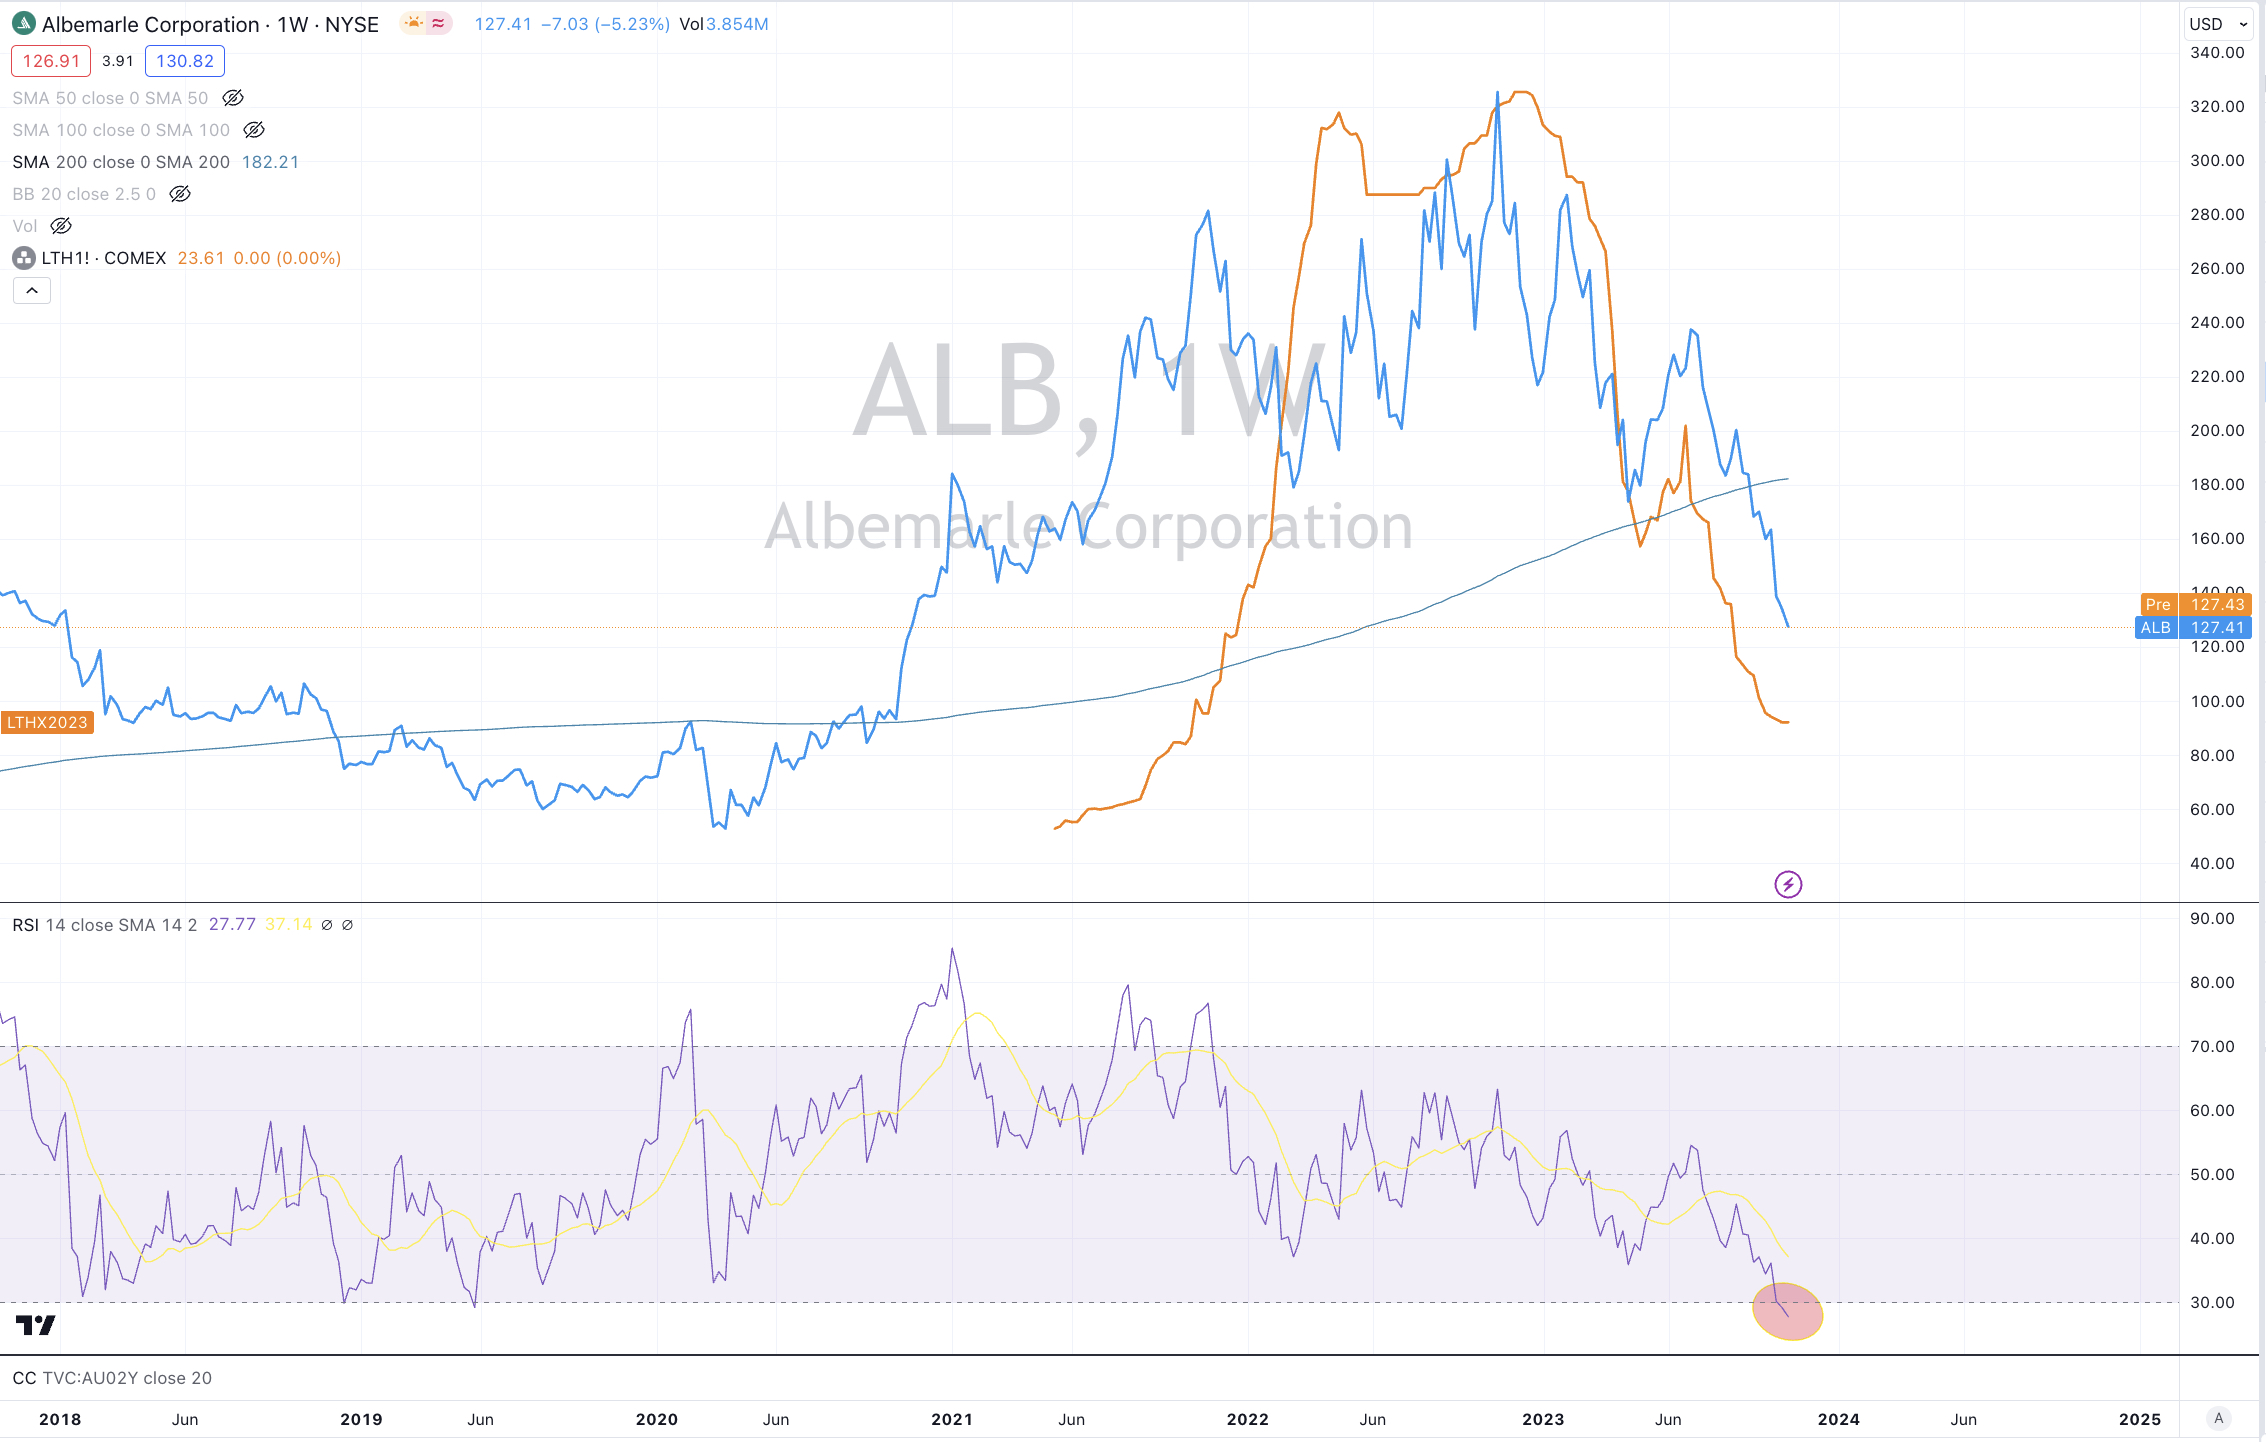
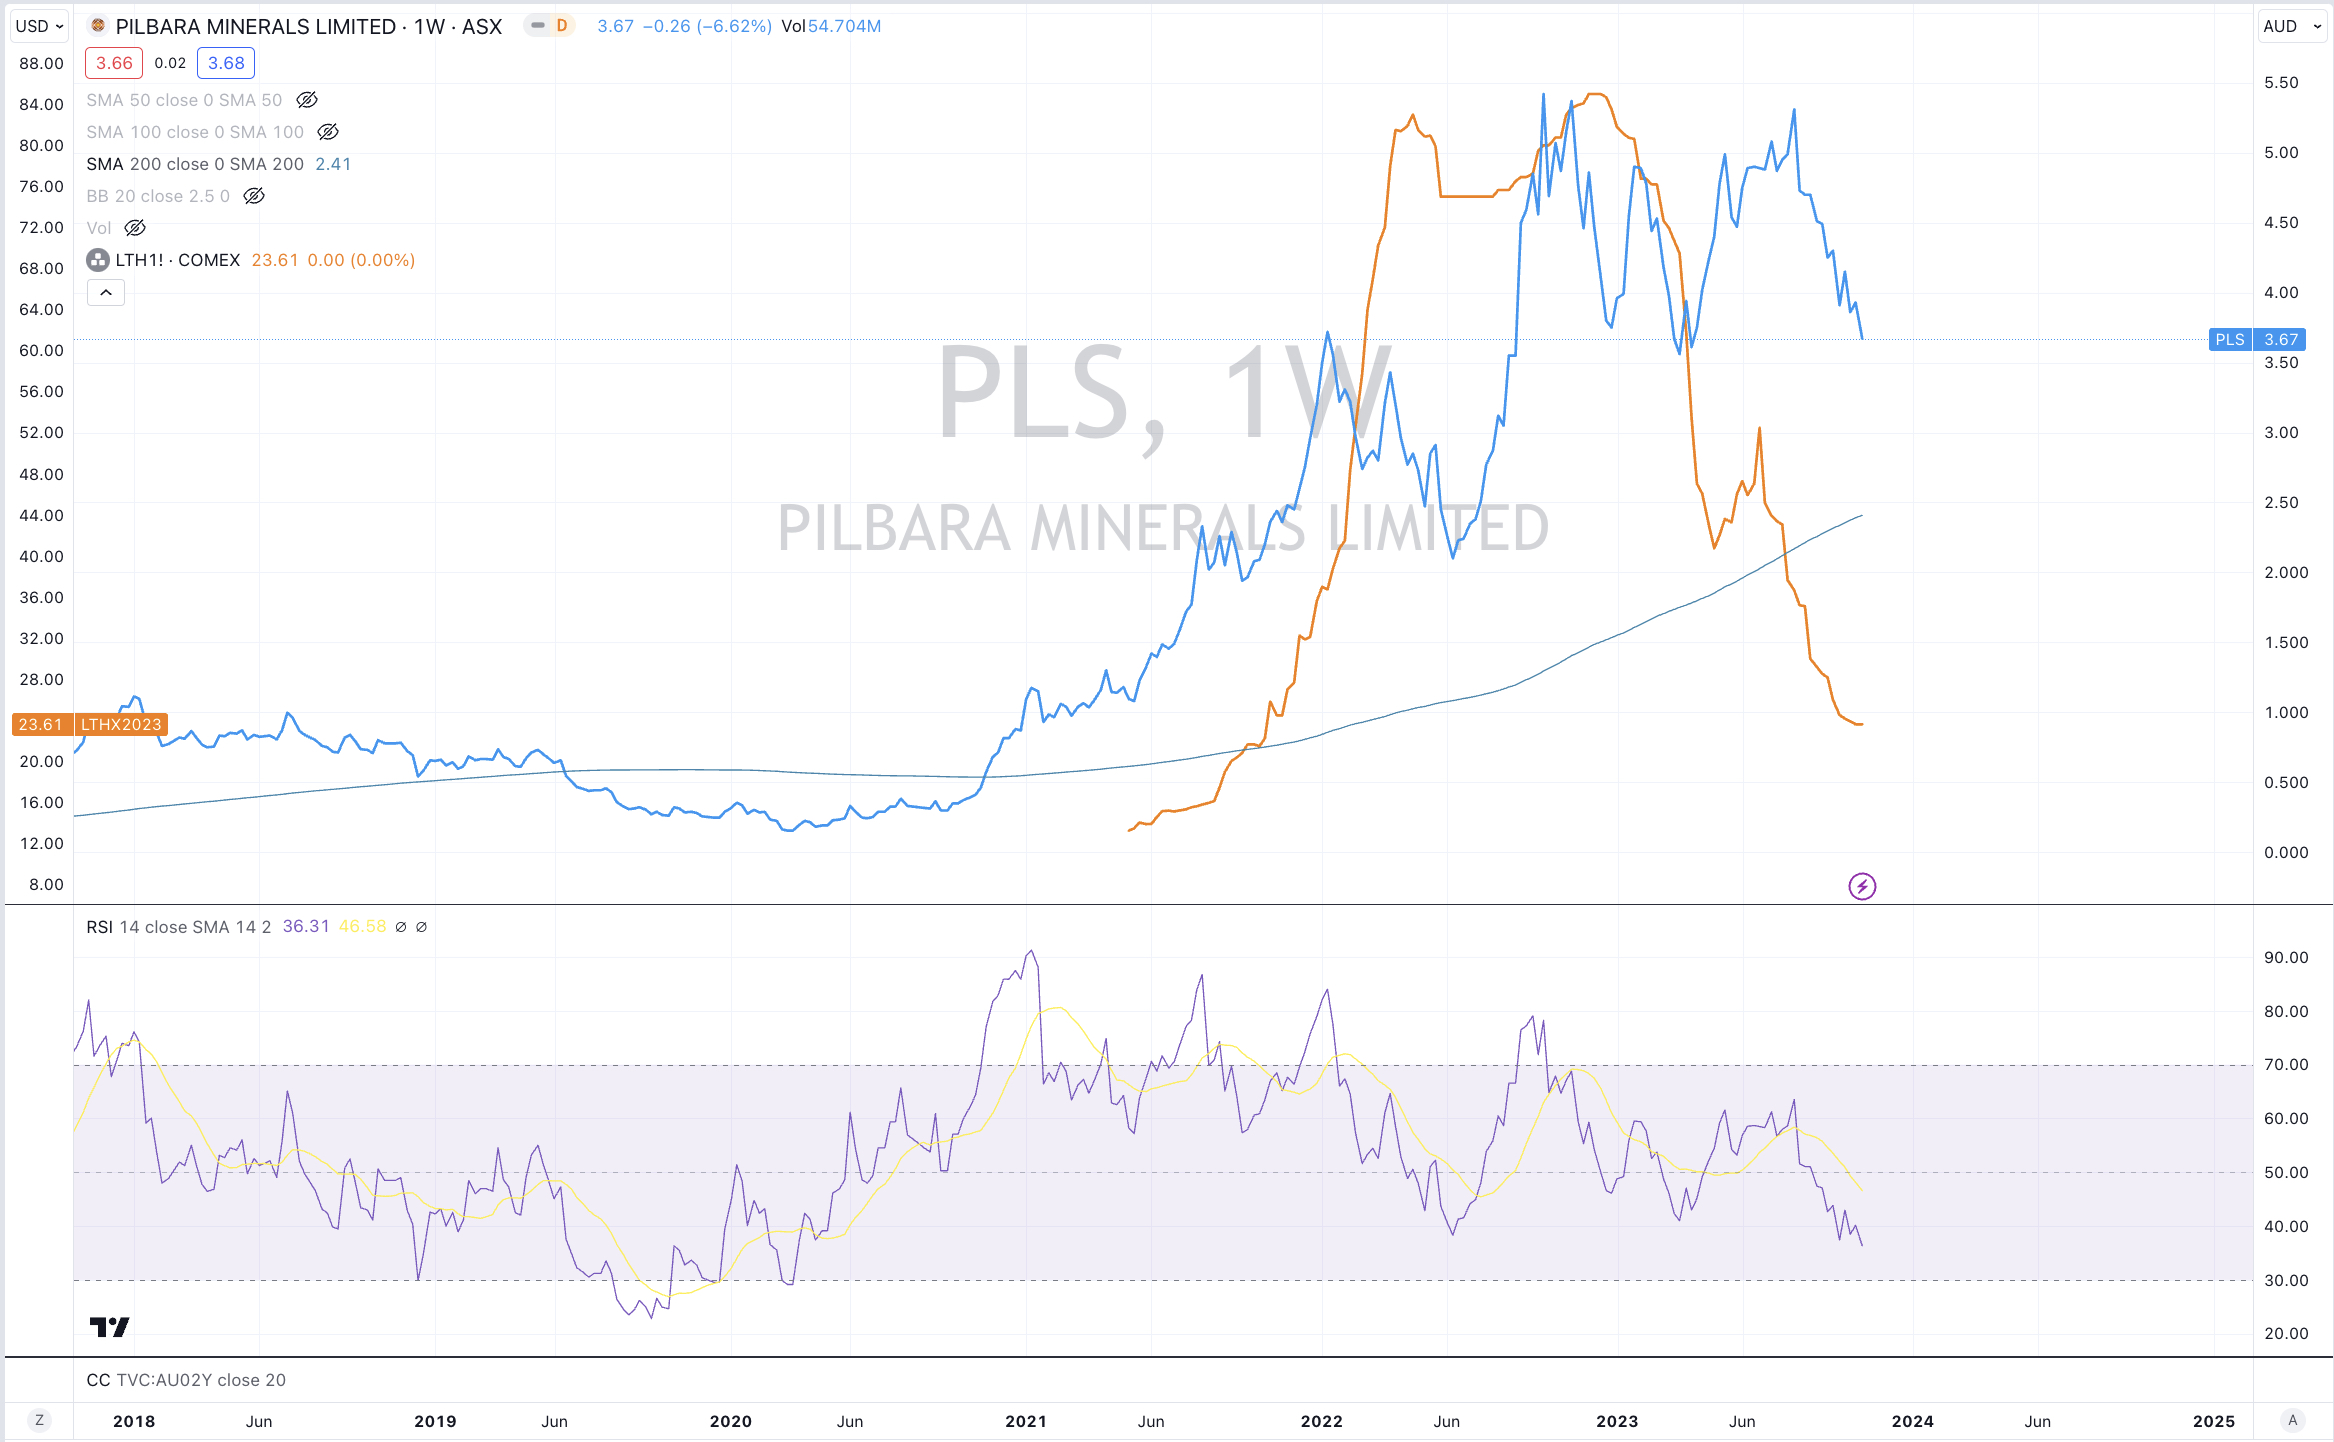
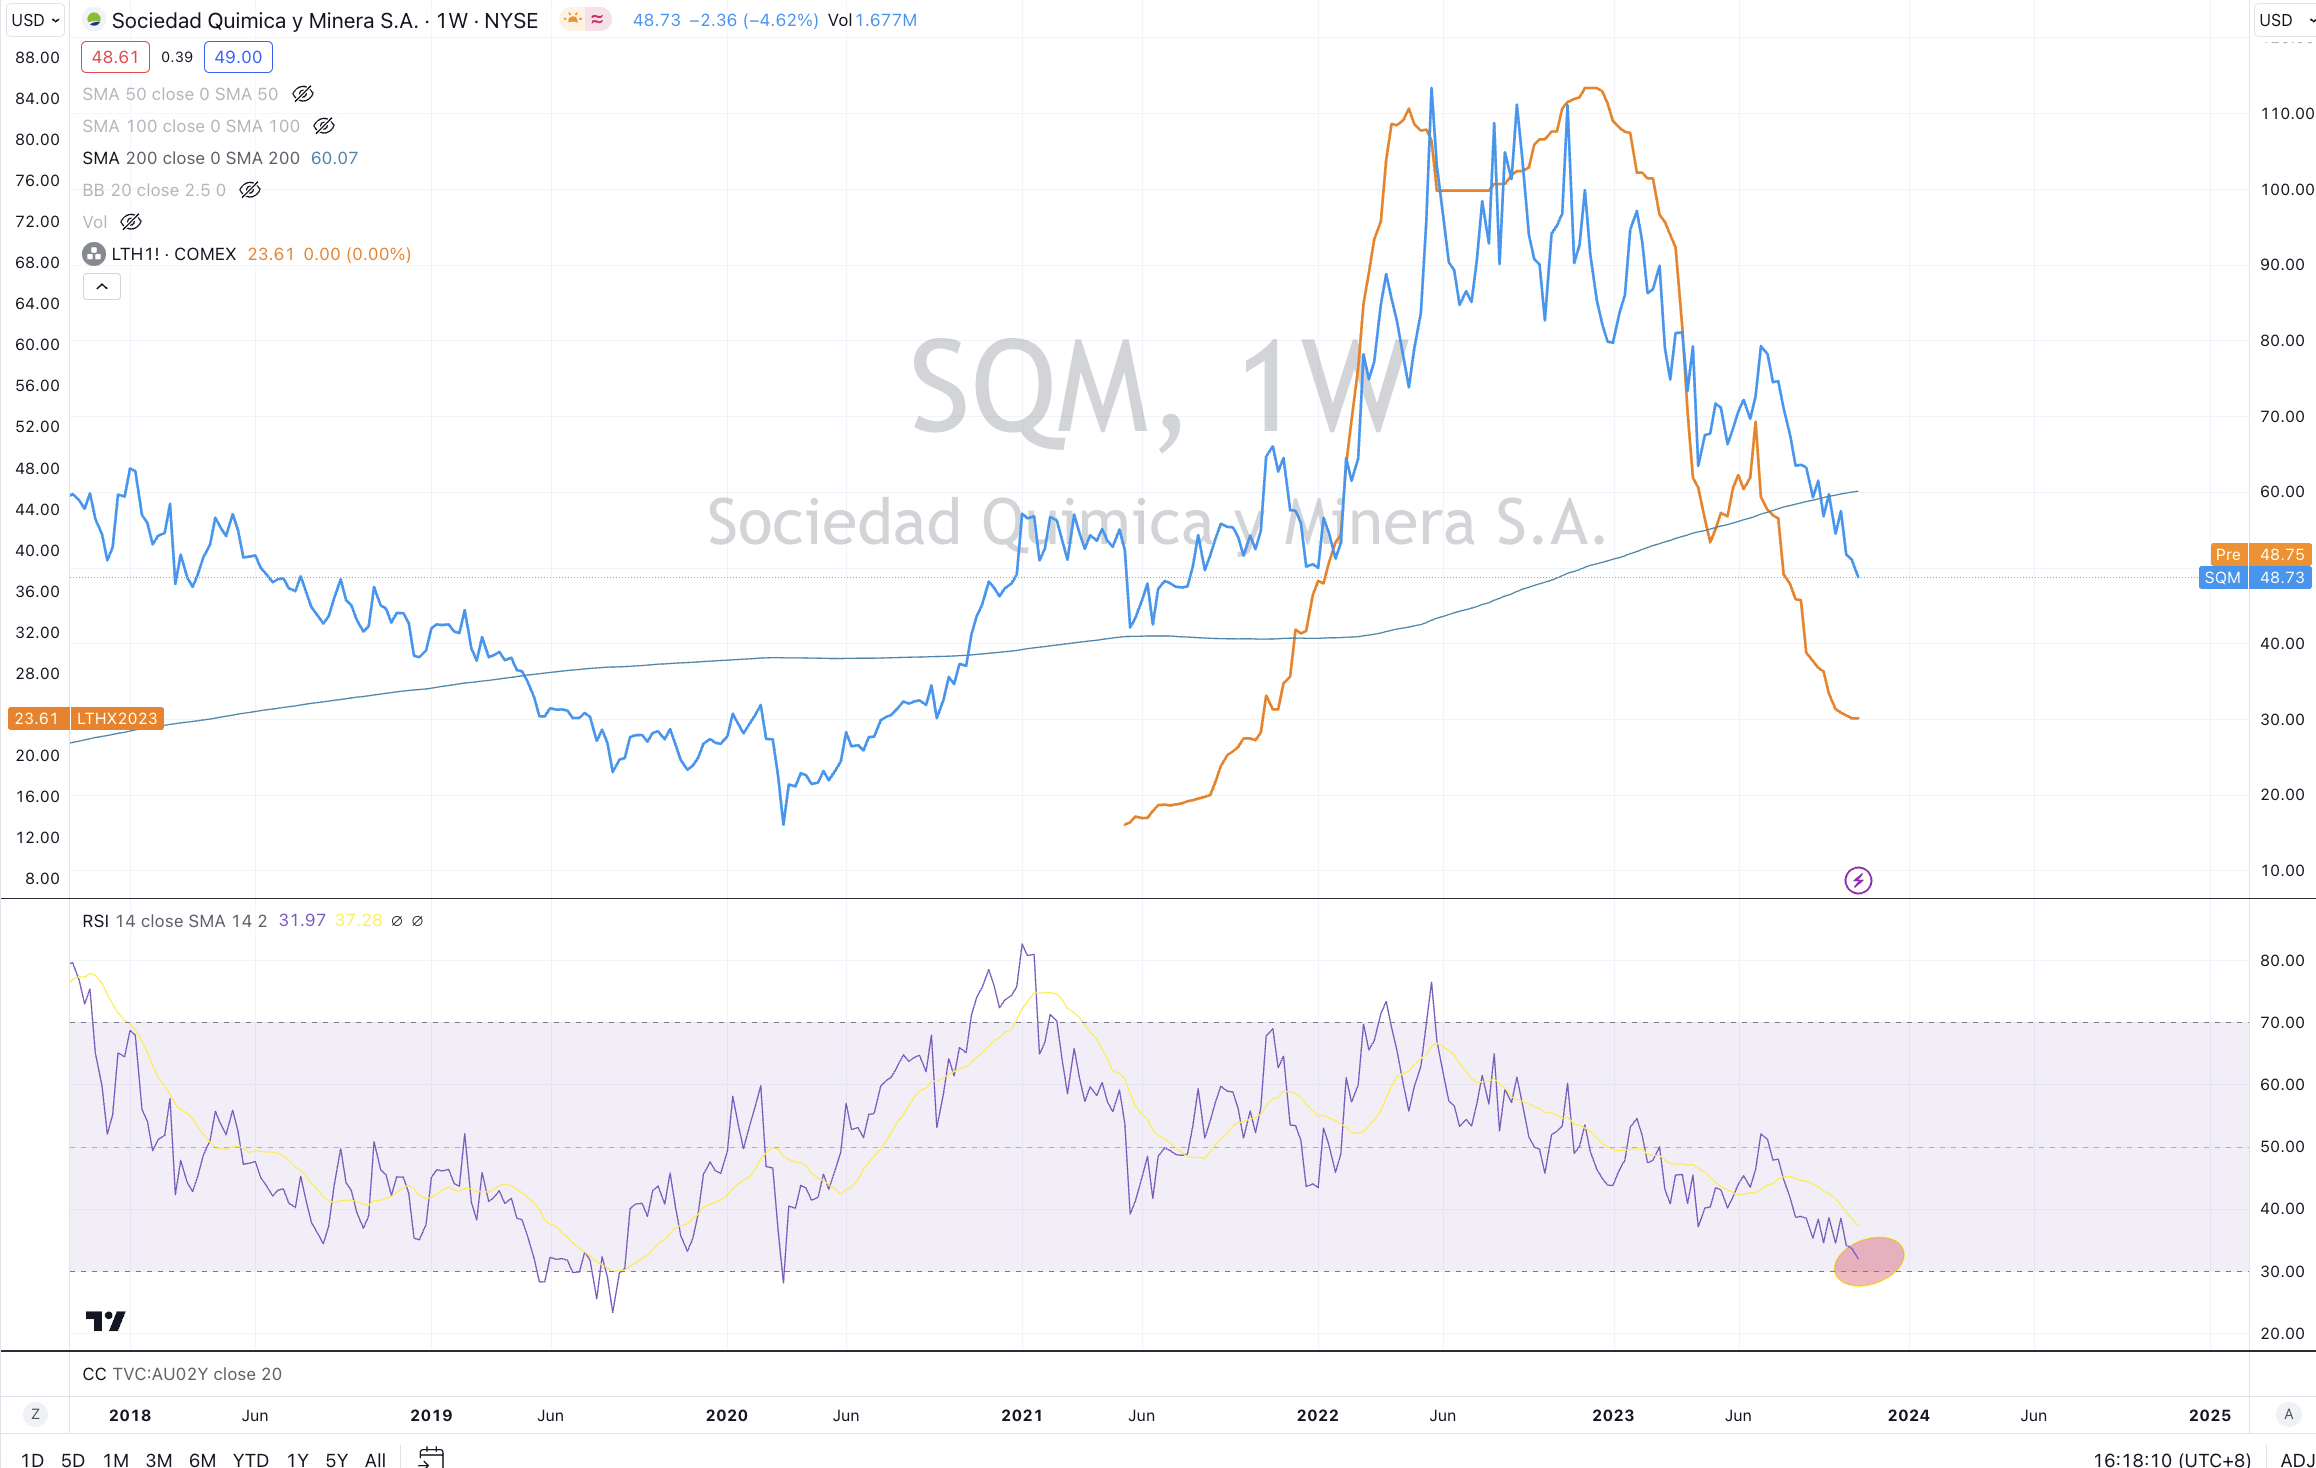
Lithium Hydroxide
JPY/USD
MYR/USD
CLP/USD
IDR/USD
And Mexico’s equity index
The Oversold Quinella – Both Oversold and Traded at < 2.5 standard deviations below the weekly mean)
Thailand’s SET equity index
Notes & Ideas:
Government bond yields rose, reversing last week’s decline.
Many overbought yields which appeared in Macro Extremes over the past 2 weeks have now left the list.
Furthermore, the U.S. 3 month bill isn’t overbought.
While the U.S. 5-7 year corporate bond yields have returned to overbought territory, this time into the quinella category.
The mood was evident amongst Equities that another losing week resumes the recent slide.
Such is the ‘slide’ that many indices having fallen 5 of their last 7 weeks or 6 of their recent 8 weeks.
So much so, that a bunch of stock indices have re-entered oversold land.
The Russell 2000 has fallen 6% over the past 2 weeks and 16% in the last 12 weeks, while also closing at its lowest price since early October 2022.
The U.S. Regional Banking Index is at its lowest close since May 2023.
The KOSPI gave up last week’s gain to decline and become oversold whilst recording its lowest closing price since March 2023.
The FTSE 250 is in a 5 week losing streak having fallen 9% over the past 5 weeks.
The CAC and DAX are also in a 5 week losing streak.
The HSCEI is at its lowest close since late November 2022, the S&P MidCap 400 is 0.3% from reverting to its 200 week moving average, the ASX 200 is 0.6% away from doing the same and the Nasdaq Biotech Index and Copenhagen’s OMX 25 have closed at their lowest prices since late September 2022.
Commodities were mixed during the week.
We saw strength in precious metals and the agricultural’s and weakness amongst coal and gas prices.
Crude Oil took a break with WTI Crude only rising 0.4%.
Natural Gas isn’t overbought following its 9% decline during this past week.
The Baltic Dry Index has risen for 7 consecutive weeks, while Orange Juice broke its 6 week consecutive advance (falling from its recent all-time high) and Australian Coking Coal snapped its 14 week winning streak.
Gold (as priced in CAD) has risen 8% over the past fortnight while AUD Gold has climbed 9%. Both appear in this week’s overbought list.
Coffee has soared 14% in the past 2 weeks.
Natural Gas fell 9%, adding to last week’s 3% fall. This halves the 25% rally which started at the beginning of the month.
Uranium remains overbought for an 10th consecutive week.
U.S. Mid West Hot Rolled Coiled Steel has been oversold for 8 weeks,
while Lithium Hydroxide declining streak extends to 15 consecutive weeks.
Amongst currencies, the Australian Dollar was mostly higher against most pairs.
The Loonie was weaker and the Euro was firmer, not quite making to oversold territory.
The CHF/AUD is heading back towards overbought territory.
The Euro is close to being oversold.
The MYR/USD is in a 8 week losing streak.
The larger advancers over the past week comprised of;
Baltic Dry Index 5.2%, Cocoa 5.6%, Coffee 6.7%, LNG JKM 5.9%, Tin 3.3%, Platinum 2.4%, Gasoline 3.9%, Brent 1.6%, Uranium 4.8%, Silver in AUD 2.6%, Silver in USD 2.9%, Gold in AUD 2.2%, Gold in CAD 2.9%, Gold in USD 2.5%, Soybeans 3.1%, MOEX 2.4% and the ASX Industrial rose 0.7% having completed its reversion back to its 200 week moving average.
The group of decliners included;
Australian Coking Coal (2.9%), China Coking Coal (3.3%), Cotton (4.3%), Lean Hogs (5%), Lumber (3.6%), Newcastle Coal (3.6%), Natural Gas (9%), Palladium (3%), Dutch TTF Gas (5.3%), Shanghai (3.4%), CSI 300 (4.2%), AEX (2.4%), KBW Bank Index (3.8%), CAC (2.7%), China A50 (4.2%), DAX (2.6%), DJ Industrials (1.6%), MIB (3.1%), HSCEI (4%), Hang Seng (3.6%), IBEX (2.2%), BOVESPA (2.3%), Indonesia (3%), S&P SmallCal 600 (1.7%), Nasdaq Composite (3.2%), KRE Regional Banks (3.3%), KOSPI (3.3%), FTSE 250 (2.4%), S&P MidCap 400 (2%), Nasdaq Biotech’s (3.7%), Nasdaq 100 (2.9%), Nikkei 225 (3.3%), Oslo (3%), Copenhagen (5.1%), Helsinki (5.5%), Stockholm (5.1%), Russell 2000 (2%), SET (3.5%), SMI (5.1%), SOX (4%), Chile (2.8%), S&P 500 (2.4%), STI (3.4%), TAIEX (2%), Nasdaq Transports (3.1%), TSX (1.8%), FTSE 100 (2.6%), ASX 200 (2.1%), ASX Small Caps (2.2%), BIST 100 (7.4%) and the ASX Materials Index fell 1.6%.
October 22, 2023
by Rob Zdravevski
rob@karriasset.com.au