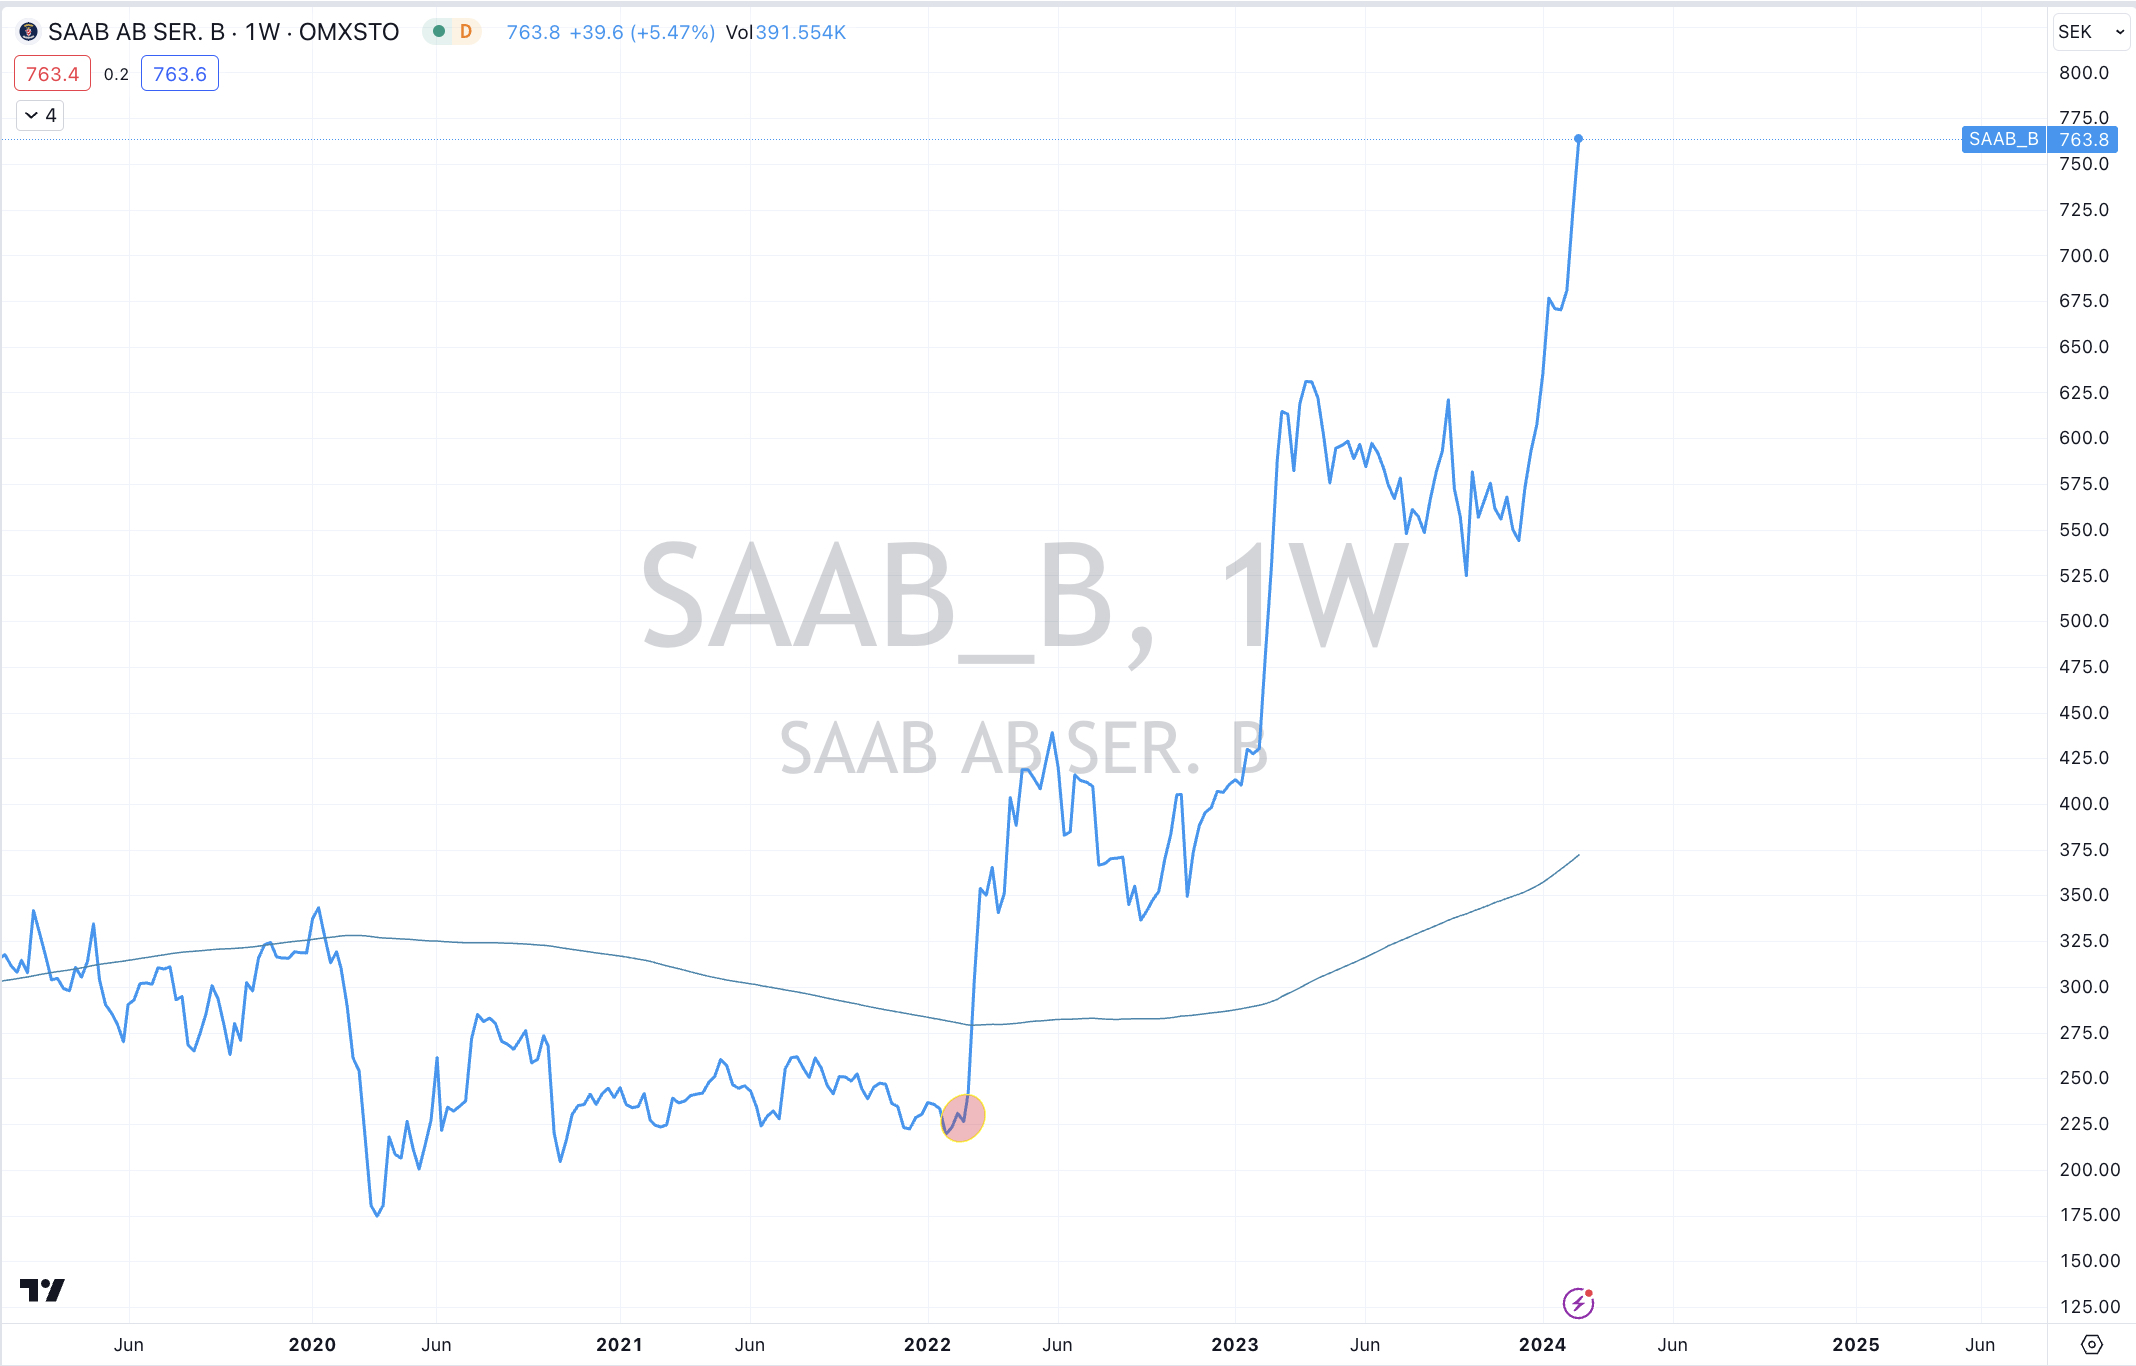
The stock price started getting a wriggle-on in late February 2022 around the time of Slavic agitation and supported with the #defence expansion of NATO (see #Sweden and #Finland).
The 10% decline in the #SEK vs the USD doesn’t matter and didn’t warrant any currency hedging.
A weekly Macro, Cross Asset review of prices trading at extremes which may generate future investment ideas and opportunities.
The following assets (on a weekly timeframe) either registered an Overbought or Oversold reading and/or have traded more than 2.5 standard deviations above or below its rolling mean.
Extremes “above” the Mean (at least 2.5 standard deviations
Cotton
Gasoil
NZD/AUD
Overbought (RSI > 70)
Uranium
Rice
Robusta Coffee
AEX
Italy’s MIB
Nikkei 225
Dow Jones Industrial Average
Nasdaq 100
Nasdaq Composite
Nasdaq Transportation Index
Egypt 30 Index
Philadelphia Semiconductor Index (SOX)
And the S&P 500 Index
The Overbought Quinella – Both Overbought and Traded at > 2.5 standard deviations above the weekly mean)
Cocoa
Russia’s MOEX Index
Turkiye’s BIST 100 Index
Extremes “below” the Mean (at least 2.5 standard deviations)
Shanghai Composite
Oslo’s OBX Index
Oversold (RSI < 30)
Chile 2 year government bond yield
JKM LNG
Lithium Hydroxide
Nickel on India’s MCX Exchange
Corn
Soybean
The Oversold Quinella – Both Oversold and Traded at < 2.5 standard deviations below the weekly mean)
China 10 year government bond yield
Notes & Ideas:
Government bond yields were higher for week.
Many of them are on the move higher back towards the middle of their recent ranges.
German 10’s closed at their highest weekly close since November 30, 2023.
Equities were stronger, however there were some losers too.
The Dow Jones Industrial Average has put together a 5 week winning streak and has spent the past 9 weeks in overbought territory.
The S&P 500 is also in a 5 week winning streak and has risen for 14 of its past 15 weeks.
Amsterdam’s AEX made a new all-time high.
The Nasdaq Composite are yet to reach a new all-time high but it did close at its highest weekly close while stretching a 5 week winning streak.
The Nasdaq Transportation Index made an all-time high and weekly close. It has risen 10% in the past 4 weeks.
The Russell 2000 and the S&P MidCap 400 both performed a bullish outside reversal week.
And Turkiye’s BIST has risen for 5 consecutive weeks making for a 19% (in TRY terms) return.
Commodities were generally stronger with the notable advancers and decliners listed below.
The big news was that Lithium Hydroxide prices were unchanged for the week.
Does being ‘unchanged” qualify to end its 13 week consecutive losing streak?
Lean Hogs aren’t overbought but Cotton and Gasoil (Diesel) is.
Cattle is in a 6 week winning streak and has closed higher in 8 of the past 9 weeks. Furthermore, Cattle is trading at extended percentages (41%) above its 200 week moving average.
Heating Oil continues its roller coaster. This week it rose 10%, last week it fell 6% and the week before that saw it rise 7%. Mamma Mia !
Sugar is in a 6 week winning streak.
Soybeans and Corn are registering oversold extremes.
Soybeans are in a 8 week losing streak and have fallen 12 of the past 13 weeks.
It’s worth to note that Henry Hub Natural Gas prices are a whisker away from making new all-time lows while JKM LNG are trading at their lowest close since December 20, 2020.
And Lithium Hydroxide has now spent 32 consecutive weeks in weekly oversold territory.
Amongst currencies, the collective U.S. Dollar (DXY) Index is in a 4 week winning streak.
While against specific pairs, the U.S. Dollar has risen for the past 5 or 6 weeks.
The AUD has slight gains, thus putting an end to its consecutive losing streaks against many pairs such as the 6 week losing streak for the AUD/SGD.
The Yen was weaker.
And the GBP/USD is in a 4 week losing streak.
The larger advancers over the past week comprised of;
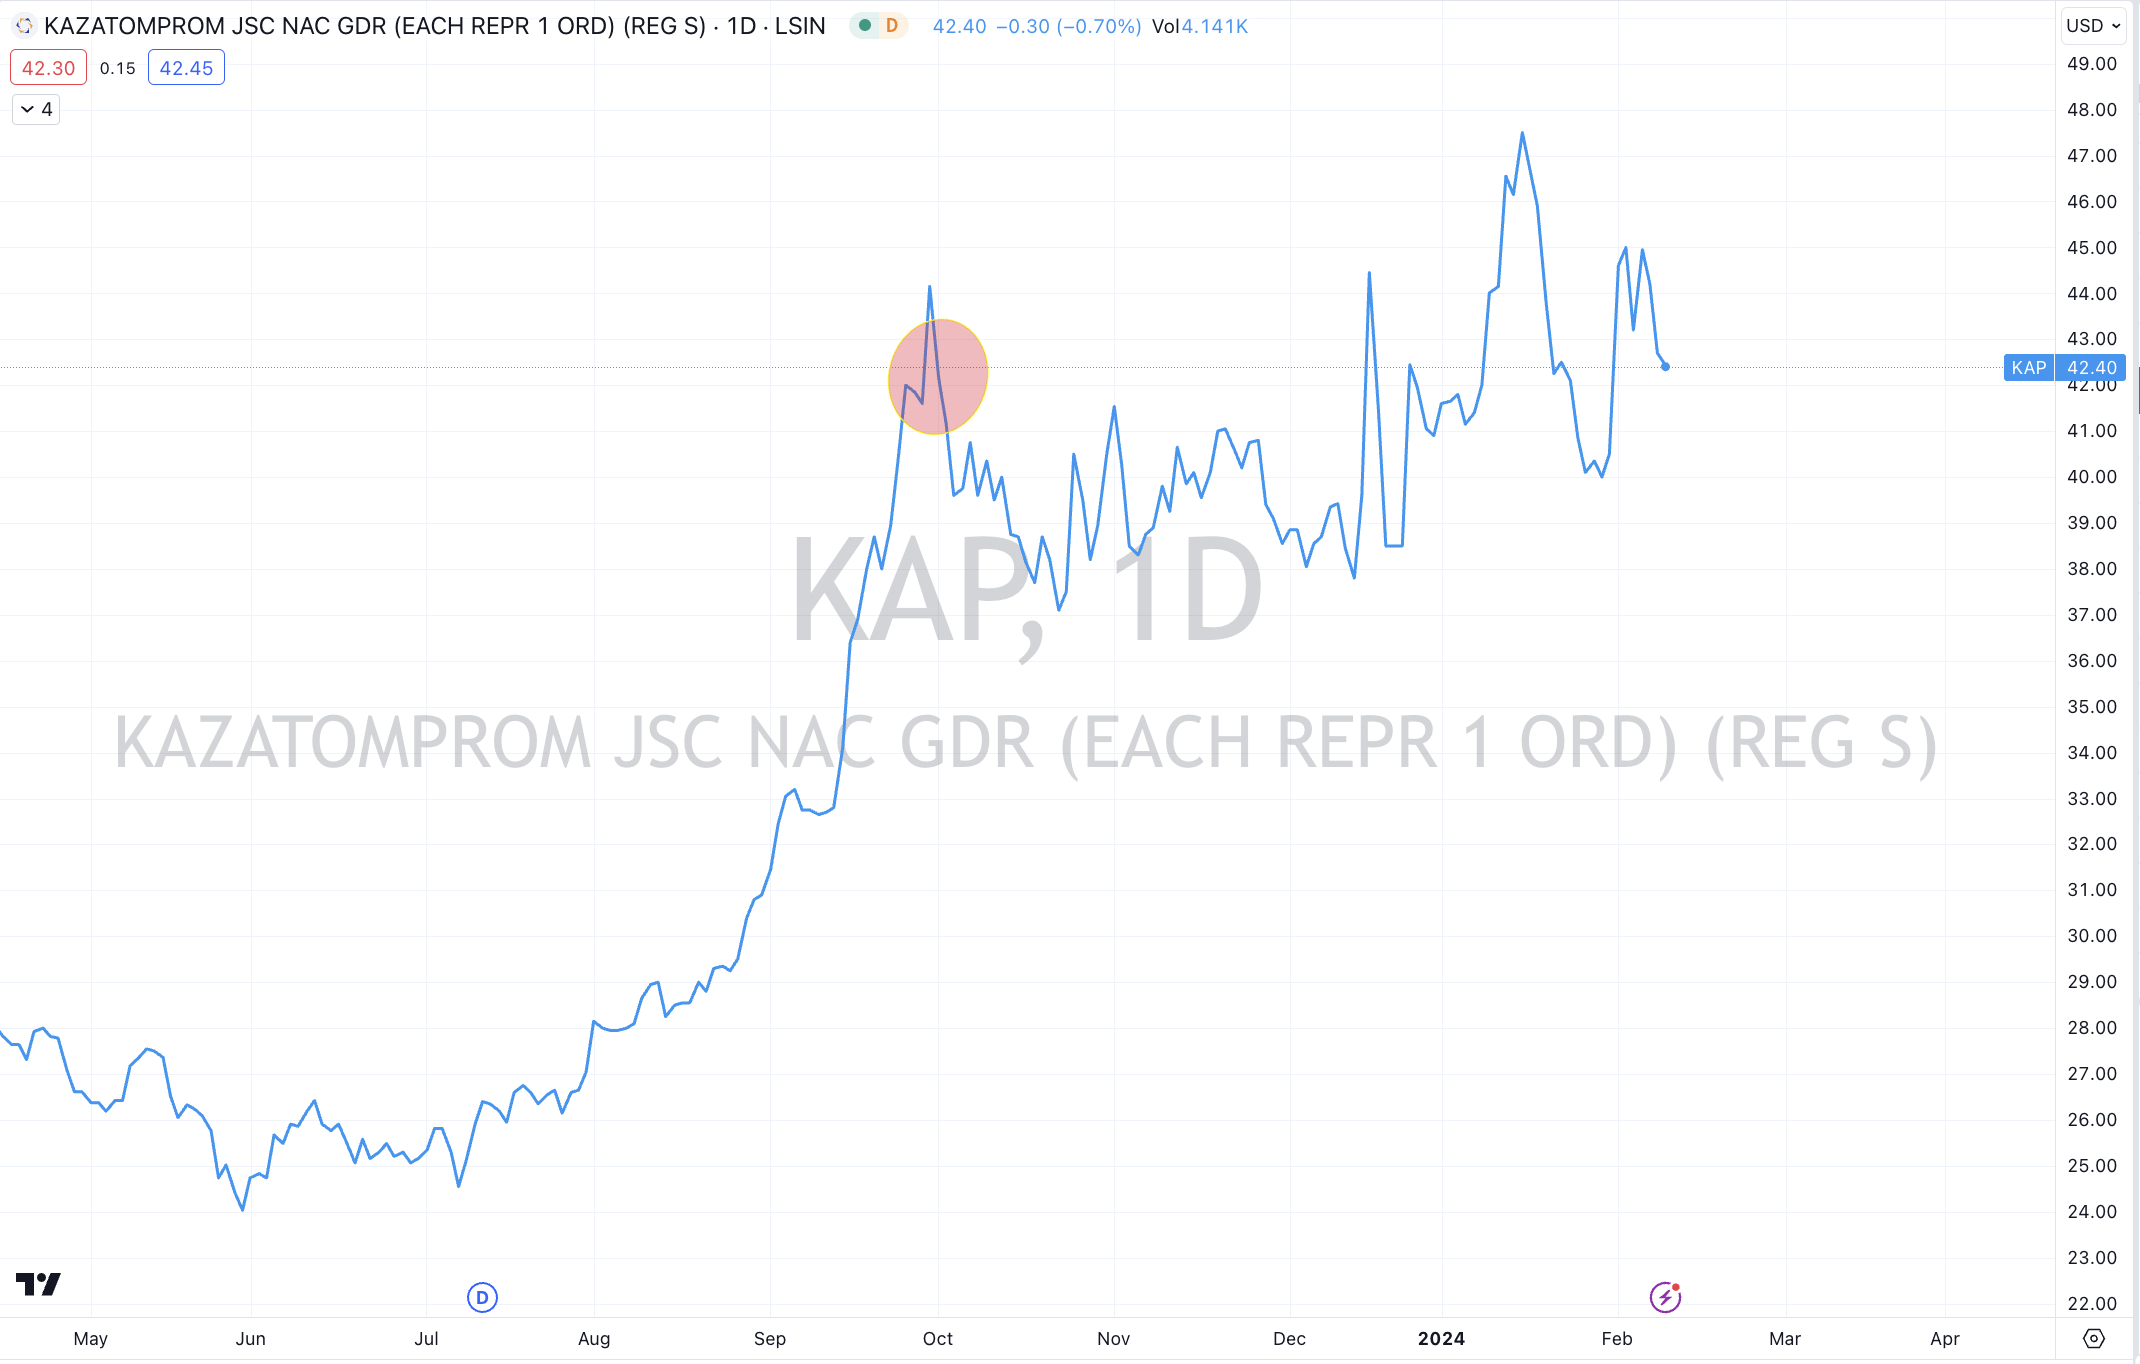
I like the structural uranium deficit theme for some 3 years but in this note I want to highlight the dislocation between the stock price of Kazatomprom, the price of uranium and the media/pundit noise.
Kazatomprom’s stock price is back to the same price seen in September 2023.
How are listed company share buybacks considered a return of cash to shareholders?
It’s simply a company buying their own shares in the public market and adding them to their treasury stock.
What this action does do, is reduce the shares outstanding (on issue) which improves the “total shareholder return” and the “earnings per share”.
Invariably, much of senior management compensation/remuneration is based on increasing these two metrics.
By the way, buying back your own shares isn’t any stroke of genius. In fact, it’s lazy.
A company is lazy if it can’t use its excess cash for the purpose of growth such as re-investing in its own operations or acquire someone……or improve its capital/debt structure.
A dividend is the best return of cash for a shareholder but this doesn’t help the executives bonuses.
A weekly Macro, Cross Asset review of prices trading at extremes which may generate future investment ideas and opportunities.
The following assets (on a weekly timeframe) either registered an Overbought or Oversold reading and/or have traded more than 2.5 standard deviations above or below its rolling mean.
Extremes “above” the Mean (at least 2.5 standard deviations
Lean Hogs
Overbought (RSI > 70)
SHY
Cocoa
Rubber
Uranium
AEX
Dow Jones Industrial Average
Nasdaq 100
Nasdaq Composite
NIFTY
And the S&P 500 Index
The Overbought Quinella – Both Overbought and Traded at > 2.5 standard deviations above the weekly mean)
KLSE – the Kuala Lumper Stock Exchange
Turkiye’s BIST 100 Index
Extremes “below” the Mean (at least 2.5 standard deviations)
None
Oversold (RSI < 30)
Chile 2 year government bond yield
JKM LNG
Lithium Hydroxide
Nickel on India’s MCX Exchange
Corn
Soybean
CSI 300
The Oversold Quinella – Both Oversold and Traded at < 2.5 standard deviations below the weekly mean)
China 10 year government bond yield
Shanghai Composite Index
Notes & Ideas:
Government bond yields were mostly lower for the week, again, even with jump in yields seen in Friday’s session.
The British 2’s, 3’s and 5’s were the exception, wth rising yields for the 2nd consecutive week).
The Japanese 2’s rose in stunning fashion. They have climbed from 0.00% to 0.10% over the past 3 weeks.
Equities were mixed, with a slight weaker bias, although many more are appearing in the overbought column.
Indonesia rose 3.5% reclaiming all of last week’s decline.
The Dow Jones Industrial Average has pout together a 4 week winning streak and has spent the past 8 weeks in overbought territory.
The S&P 500 is also in a 4 week winning streak and has risen for 13 of its past 14 weeks.
The Shanghai Composite has now registered an oversold quinella.
Amsterdam’s AEX and the Nasdaq Composite are yet to reach a new all-time high but the former did close at its highest weekly close.
The Nasdaq Transportation Index finished at its highest weekly close but yet it to break its previous all-time high. It has risen 7% in the past 3 weeks.
And Turkiye’s BIST has risen for 5 consecutive weeks making for 15% (in TRY terms) return.
Commodities were weaker with energy contracts.
To accompany that weakness in energy, WTI Crude, Brent Crude and Gasoline prices posted bearish outside reversal weeks.
Cattle is in a 5 week winning streak and has gained in 7 of the past 8 weeks. Furthermore, Cattle is still trading at extended percentages (39%) above its 200 week moving average.
Newcastle Coal broke its 7 week losing streak.
Heating Oil fell 5.5% giving up most of last week’s 6.8% rise.
Sugar is in a 5 week winning streak.
Soybeans and Corn are registering oversold extremes.
Soybeans are in a 7 week losing streak and have fallen 11 of the past 12 weeks.
JKM LNG is at its lowest close since December 20, 2020.
And Lithium Hydroxide has now spent 31 consecutive weeks in weekly oversold territory.
Amongst currencies, the AUD has seen its 5th and 6th consecutive week of declines against many pairs, which sits proportionally within my published note on December 29, 2023 that the AUD was ‘full’.
The U.S. Dollar has risen for the past 5 weeks against most pairs.
The Yen was also firmer.
The AUD/CAD, AUD/USD and AUD/INR have declined for 5 consecutive weeks. The CAD/USD has done the same.
The AUD/GBP and the AUD/SGD has fallen for 6 weeks in a row.
The EUR/GBP has eased lower for its 6th straight week.
The larger advancers over the past week comprised of;
Rotterdam Coal 5%, Cocoa 7.2%, Cotton 3.3%, JKM LNG 1.8%, Newcastle Coal 2.4%, Orange Juice 20.3%, Dutch TTF Gas 4%, Uranium 6%, Gold AUD 2.1%, Oats 2.2%, Rice 2.5%, DJ Industrials 1.4%, Indonesia 3.5%, KOSPI 5.5%, Mexico 2.4%, NIFTY 2.4%, Sensex 2%, Nasdaq Transports 2.3%, BIST 100 3.8%, ASX 200 1.9% and the ASX Small Caps rose 2.5%.
For some reference, the Nasdaq Composite and the S&P 500 rose 1.1% and 1.4% respectively.
The group of largest decliners from the week included;
Australian Coking Coal (5%), Bloomberg Commodity Index (2.1%), Baltic Dry Index (7.3%), China Coking Coal (5%), WTI Crude (7.4%), Iron Ore (5.4%), Heating Oil (5.5%), Lumber (3.4%), Lithium (12.4%), Natural Gas (4.4%), Nickel (3.4%), Platinum (2.1%), Gasoline (7.7%), S&P GSCI (3.8%), Brent Crude (6.9%), Gasoil (2.6%), Soybean (1.7%), Shanghai (6.2%), CSI 300 (4.6%), KBW Banking Index (1.7%), China A50 (4.4%), HSCEI (2.6%), Hang Seng (2.6%), KRE Regional Bank Index (7.2%), Oslo (1.7%), Helsinki (2.3%), S&P SmallCap Value (2%) and Switzerland’s fell 1.3%.
For some reference, the S&P Small Cap 600 fell 1.2%, the Russell 2000 declined 1%, the SOX closed 0.1% lower and Toronto’s TSX eased 0.2% for the week.
While I don’t care about what an athlete is paid to execute their sporting obligations, I wonder if Mercedes Benz sells less AMG (performance) vehicles and Ferrari sells more, in light of Lewis Hamilton’s decision to change employers?
Below is an image of Lewis Hamilton featuring in a #marketing campaign to sell the 2024 Mercedes GT Coupe.
Nike may have sold more golfing apparel due to Tiger Woods modelling their wares, but they may not suffer now that their mutual association has ended.
The wedding announcement and subsequent marriage is fruitful while the divorce may not have a meaningful impact.
Many people offering investment advice are very good at telling you when to ‘buy’ and not so proficient when to ‘sell’.
More importantly, how about telling you when to ‘hide’ and ‘stay away’??
‘Noise’ in the absence of research and analysis is costing investors a lot of money.
Remember the ‘buying’ hype around;
Buy Now, Pay Later companies,
Non-Fungible Tokens (NFT’s),
Neo-Banks,
Copper and electrification,
anything else involving renewable energy
and food shortages and freezing Europeans (due to the Ukraine invasion, “they” were buying Wheat, Fertilizer and Natural Gas)
16 years ago it was hype surrounding CDO/CLO (sub-prime) investment opportunities.
Today, it’s Private Credit…..
and it could be East Coast Australian real estate……
and possibly the Magnificent 7 stocks of the Nasdaq….??
Avoiding losses and carnage doesn’t show up in any of your investment performance but for others, creating the feeling that you need to participate in something new or re-invented does help the promoter or seller either make a market or a dollar.