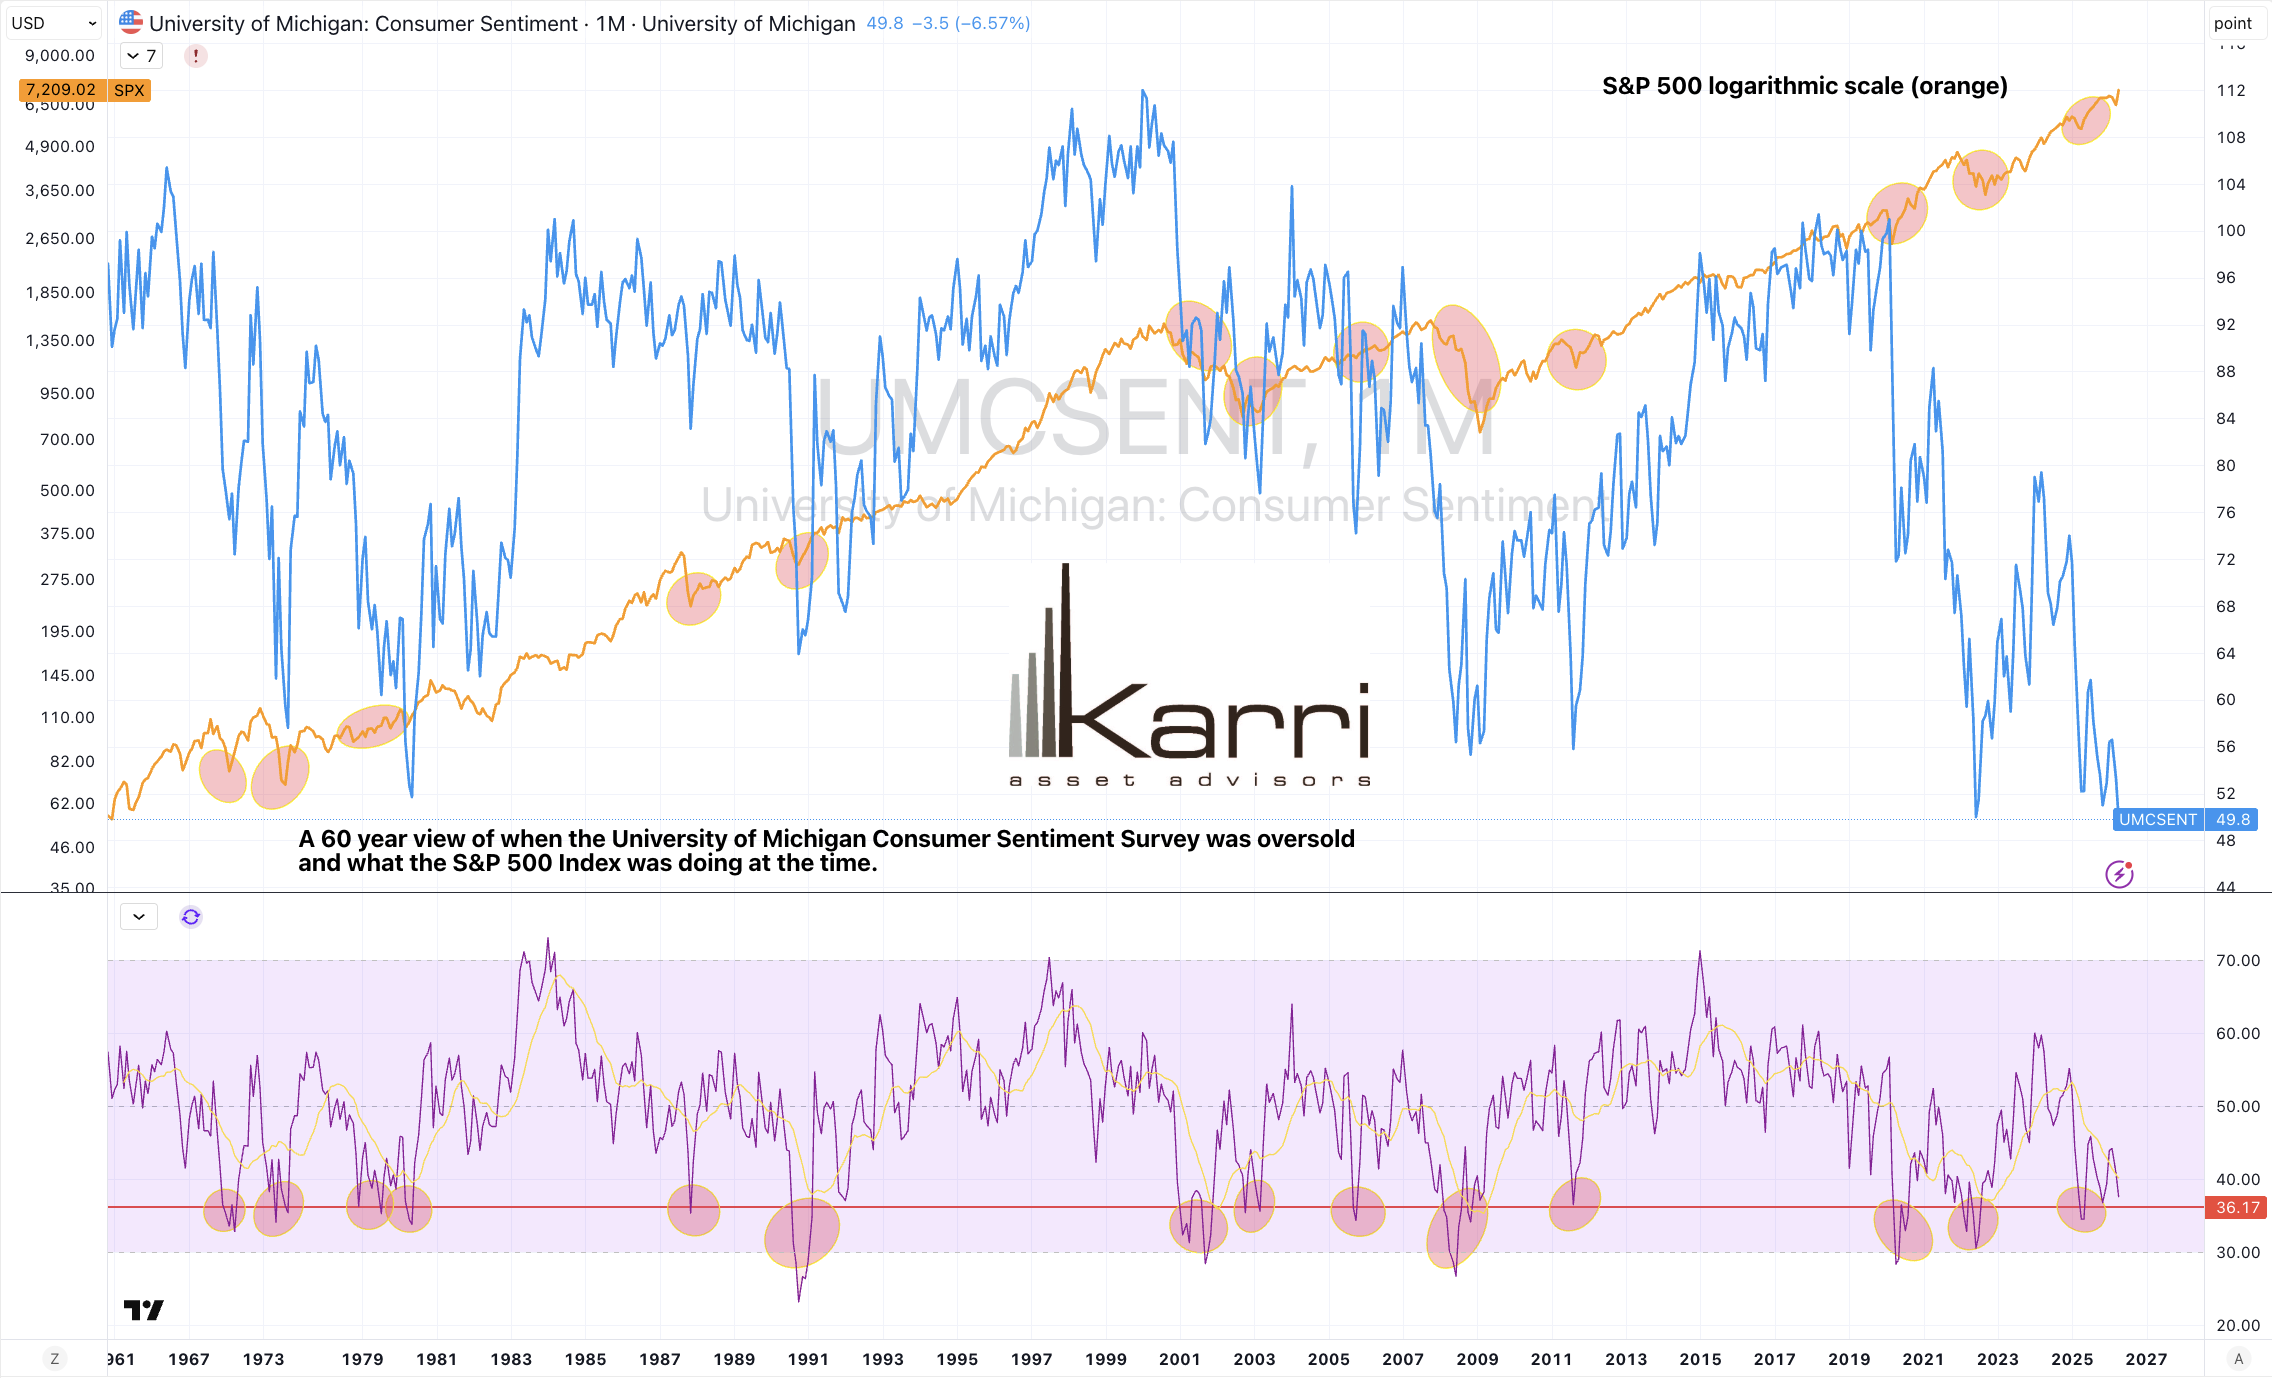
60 year view of maximum pessimism
May 23, 2026 Leave a comment
The nominal figure is one thing when viewing the Univ. of Michigan Consumer Sentiment Survey.
rob@karriasset.com.au
May 23, 2026
Trying to hear what's not being said
May 23, 2026 Leave a comment
The nominal figure is one thing when viewing the Univ. of Michigan Consumer Sentiment Survey.
rob@karriasset.com.au
May 23, 2026
May 20, 2026 Leave a comment
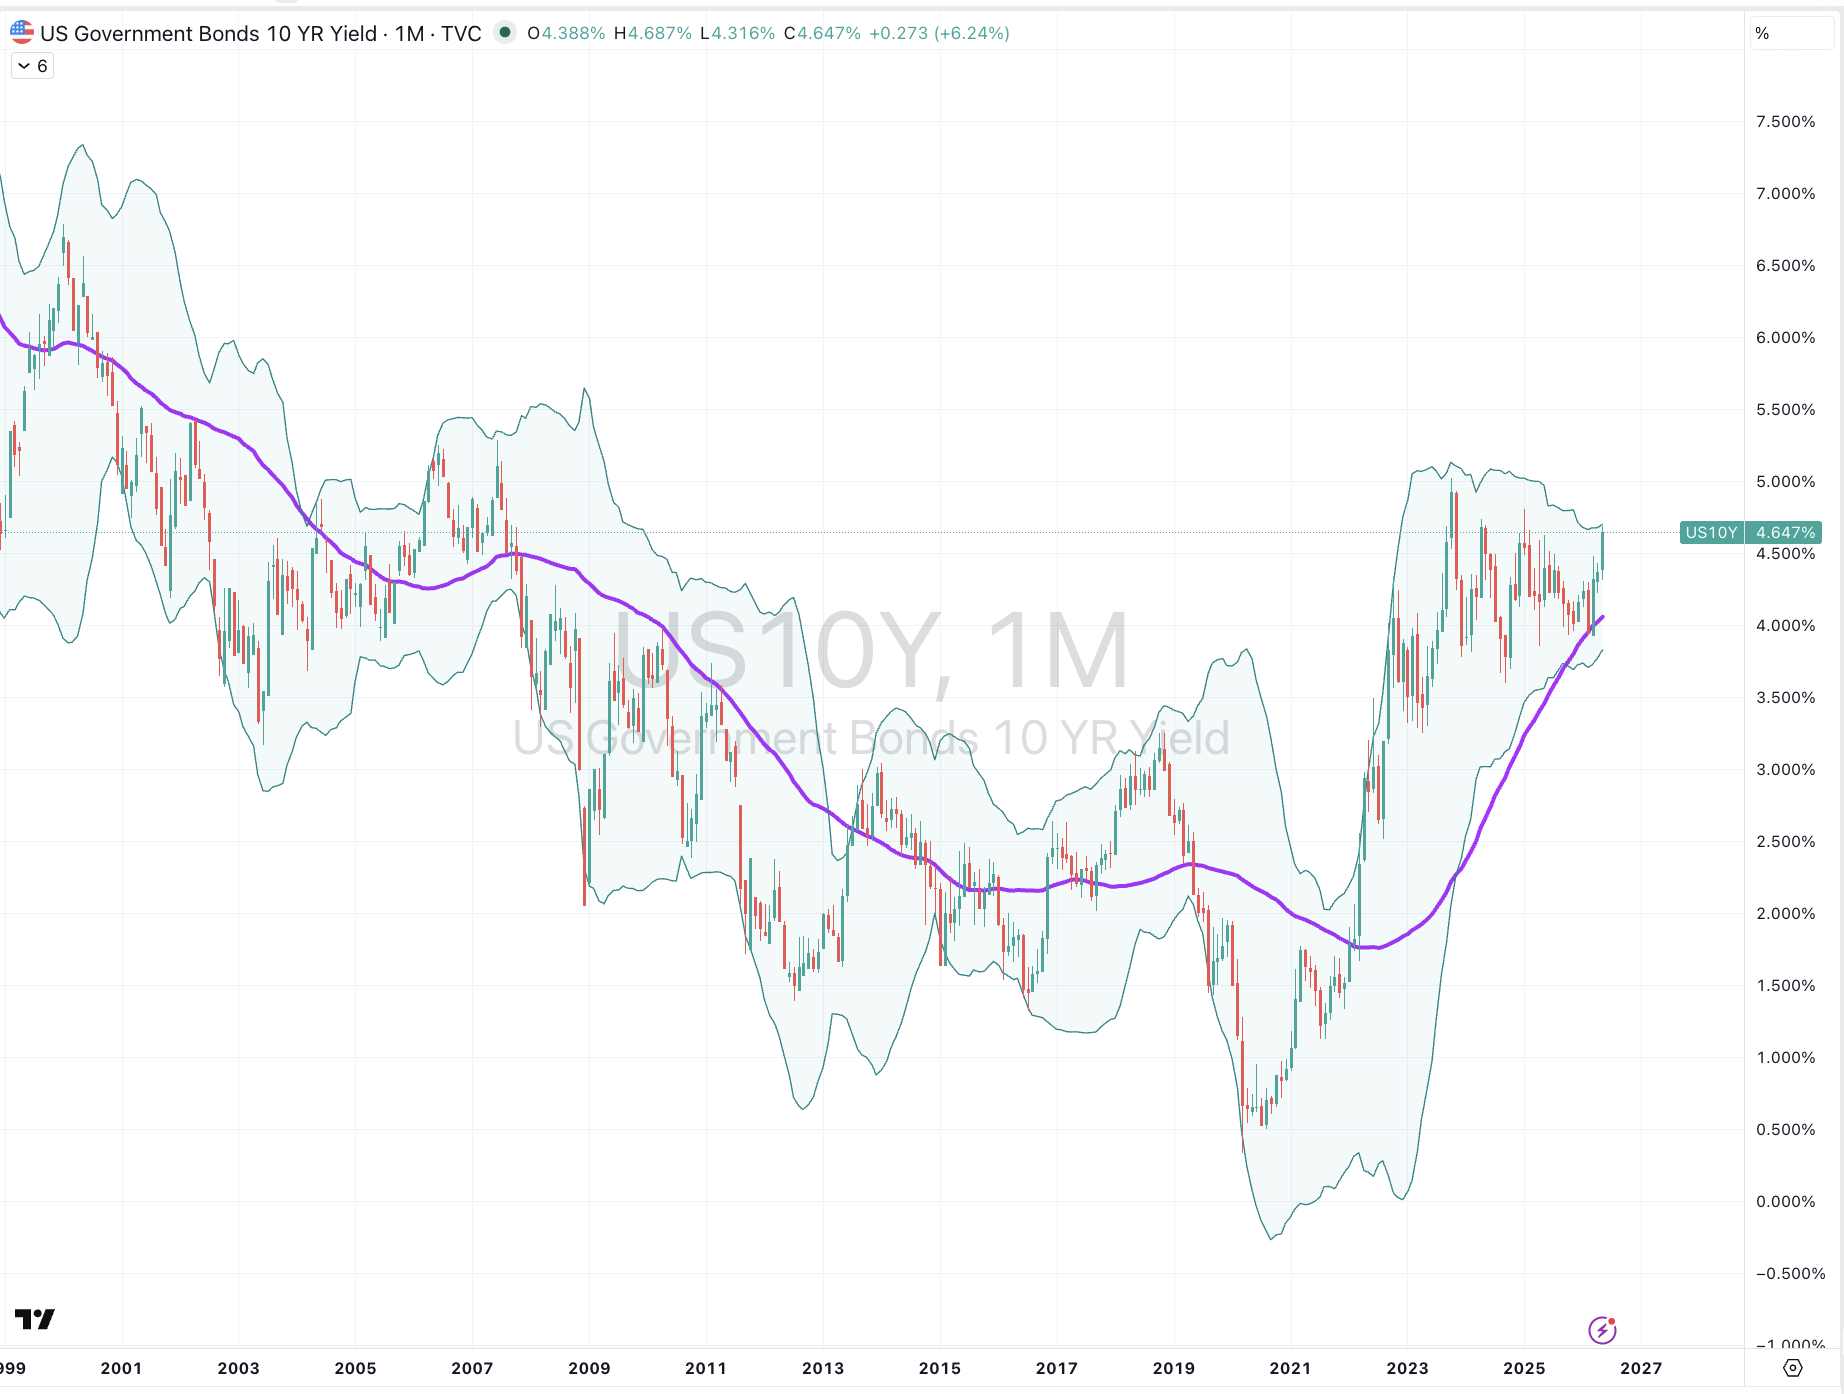
Momentarily, the ‘lofty’ levels of global bond yields are in the news,
but I say, ‘momentarily’, this is temporary as they are nearly trading at various extremes,
suggesting they ease lower,
this will give tech stock investors a chance to ‘get out of jail’,
should they take that opportunity,
although later, the longer bond yields are close to doing something not seen since the mid 1960’s.
May 20, 2026
May 17, 2026 Leave a comment
A weekly Macro, Cross Asset review of prices trading at extremes which may generate future investment ideas and opportunities.
The following assets (on a weekly timeframe) either registered an Overbought or Oversold reading and/or have traded more than 2.5 standard deviations above or below its rolling mean.
n.b. pricing of (commodity) futures contracts is only considering the immediate front month.
* denotes multiple week inclusion
Extremes above the Mean (at least 2.5 standard deviations)
Norwegian 10-year yield
German 30-year bond yield
U.S. 5-, 7-, 10- and 30-year government bond yields *
U.S. 5 year minus U.S. 3-month yield spread *
Copper/Gold Ratio
TBT & TBX
Copper
Shanghai Rebar *
Rice
Wheat
Overbought (RSI > 70)
Australia & Japanese 2-year government bond yields
Australian Coking Coal *
Richards Bay Coal
Bloomberg Commodity Index *
Brent Crude Oil
Heating Oil
JKM LNG
Gasoline *
China Iron Ore *
Rubber *
CRB Index *
Urea Middle East *
AUD/CHF *
AUD/EUR
AUD/GBP *
AUD/IDR *
AUD/INR *
AUD/JPY *
AUD/SGD *
AUD/THB *
CNH/USD
CSI 300
China A50 Index
Egypt’s EGX Index *
TAIEX *
Nasdaq Composite
And the S&P 500
The Overbought Quinella (Both Overbought and Traded at > 2.5 standard deviations above the weekly mean)
Japanese 5, 10 and 30-year government bond yields
South Korean 10 year bond yield
Baltic Dry Index
KOSPI *
Nasdaq 100 *
Philadelphia’s SOX Index *
Extremes below the Mean (at least 2.5 standard deviations)
None
Oversold (RSI < 30)
North European Hot Rolled Coil Steel
NZD/AUD *
IDR/USD *
INR/USD *
The Oversold Quinella (Both Oversold and Traded at < 2.5 standard deviations below the weekly mean)
TLT
Notes & Ideas:
Government bond yields rose.
Korean 10-year yields have risen for 5 weeks.
And the Copper/Gold Ratio have risen for 6 straight weeks.
Equities mostly eased.
A few indices left overbought territory.
Many other winning streaks of 5, 6 and 7 weeks were snapped.
The remaining are the S&P 500 at 7 and Vietnam is at 8 weeks.
Inversely, the CAC, DJ Transports, IGPA and ASX small caps have fallen for 4 weeks.
While Brazil’s BOVESPA has declined 11% over the past 5 weeks.
Commodities were mixed.
Crude Oil, Gases, Distillates, Oats, Rice and Wheat were the notable gainers.
Cocoa, Cotton, Orange Juice, Tin, Precious Metals and Corn were amongst the decliners.
Aluminium, Cotton and U.S. Gulf Urea left overbought territory.
Shanghai Rebar has risen for 4 weeks.
Australian Coking Coal is in a 5-week winning streak.
The Baltic Dry Index has risen for 7 weeks.
And Palladium mean reverted.
Currencies were quieter.
The Aussie mostly fell.
AUD/USD & BRL/USD dropped out from being overbought.
The latter fell and snapped 8 weeks of advance.
Aussie/Rupee has climbed for 6 weeks.
The Aussie has risen for 7 weeks against the Euro.
The USD saw strength.
While the GBP fell.
The larger advancers over the past week comprised of;
Aluminium 1.7%, Bloomberg Commodity Index 1.8%, Brent Crude 7.9%, Baltic Dry Index 5.8%, WTI Crude 10.8%, Heating Oil 5.8%, JKM LNG 5.4%, Cattle 2%, JKM LNG in Yen 6.9%, Natural Gas 7.4%, Gasoline 5.4%, S&P GSCI 2.6%, CRB Index 2.5%, Dutch TTF Gas 13.7%, Gasoil 2.7%, Oats 4.5%, Rice 3.4%, Wheat 2.7%, OBX 2.4% and ASX Materials Index rose 1.8%.
The group of largest decliners for the week included;
Cocoa (4.3%), Cotton (4.9%), Palm Oil (1.9%), Arabica Coffee (2.9%), Nickel (2.2%), Orange Juice (10.2%), Palladium (4.1%), Platinum (3.3%), Tin (3.1%), Urea U.S. Gulf (2.9%), Urea Middle East (1.8%), Silver in AUD (4.1%), Silver in USD (5.4%), Gold in AUD (2.4%), Gold in CAD (3.2%), Gold in CHF (2.4%), Gold in EUR (2.4%), Gold in USD (3.7%), Corn (3.3%), Soybeans (2.6%), All World Developed ex USA (1.6%), KBW Banks (1.8%), BUX (2.1%), CAC (2%), IDX (3.5%), DAX (1.6%), DFM (3.3%), FCATC (2.5%), HSCEI (2.2%), Hang Seng (1.6%), IBB (1.8%), IBEX (1.5%), Bovespa (3.7%), S&P SmallCap 600 (3.2%), Dublin (2.6%), Russell 2000 (2.3%), Kre Regional Banks (4.1%), KSE (3.2%), S&P Midcap 400 (2.4%), Mexico (2.7%), NBI (1.7%), Nikkei 225 (2.1%), Nifty (2.2%), SA40 (3%), Sensex (2.7%), IGPA (2.9%), SOX (1.6%), TA35 (2.9%), Nasdaq Transports (2.1%), XBI (3%), BIST (4.6%) and ASX Financials fell 4.3%.
May 17 2026
By Rob Zdravevski
rob@karriasset.com.au
May 10, 2026 Leave a comment
A weekly Macro, Cross Asset review of prices trading at extremes which may generate future investment ideas and opportunities.
The following assets (on a weekly timeframe) either registered an Overbought or Oversold reading and/or have traded more than 2.5 standard deviations above or below its rolling mean.
n.b. pricing of (commodity) futures contracts is only considering the immediate front month.
* denotes multiple week inclusion
Extremes above the Mean (at least 2.5 standard deviations)
U.S. 3, 5 and 7 year government bond yields
U.S. 5 year minus U.S. 3 month yield spread
Shanghai Rebar
KLSE
Overbought (RSI > 70)
Japanese 5 & 10-year government bond yields
Australian Coking Coal
AUD/CAD
AUD/CHF *
AUD/GBP
AUD/IDR *
AUD/INR *
AUD/JPY *
AUD/SGD *
AUD/THB *
AUD/USD
BRL/USD *
USD/IDR *
Commodity Bloomberg Commodity Index *
Aluminium *
Cotton *
Gasoline *
China Iron Ore
Rubber *
CRB Index *
Urea (U.S. Gulf and Middle East) *
BUX equity index *
Egypt’s EGX Index *
Russell 2000
Nikkei 225
S&P 500
Israel’s TA-35
And Türkiye’s BIST Index
The Overbought Quinella (Both Overbought and Traded at > 2.5 standard deviations above the weekly mean)
Baltic Dry Index
TAIEX *
Nasdaq Composite
KOSPI *
Nasdaq 100
Philadelphia’s SOX Index *
Extremes below the Mean (at least 2.5 standard deviations)
None
Oversold (RSI < 30)
CAD/AUD
CHF/AUD *
EUR/AUD *
JPY/AUD *
NZD/AUD *
USD/CNH *
USD/BRL *
The Oversold Quinella (Both Oversold and Traded at < 2.5 standard deviations below the weekly mean)
None
Notes & Ideas:
Government bond yield fell.
Korean 10-year yields have risen for 4 weeks.
The Copper/Gold Ratio have risen for 5 straight weeks.
And the Chinese 10-year yields rose and snapped 4 weeks of decline.
Equities moved higher.
The big news in equities is the Russell 200, Nikkei 225, S&P 500, the Nasdaq Composite and Nasdaq 100 join the overbought list.
Shanghai Composite, CSI 300 and the KOSPI are in a 5-week winning streak.
The China A50, Nasdaq Composite, Nasdaq 100, SOX and S&P 500 have closed higher for 6 straight weeks.
The S&P SmallCap 600, Russell 2000 and Vietnam’s VN Index have climbed for 7 consecutive weeks.
While Brazil’s BOVESPA has declined for the past 4 weeks.
Commodities were mixed.
Coal, Cocoa, Copper, Lithium, Tin, Silver and Rice were the notable gainers.
Crude Oil, Gases, Distillates, Nickel, Coffee, Urea and Wheat were amongst the decliners.
Cattle, Heating Oil, Gasoil & Wheat left overbought territory.
Australian Coking Coal is in a 4-week winning streak.
Iron Ore fell and broke a 4 week winning run .
The Baltic Dry Index has risen for 6 weeks.
And the Middle East Urea price fell and snapped 11 consecutive weeks of advance.
Currencies were busy, again.
News in currencies was the AUD/USD reaching an overbought extreme.
Aussie/Rupee has climbed for 5 weeks.
The Aussie has risen for 6 weeks against the Euro, Rupiah and Singapore Dollar.
The CAD/USD fell and broke its 4 week winning run.
BRL/USD has climbed for 8 weeks.
While the CAD/USD and AUD/THB fell and snapped winning streaks.
The larger advancers over the past week comprised of;
Richards Bay Coal 2.7%, Baltic Dry Index 9.1%, Cocoa 16.3%, Copper 5.2%, Lithium Carbonate 8%, Lithium Hydroxide 7%, Tin 9.3%, Platinum 2.4%, Iron Ore China 2.9%, Silver in AUD 6%, Silver in USD 6.6%, Gold in AUD 1.6%, Gold in CAD 2.8%, Gold in EUR 1.7%, Gold in GBP 1.8%, Gold in USD 2.2%, Rice 8.2%, Shanghai 1.7%, All World Developed ex USA 2.1% ATX 1.5%, DFMM 2.4%, EGX 3.6%, FCATC 6.9%, MIB 2.2%, Hang Seng 2.4%, IBB 1.6%, Russell 2000 1.8%, TAIEX 6.9%, Nasdaq Composite 4.5%, KLSE 1.7%, KSE 5%, KOSPI 13.6%, FTSE 250 1.4%, S&P Midcap 400 1.6%, Mexico 2.9%, NBII 2.2%, Nasdaq 100 5.5%, Nikkei 225 5.4%, PSE 2.2%, SA40 2.7%, SOX 11.1%, S&P 500 2.3%, TA35 2%, BIST 4.3%, Vietnam 3.3%, XBI 3.3% and the ASX Materials rose 4.3%.
The group of largest decliners for the week included;
Brent Crude (6.4%), WTI Crude (6.4%), Lean Hogs (2.6%), Arabica Coffee (4.1%), Cattle (1.6%), LNG JKM in Yen (3.3%), Newcastle Coal (2.3%), Nickel (2.6%), Orange Juice (3.2%), Palladium (3.8%), Gasoline (1.9%), Sugar (1.7%), S&P GSCI (3.7%), Dutch TTF Gas (3.6%), Urea (4.4%), Gasoil (8.2%), Corn (1.9%), Wheat (2.9%), KBW Bank Index (1.9%), DJ Transports (1.9%), OBX (2.4%), Helsinki (1.4%) and Filipino PSI fell 1.9%.
May 10 2026
By Rob Zdravevski
rob@karriasset.com.au
May 7, 2026 Leave a comment
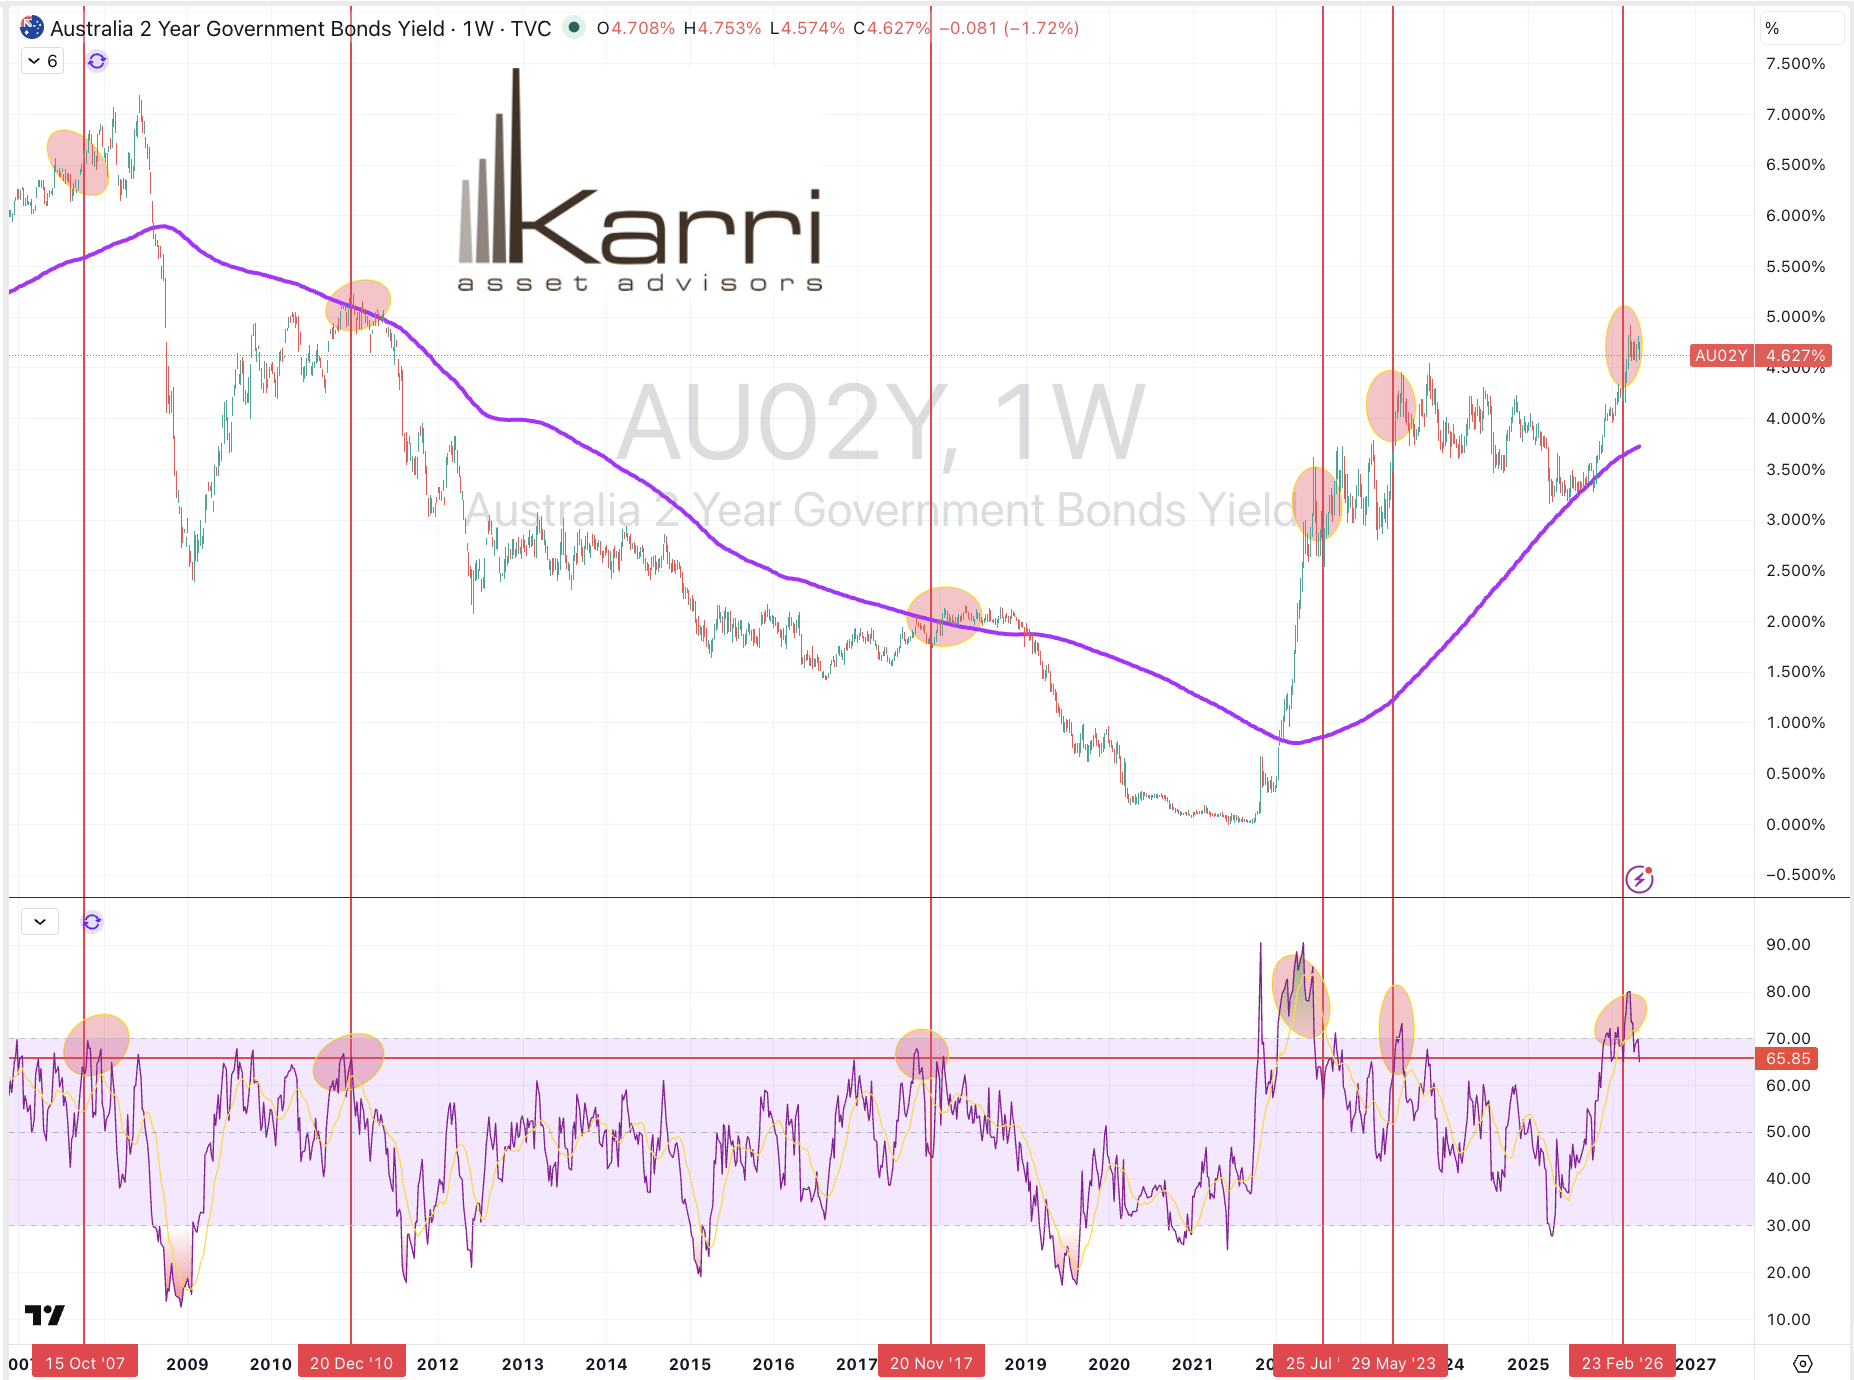
For holders of Australian Dollar cash or AUD borrowers, here are the 6 notable moments over the past 20 years when to either a) lock in your term deposits, b) let your interest rates on your borrowings ‘float’ and/or c) consider buying some bonds.
May 7, 2026
May 7, 2026 Leave a comment
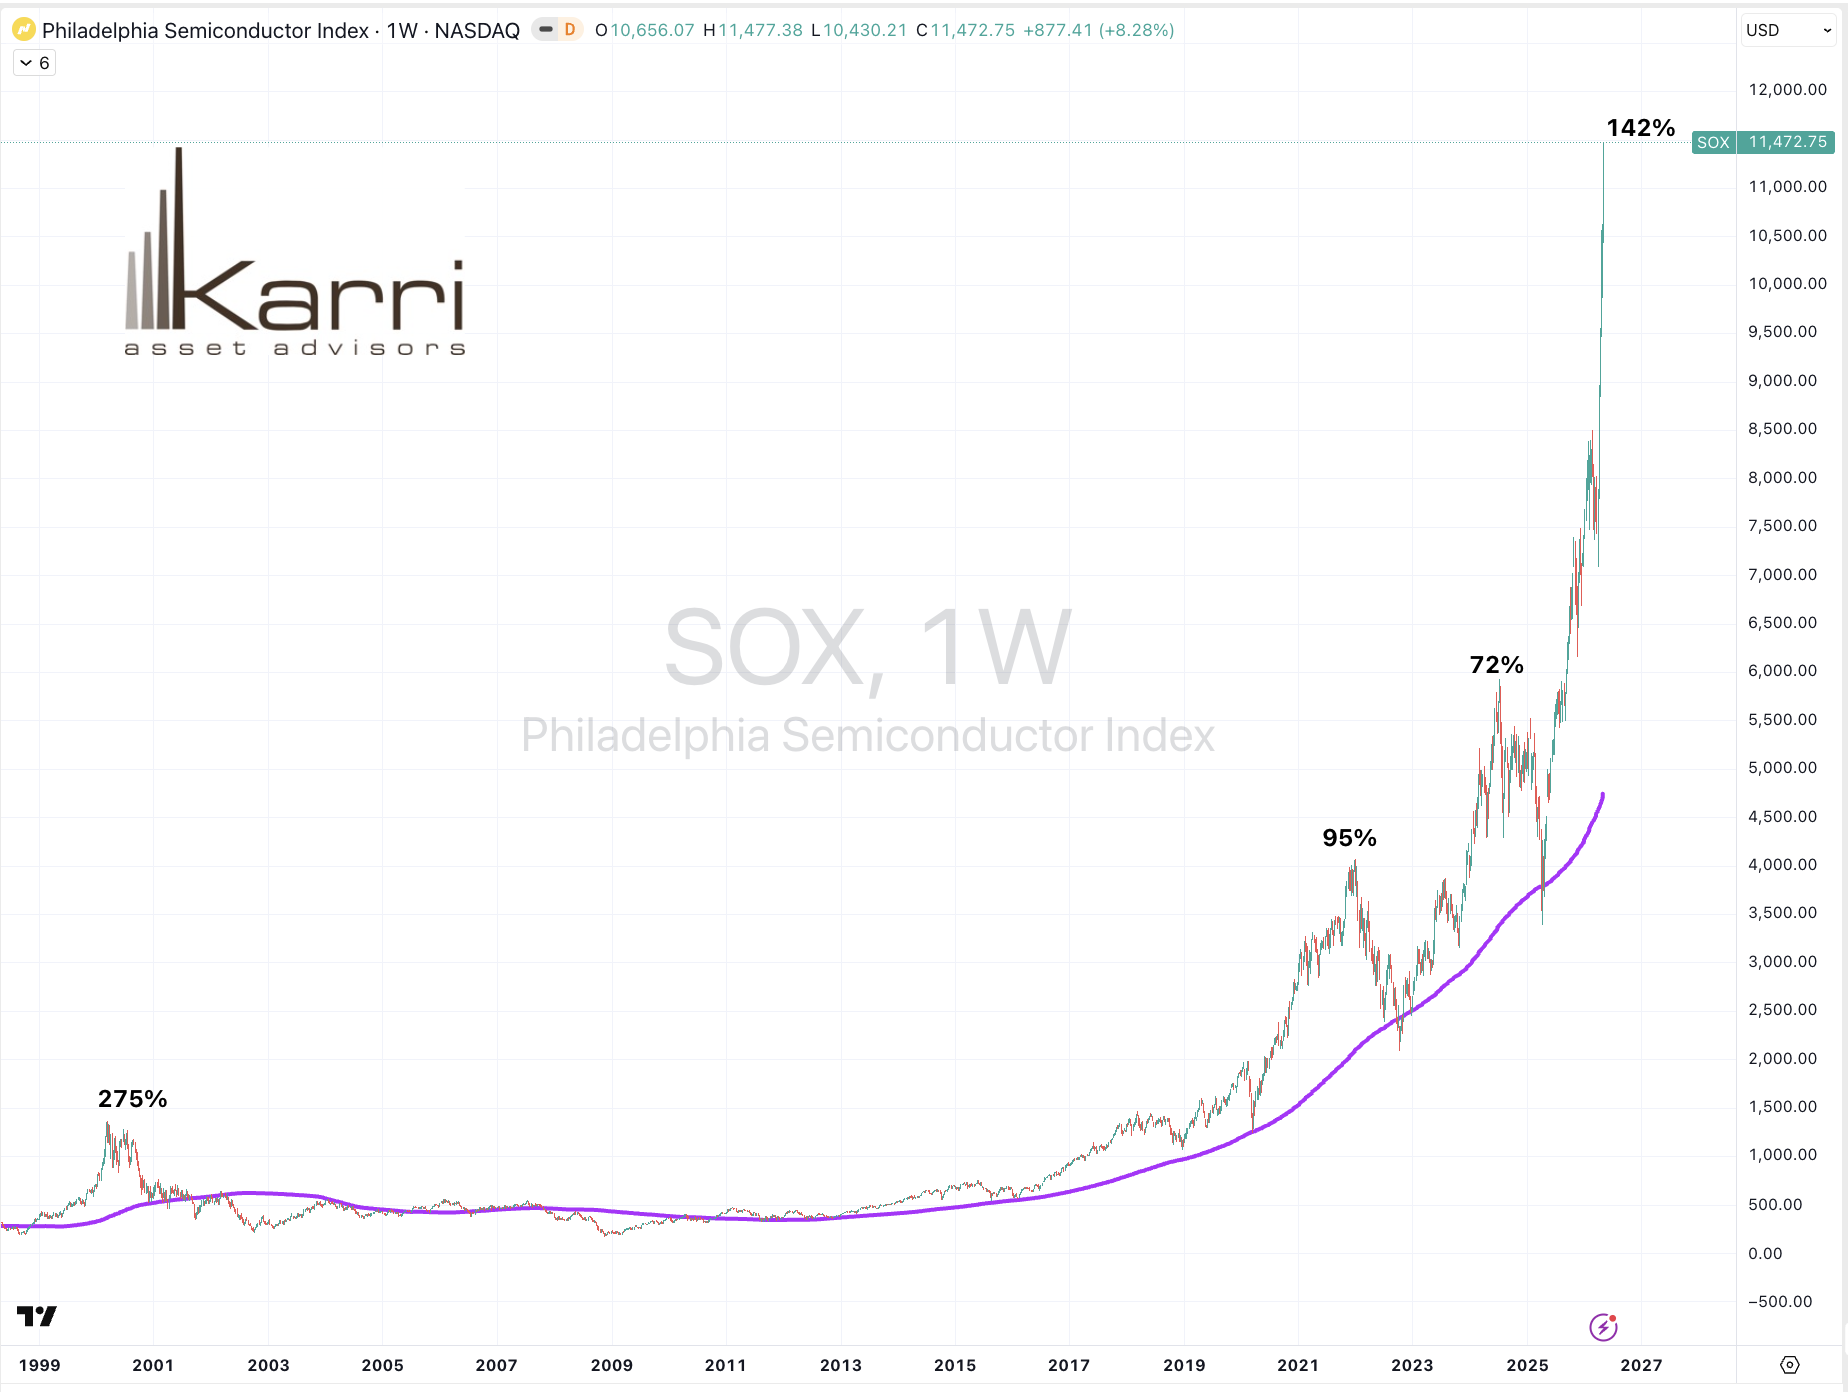
SOX Index is stretched but not as much as the late 1990’s
May 7, 2026 Leave a comment
WTI Crude Oil can’t make a ‘higher high’ and break below $77 in the +2 forward month, improves probability of $57 being seen……
and then, where will all the $150 and $200 per barrel call fade to?
May 7, 2026
May 3, 2026 Leave a comment
A weekly Macro, Cross Asset review of prices trading at extremes which may generate future investment ideas and opportunities.
The following assets (on a weekly timeframe) either registered an Overbought or Oversold reading and/or have traded more than 2.5 standard deviations above or below its rolling mean.
n.b. pricing of (commodity) futures contracts is only considering the immediate front month.
* denotes multiple week inclusion
Extremes above the Mean (at least 2.5 standard deviations)
U.S. 10-year breakeven inflation rate
Cattle
Wheat
Overbought (RSI > 70)
Australian and Japanese 2-year government bond yields
5 & 10-year Japanese bond yields
AUD/CHF
AUD/EUR
AUD/IDR *
AUD/INR
AUD/JPY *
AUD/SGD *
AUD/THB *
BRL/USD *
CNH/USD *
USD/IDR
Aluminium *
Commodity Bloomberg Commodity Index *
Heating Oil
Gasoline *
Rubber
CRB Index *
Urea (U.S. Gulf and Middle East) *
Gasoil *
BUX equity index *
Egypt’s EGX Index *
TAIEX *
KOSPI *
And Norway’s OBX
The Overbought Quinella (Both Overbought and Traded at > 2.5 standard deviations above the weekly mean)
Cotton *
Philadelphia’s SOX Index *
Extremes below the Mean (at least 2.5 standard deviations)
PHP/USD
Lumber
Oversold (RSI < 30)
Australian 10-year minus Aussie 2-year bond yield spread *
CHF/AUD *
EUR/AUD
JPY/AUD *
NZD/AUD *
USD/BRL
The Oversold Quinella (Both Oversold and Traded at < 2.5 standard deviations below the weekly mean)
None
Notes & Ideas:
Government bond rose again but did so, quietly.
U.S. inflation break-even rates climbed to ‘newer’ highs.
Therefore, the U.S. 10-year yield minus 10-year inflation breakeven rate spread rose and in doing do, snapped 4 weeks of decline.
The Chilean 10-2-year yield spread and the Copper/Gold Ratio have risen for 4 straight weeks.
And the Chinese 10-year yields have fallen for the past 4 weeks.
Equities were mixed in a quieter week.
Shanghai Composite, CSI 300 and the KOSPI are in a 4-week winning streak.
The China A50, Nasdaq Composite, Nasdaq 100, SOX and S&P 500 have closed higher for 5 straight weeks.
The S&P SmallCap 600, Russell 2000 and Vietnam’s VN Index have climbed for 6 consecutive weeks.
While Taiwan’s TAEIX is trading at nearly 100% above its 4-year mean.
Commodities firmed.
Coal, Oil, Cotton, Orange Juice, Gases, Sugar, Corn and Wheat were the notable gainers.
Aluminium, Tin, Coffee, Copper and Gold were amongst the decliners.
Iron Ore is in a 4-week winning streak.
The Gold Volatility Index rose and broke 4 weeks of decline.
Aluminium fell and broke its 5-week higher run.
While Rotterdam Coal rose and snapped 7 weeks of losses.
Gasoline has advanced 21% for the past 2 weeks.
Brent Crude Oil has soared 28% over the past fortnight.
AUD Gold price is seeing its lowest weekly RSI reading since October 2023.
And Middle East Urea prices have seen 11 consecutive advancing weeks.
Currencies were busy.
The Aussie has risen for 5 weeks against the Swissie, Euro, Rupiah and Singapore Dollar and its nearly overbought across a range of pairs.
The CAD/USD, GBP/EUR, GBP/USD and USD/IDR are also in 5-week winning streaks.
AUD/INR and the AUD/THB have climbed for 4 weeks.
The Loonie rose, again.
Yen was stronger.
COP/USD fell 3% and snapped a 7-week winning streak.
The Euro weakened, again.
BRL/USD has climbed for 7 weeks.
And the British Pound was mixed.
The larger advancers over the past week comprised of;
Richards Bay Coal 7.7%, Rotterdam Coal 3.5%, Bloomberg Commodity Index 3%, Baltic Dry Index 2.4%, Brent Crude Oil 9.1%, Cocoa 4.9%, WTI Crude Oil 8%, Cotton 6.2%, Heating Oil 4%, JKM LNG 1.9%, Cattle 3.2%, JKM LNG in Yen 2.5%, Lithium Carbonate 4.8%, Newcastle Coal 4.2%, Natural Gas 2.9%, Nickel 1.8%, Orange Juice 16.6%, Palladium 2.4%, Gasoline 8%, Sugar 6.8%, S&P GSCI 4.4%, Rubber 2.8%, CRB Index 3.8%, Dutch TTF Gas 2.1%, Gasoil 4%, Corn 3%, Oats 4.1%, Soybeans 2.1%, Wheat 3.4%, MIB 1.2%, Dublin 2.6%, KRE Regional Banks 1.4%, KOSPI 1.9%, Nasdaq 100 1.5%, OMX 1.6%, Lisbon 2.5%, SET 2.6%, TA35 1.4% and the ASX Industrials rose 1.5%.
The group of largest decliners for the week included;
Aluminium (2.2%), Copper (1.6%), Arabica Coffee (1.7%), Lumber (1.6%), Lithium Hydroxide (2.8%), Tin (3%), Robusta Coffee (3.4%), Gold in AUD (2.8%), Gold in CAD (2.6%), Gold in CHF (2.4%), Gold in GBP (2.4%), Gold in USD (2%), IDX (2.4%), DJ Transports (1.4%), IBB Biotech (1.5%), BOVESPA (1.8%), KSE (4.5%), Mexico (2%), NBI Biotech (1.7%), Stockholm (1.3%), PSE (1.8%), PX (2.4%), SA40 (1.5%), IGPA (2.2%), Nasdaq Transports (2.8%), XBI (2.2%) and Poland’s WIG Index fell 1.6%.
May 3 2026
By Rob Zdravevski
May 1, 2026 Leave a comment
My capex and free cash flow quip for the day is….
Microsoft has the operating cashflow to cover its capital expenditure plans.
Oracle hasn’t and less so when Oracle needs to borrow money to fund its proposed strategy.
And keep in mind that it’s Debt is already amounting to 4 times more than its EBIT.
But I wonder if those capex plans can really be ‘owned’ by ORCL’s when it’s the lender’s money providing it so.
While over that the other enterprise software giant (SAP), their EUR 20 billion capex plans are more so based around its ‘cloud offering, rather than an AI hyper-scaling race. Incidentally, they are spacing out this ‘spend’ over 20 years.
Easy-peasy when you’re cranking out operating cash flow of EUR 8 billion and have EUR 2 billion of net cash on the balance. I’m thinking “how wonderfully sensible and German!”.
Speaking of cash flow, Nvidia’s free cash flow of $84 billion equates to a free cash flow yield (FCF) of below 2%.
Salesforce.com and BP plc’s FCF yield is 10%.
April 30, 2026
April 30, 2026 Leave a comment
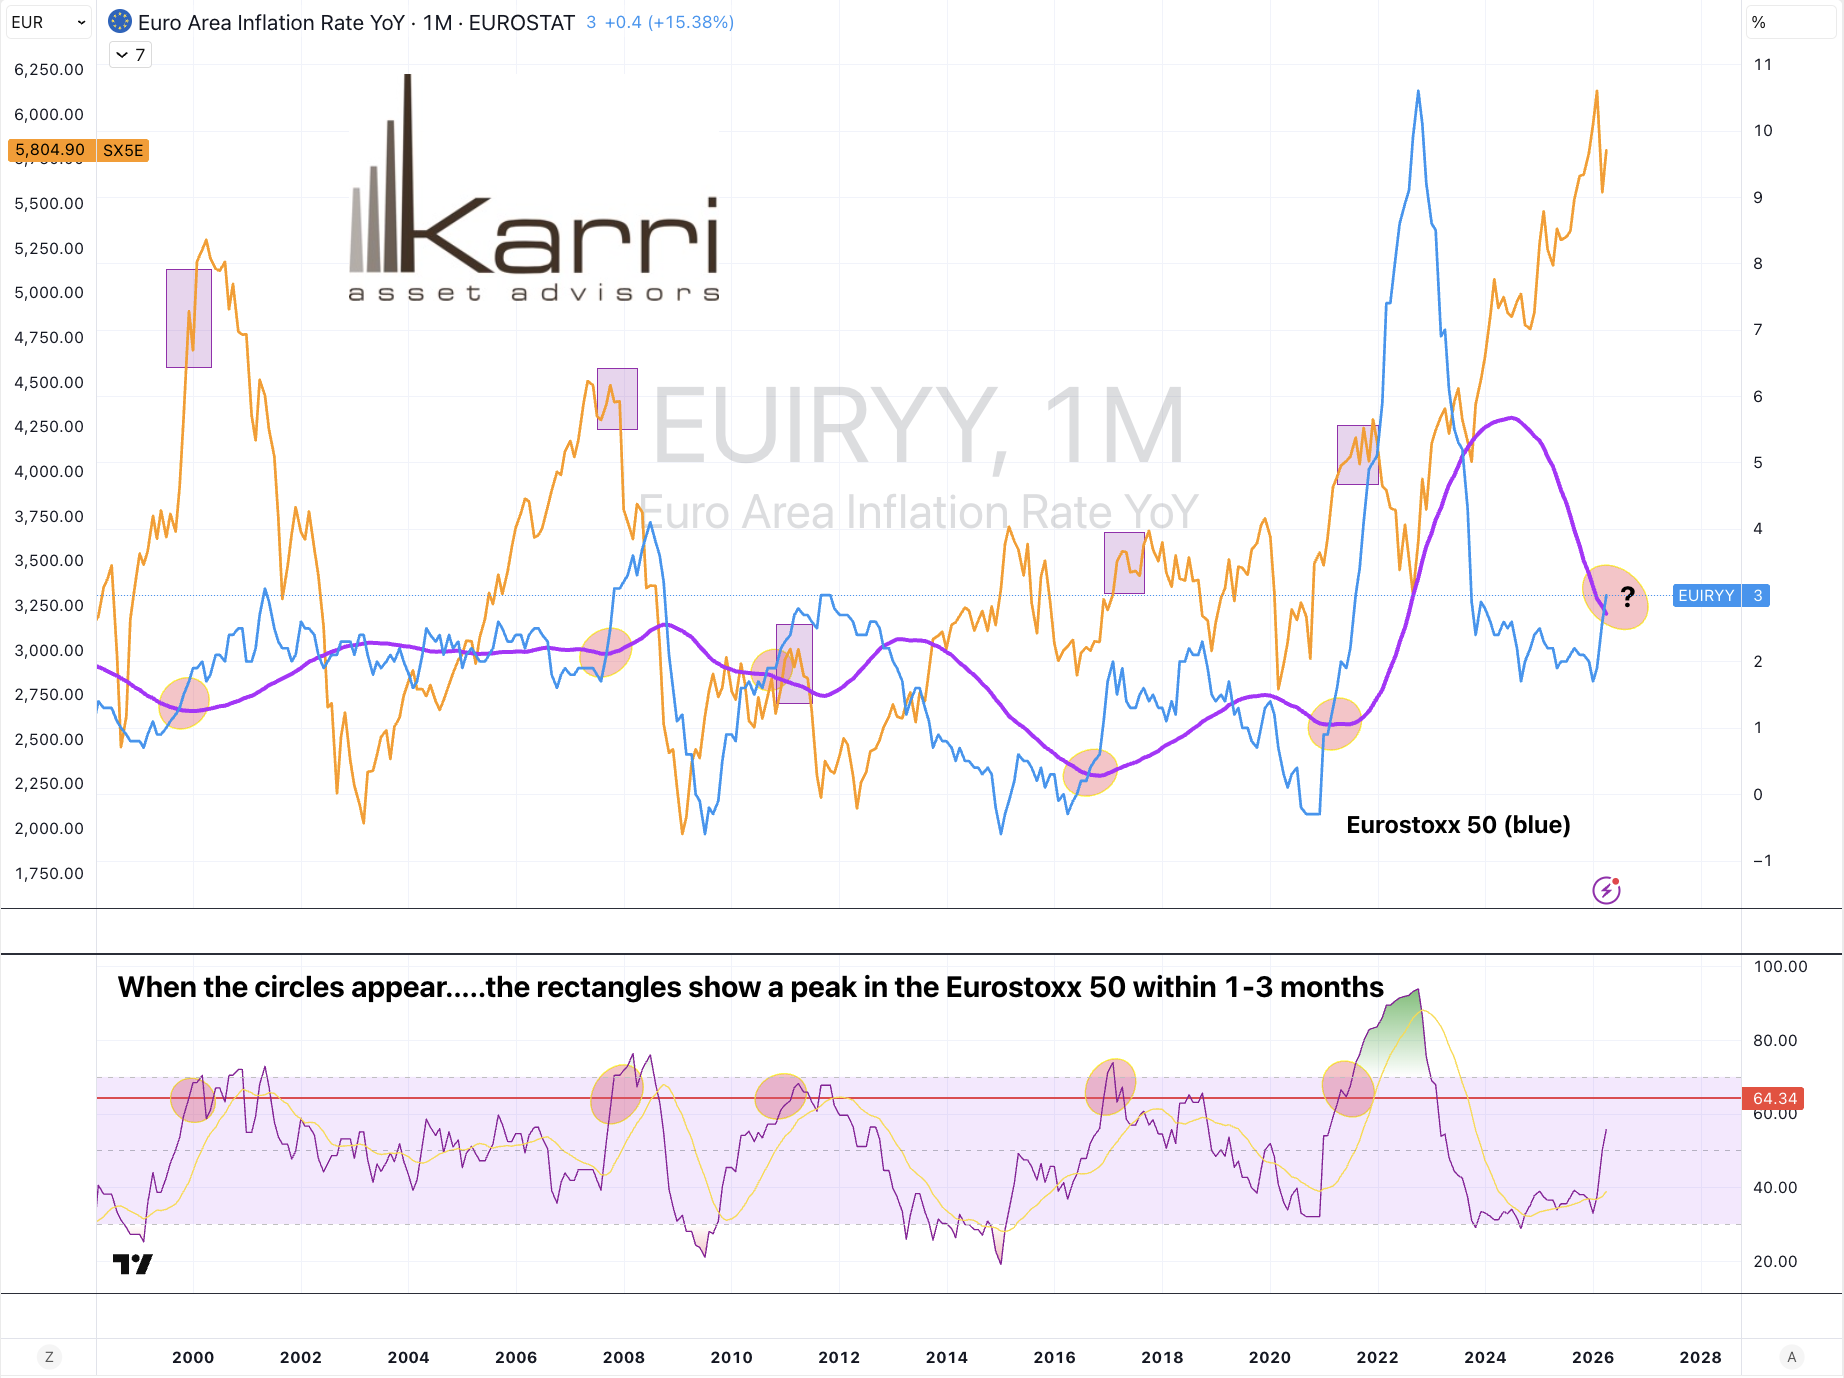
A small crack is developing but it’s only a hairline.
When the Euro Area inflation rate crosses above certain lines, the Eurostoxx 50 equity index sees a peak within a month or three.
April 30, 2026