We are being framed

Here is today’s example of poor business journalism.
I actually wouldn’t even call it journalism.

The article was published on Business Insider Australia’s website and sadly (for them) The Australian 🇦🇺 Financial Review re-printed it.

Since the headline quotes an AUD $113 billion market cap decline, I’ll stick with using Australian Dollars 🦘in this post.

So, that makes Apple’s 🍏 AUD market cap A$2.92 trillion. That’s Trillion….

Incidentally, that figure is A$1 trillion more than Australia’s annual GDP. 😳

By the close of today’s trading session, Apple’s share price declined 2.65%, which is only A$77 billion. It’s much more dramatic when the author picks the lowest price of the day to quote within the article.

Although in the previous day’s trade, Apple’s stock price SOARED 6.35%.

This was an approx. A$ 185 billion increase in market capitalisation….

It is possible that Apple’s stock price may have risen in positive anticipation of a new range of phones being released?

But I can’t seem to find any news article about the previous day’s bonanza ‘anywhere’.

The author hasn’t lied or misled but my community service message is to understand or question how stories are being ‘framed” for your consumption.

October 14, 2020
by Rob Zdravevski
rob@karriasset.com.au

Don’t be a greedy little piggy

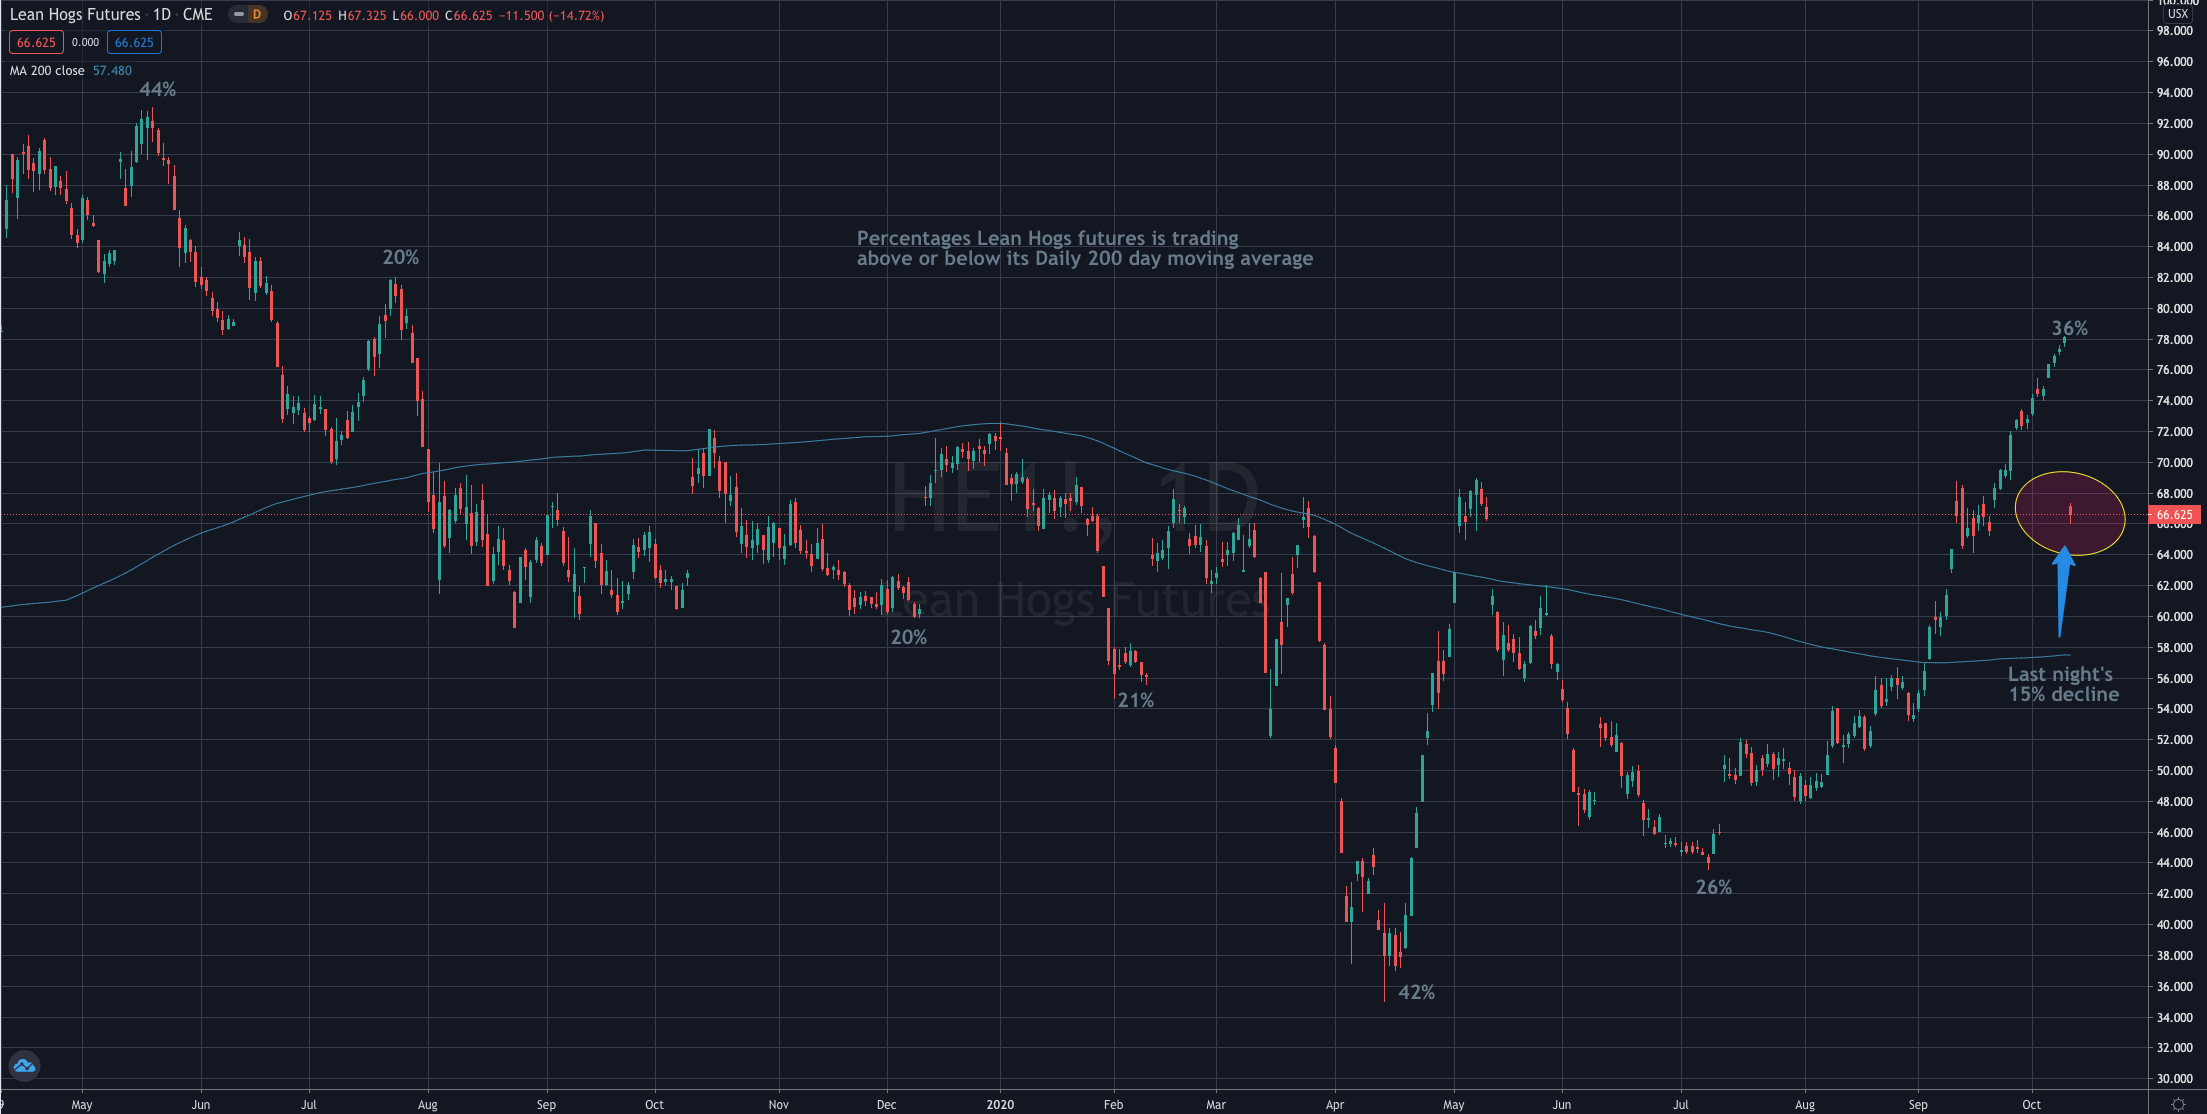
The price of Lean Hogs fell 15% yesterday.

It’s been a while since I traded this contract but similar to references I have made recently about extremes whether its been the Nasdaq or the Gold and Lumber prices…..

…is to expect a reversion when prices move to extended amounts of percentages either side of a mean.

In the daily chart below, you can see how the price of Lean Hogs tends to ‘re-visit’ its 200 day moving average with regular occurrence and especially when it trades greater than 20% beyond that line.

One needs to understand the probability of entering a new trade once this commodity has traded 20% or so beyond its 200 day moving average.

What sort of risk is being taken in order to squeeze out an extra 10% of return in a commodity which has a propensity of reverting quickly?

October 13, 2020
by Rob Zdravevski
rob@karriasset.com.au
Political Trade Destruction

Dear Australian #auspol politicians involved in incompetent trade and diplomatic rhetoric……it is in the “Chinese” tea leaves, that Iron Ore is next on the list of ‘sanctions’. I just wish the media would call them sanctions. It would sell so much more advertising…..

Politicians who are inexperienced in business and unable reading the geopolitical mood are causing more damage than their pea brains can possibly imagine.

Don’t they understand that a backbencher from an obscure political seat calling for an “inquiry into the origins of a Chinese flu” is a badly weighted bet and ramifications of the rebuttal can hardy be comprehended by someone inadequately positioned to speak in a manner within a nation’s parliament.

In these circumstances, political table-pounding seldom prevails over commercial reality and necessity.

Don’t look know, but to the complacent producers of current and future ‘sanctioned’ products, our politicians are doing some effective price mean reversion on behalf of your wallet.

October 13, 2020
by Rob Zdravevski
rob@karriasset.com.au

The longest bearish streak amongst retail investors in 30 years.

Each week, (for over 30 years) the American Association of Individual Investors conducts a simple survey amongst their members, asking if they are Bullish, Bearish or Neutral about the stockmarket over the next 6 months.

The pre-cursor article to this post can be found here.

I’ll argue that in moments of crisis or shock, the majority of respondents in such surveys are often on the wrong side of the market. In other words, when retail investors are “losing their heads”, they tend to take the opposite stance to the facts and then don’t change their mind until sentiment reaches the other end of the pendulum.

Today, this survey is experiencing its longest unbroken sentiment where bears have outnumbered the bulls, since July 1990. Back then, the bearish majority survey trend lasted 30 weeks (until February 1991) during which the S&P 500 rose approx. 15%.

The current bearish majority has been in force for 31 weeks (since the last day of February 2020) and the S&P has risen 40%.

Last week’s survey is the narrowest we have seen the bulls to becoming the majority in the weekly poll.

So, after a 40% return, we may start seeing more of the individual investors in the AAII Sentiment Survey, becoming bullish, than bearish.

Have a think about that for a moment.

October 12, 2020
by Rob Zdravevski
rob@karriasset.com.au
All taken too early…..

With news that one of our portfolio stocks, Link Administration (LNK.ASX) received a takeover bid (from Pacific Equity Partners and Carlyle Group) for A$2.8 billion, I am reinforced by the large amount of capital scouring the world for investment opportunities.

Link’s stock price rose 24% today.

This type of good news is often more frustrating that rewarding as it reminds me of the other ASX listed stocks (which client portfolios have owned) whom have been ‘taken’ far too young.

Some of those companies were SAI Global, Mantra Group, Goodman Fielder, Scottish Pacific, APN Outdoor, Healthscope, Toll Holdings and AWE.

After all, it is the business of private equity and the like, to buy companies ‘early’ to they can improve them (see ‘dress up’) and on-sell them either in a new IPO or as a trade sale.

Look out for some of these names re-appearing on the market in a coming IPO wave which I’ll call “re-equitisation”.

October 12, 2020
by Rob Zdravevski
rob@karriasset.com.au
Low Bitcoin volatility leads to a violent move

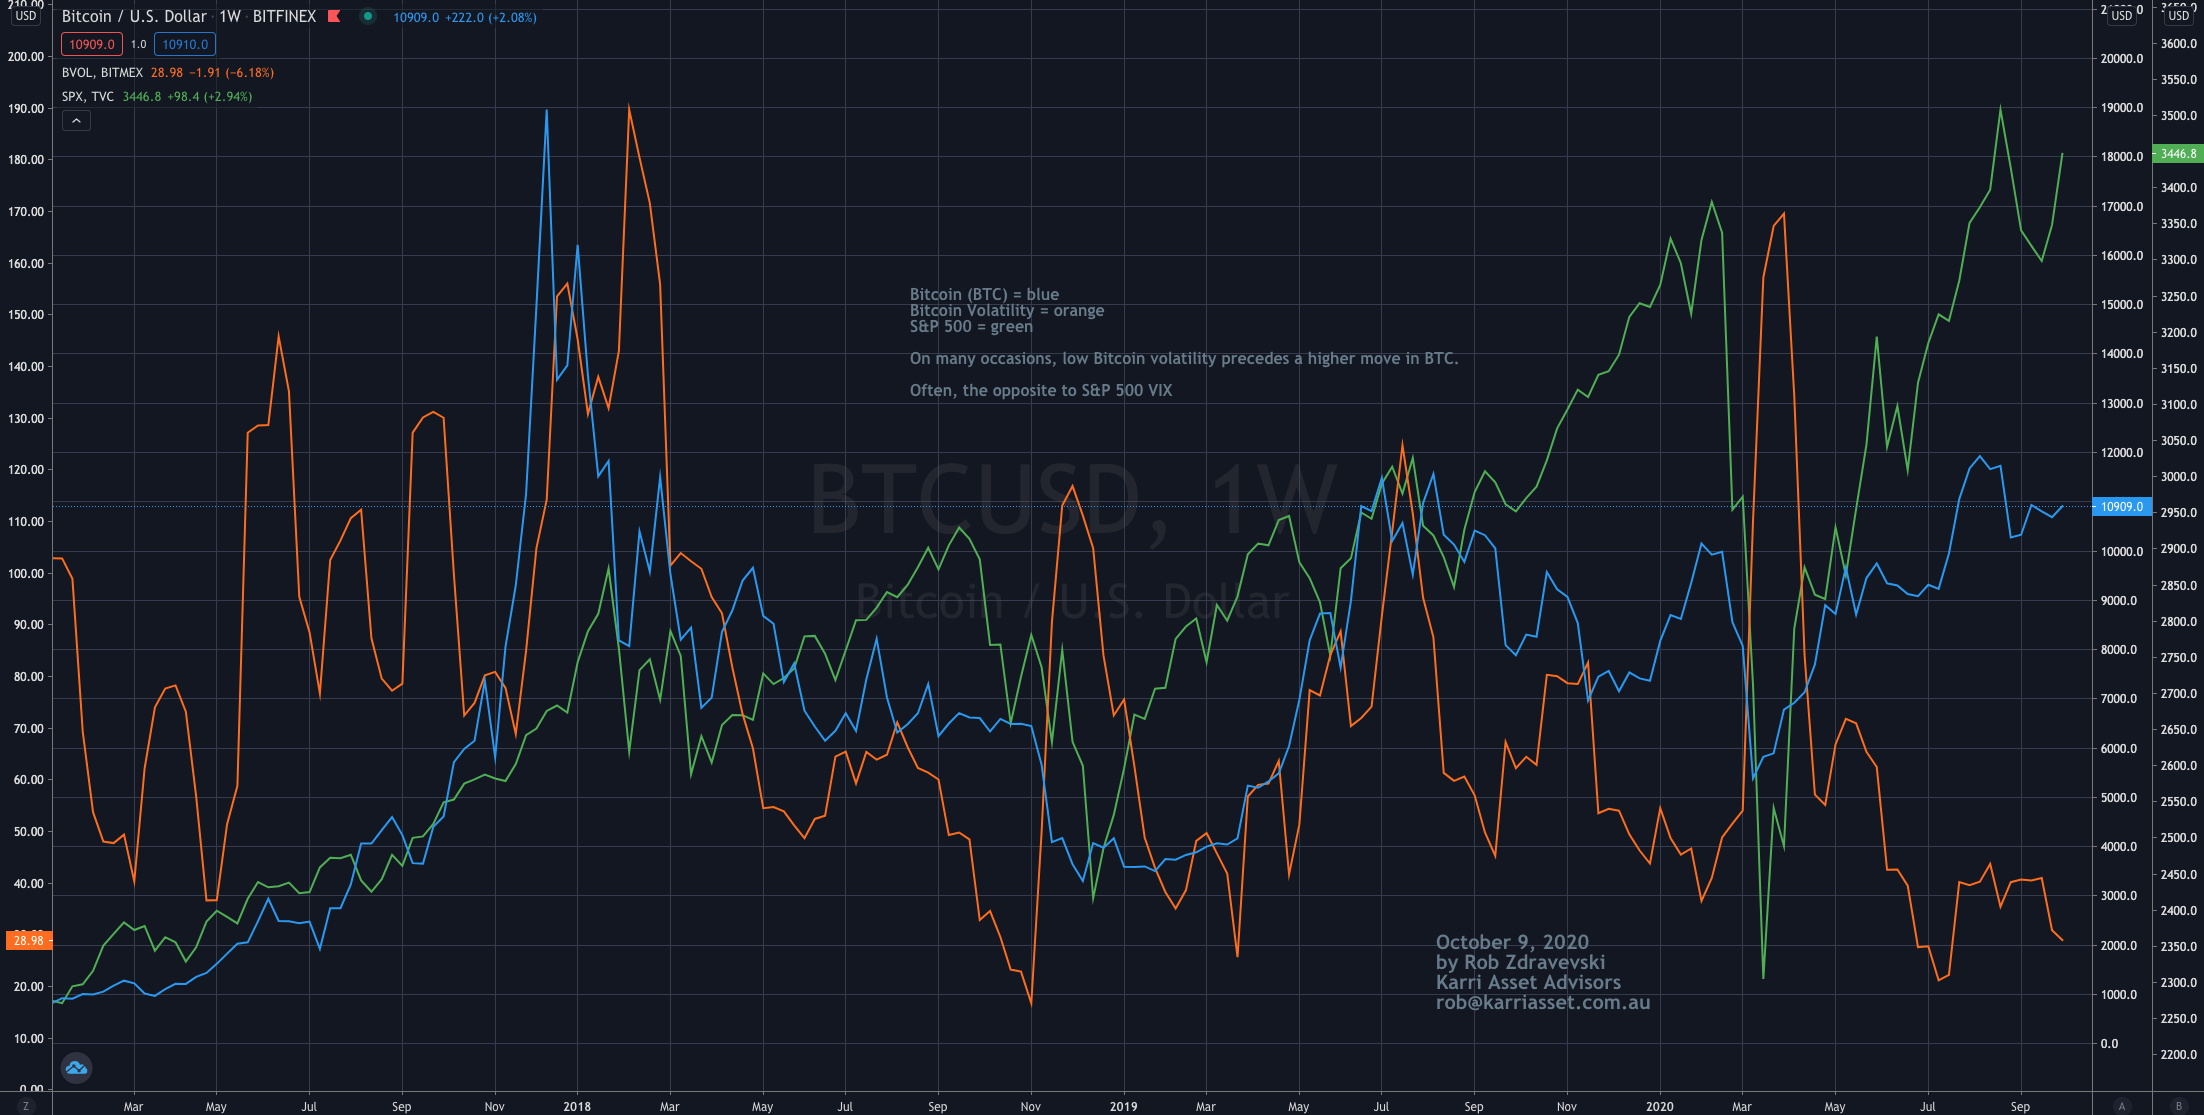
I am studying Bitcoin volatility and have found that the its 30 day historical volatility has fallen to its lowest level in my 10 years of data.

6 out of 7 times when its fallen to similar levels Bitcoin has rallied notably.

Last night, Bitcoin rose 3% or $300. It is currently trading at $10,878.

And Bitcoin’s correlation to the S&P 500 is ‘growing’.

The weekly chart below paints a clearer picture.

October 9, 2020
by Rob Zdravevski
rob@karriasset.com.au
Illustrating De-equitisation

In August 2020, there were 1,891 * companies listed on the Australian Stock Exchange (ASX), the lowest amount since May 2007.

Which is 7% less from the 2,026 record high of February 2018.

This figure would be drastically lower if we exclude over 200 ETF’s and 100 Listed Investment Companies (LIC’s).

And what if we consider the 1,324 listed entities (61% of the total*) with markets caps below $100 million ?

One-third (733) of the companies have market capitalisations below $25 million)

Incidentally, the lowest amount of companies listed over the past 18 years was 1,341 companies which was in March 2002, which is when my data ends.

The de-equitisation story is intact and made acute when an enormous amount of money is chasing fewer opportunities.

And Australia has the world’s 4th largest pension system with $2.1 trillion in savings.

Albeit, fiduciaries and managers in the superannuation world do allocate them globally, home currency bias and local currency obligations does favour a steady flow towards the ASX.

* there are 2,167 listed entities in total which includes foreign equity issuers including those comprising a stapled group along with wholesale & retail debt issuers.

October 9, 2020
by Rob Zdravevski
rob@karriasset.com.au

More Mid Cap happiness

My recent writings (publicly and separately to clients) about the Nasdaq being at extremes, the overweight (an over reliance) on the top 5-8 stocks in that index and investors paying for “growth or revenue at any price”, ultimately lead to commentary about allocating monies in mid cap stocks and especially as I stick with my bottom-up fundamental value and contrarian based investing style.

Whilst short-term news about relative outperformance and phrases involving “style or sector rotation” can irk me…

the S&P 400 Mid Cap and the Russell 2000 index have both soared 13.5% since their September 24, 2020 lows,

while the S&P 500 and the Nasdaq 100 have climbed 7.3% and 8.1% respectively.

Of course, we’ll take any of those returns any fortnight of the year,

but the movement of money away from expensive (growth with zero earnings) towards cheap (companies with actual profit) isn’t the most radical suggestion I have made.

October 9, 2020

by Rob Zdravevski

rob @karriasset.com.au

A good bounce for now

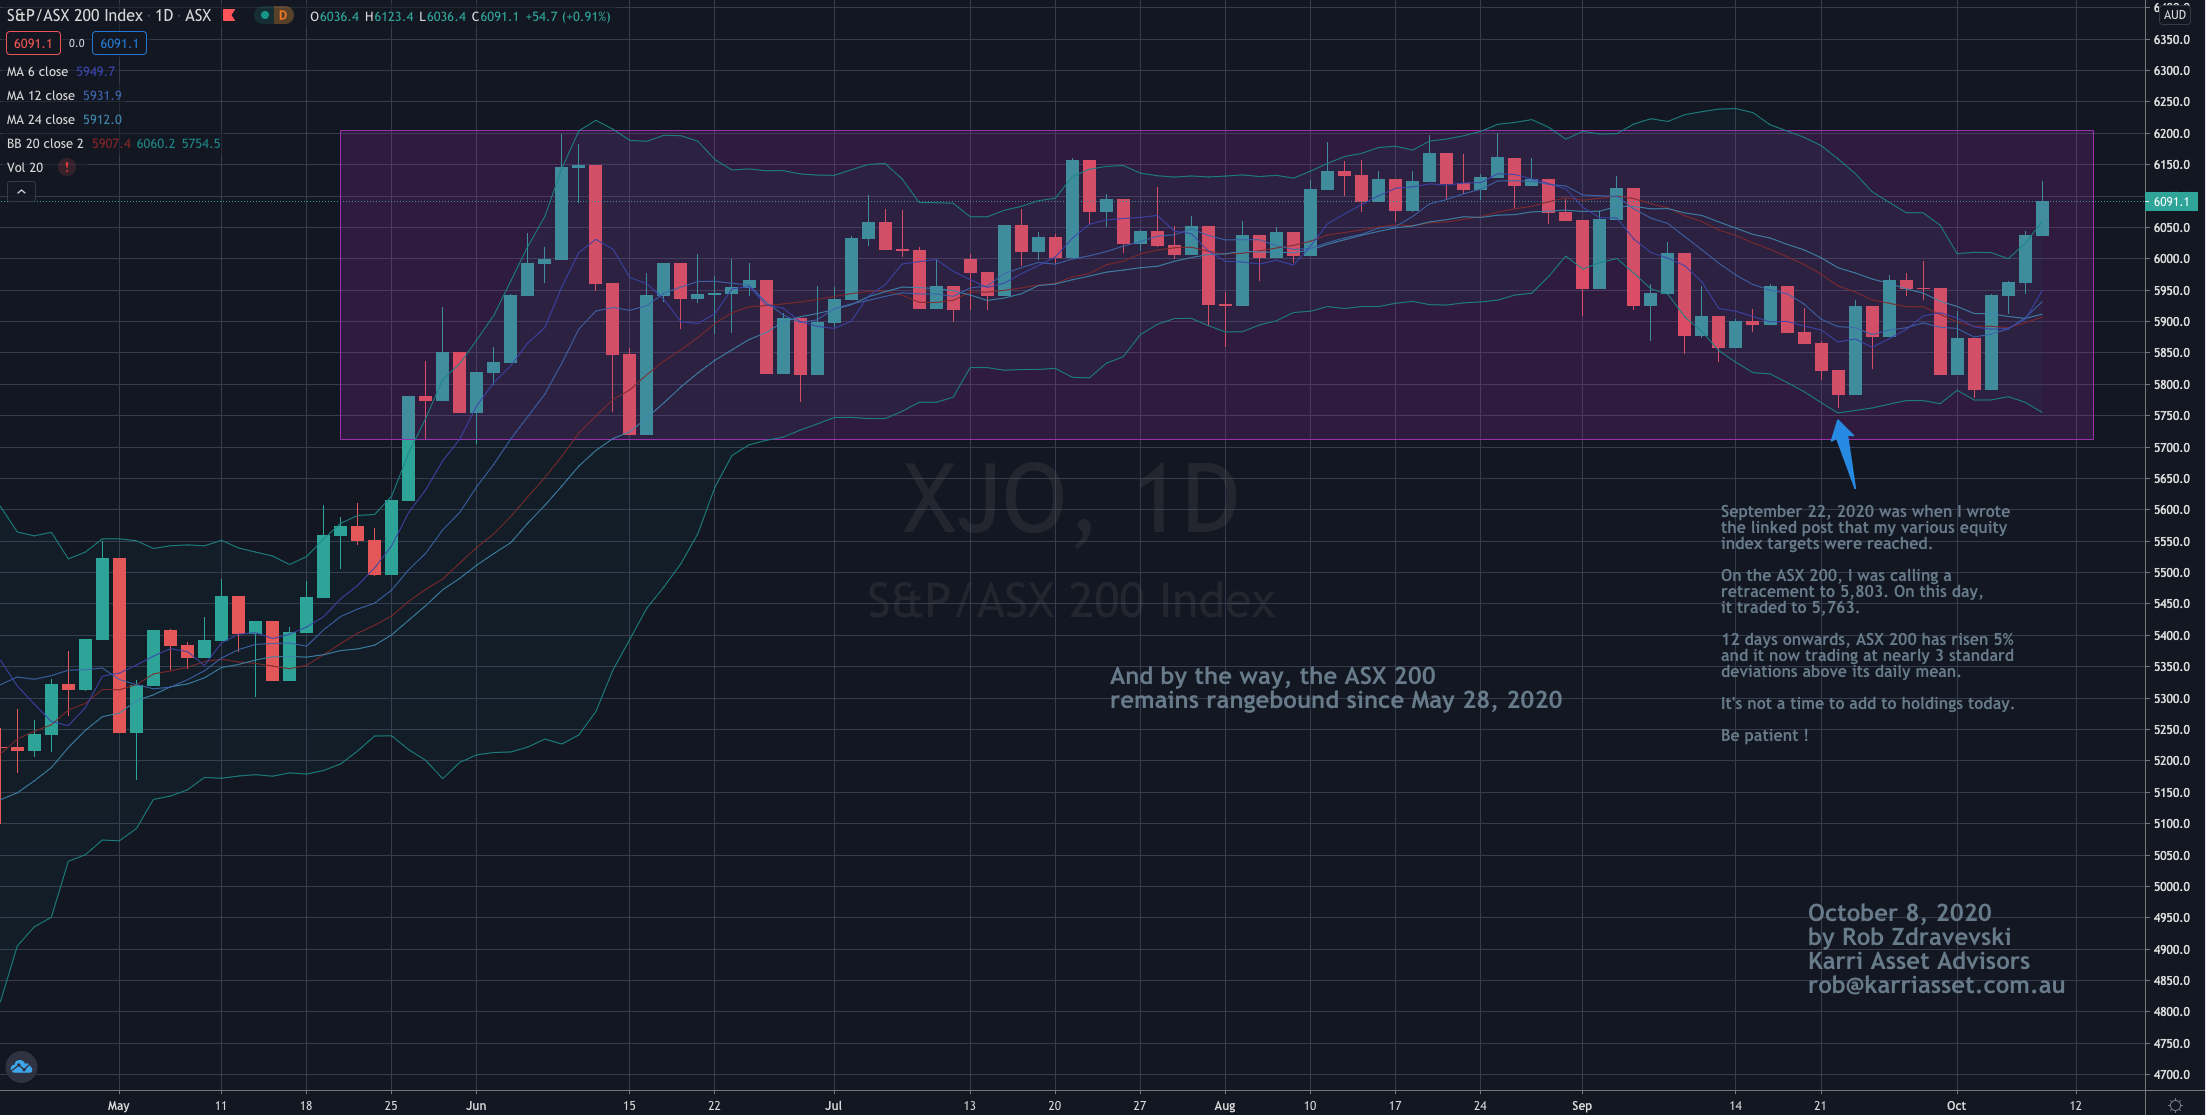
In the linked post below, I signalled that my various equity index targets were reached.

For the ASX 200, I was calling a retracement to 5,803. On that day (September 22, 2020) it traded to 5,763.

12 days onwards, the ASX 200 has risen 5% and it’s now trading at nearly 3 standard deviations above its daily mean.

It’s not a time to add to holdings today.

Be patient !

https://lnkd.in/gNr52Qv

October 8, 2020
by Rob Zdravevski
rob@karriasset.com.au

Oil Rigs…going cheap !

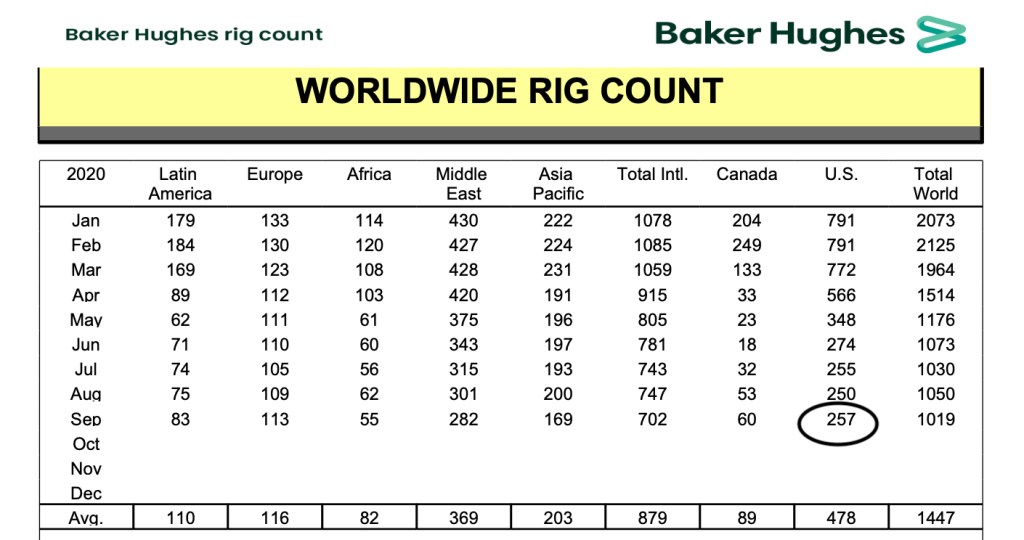
This is the lowest amount of oil rigs in operation within the United States since……”like ever”.

For the Oil, Gas and Statistic nerds – Scroll through the historical data in this link and you’ll be quite amazed.

Do you know what is currently going cheap in the world ?

Buying or renting an oil rig……

October 8, 2020

by Rob Zdravevski

rob@karriasset.com.au