Are they “natural buyers” ?
October 8, 2020 Leave a comment
Gold ETFs now make up 35 per cent of global gold demand compared with just 8 per cent a decade ago.
October 8, 2020
By Rob Zdravevski
rob@karriasset.com.au
Trying to hear what's not being said
October 8, 2020 Leave a comment
Gold ETFs now make up 35 per cent of global gold demand compared with just 8 per cent a decade ago.
October 8, 2020
By Rob Zdravevski
rob@karriasset.com.au
October 7, 2020 Leave a comment
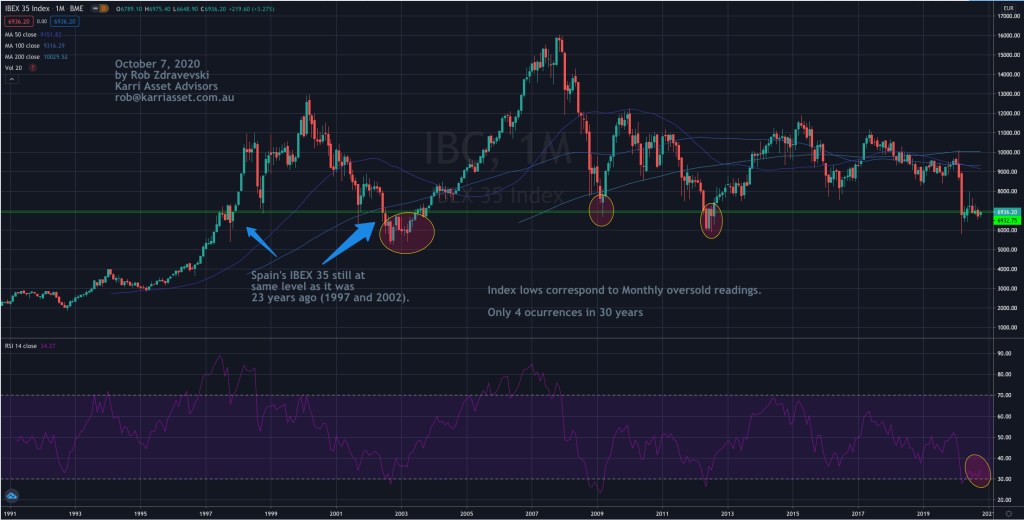
Last week I wrote about my two best Equity Index ideas.
Buy the U.K.’s FTSE 100 and Spain’s IBEX 35.
I wanted to attach some better charts showing the monumental extremes of an index being oversold, not on a daily or weekly terms, but on a Monthly basis.
Because we’re looking at them on a Monthly view, we’re not about to trade out this position next month.
When you’re a buyer of securities at such extremes, you’ve got to give yourself 10% of price movement. After all, in the case of the IBEX, I’m looking for a 45% rise over the next 2-3 years as the index means revert towards its 200 day moving average, which is currently 10,000.
October 7, 2020
by Rob Zdravevski
rob@karriasset.com.au

October 7, 2020 Leave a comment
Hello coffee lovers !
On Friday night, 2nd chance to buy coffee at $1.05 happened.
Arabica Coffee futures traded to $1.0490.
Will keep you posted how it turns out.
Rule # 1: Be sure to roll over your futures contract otherwise you’ll need a lot of room if you accidentally take physical delivery.
https://robzdravevski.com/2020/09/29/2nd-chance-to-buy-coffee/
October 6, 2020 Leave a comment
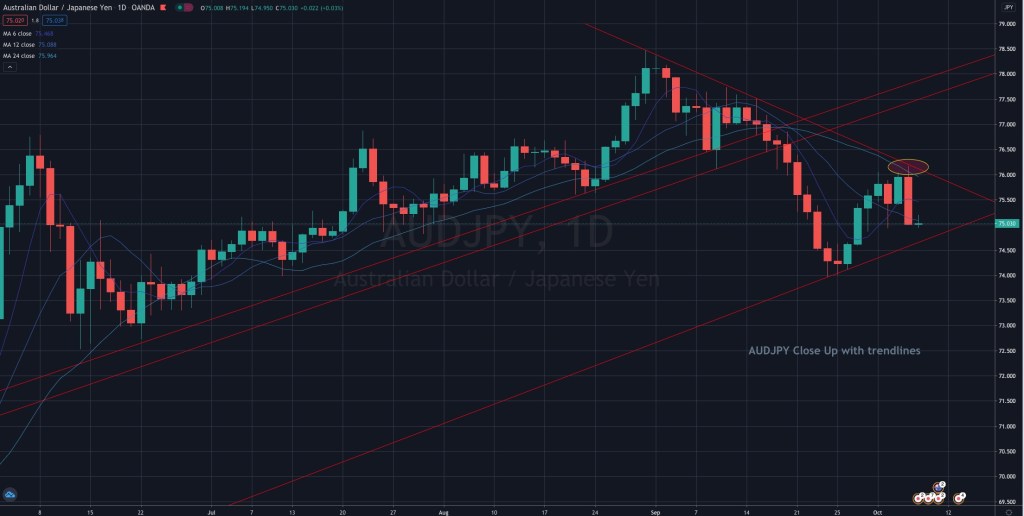
The AUDJPY….
I’m watching an acute short-term moment on this quite reliable indicator of “risk” or at least market direction and sentiment.
The chart below shows today’s early action of the AUDJPY peppering that descending trend line. Tie that into yesterdays post (link below) and you can watch how other assets react.
https://robzdravevski.com/2020/10/05/short-term-aud-fx-range/
October 6, 2020
by Rob Zdravevski
rob@karriasset.com.au
October 6, 2020 Leave a comment
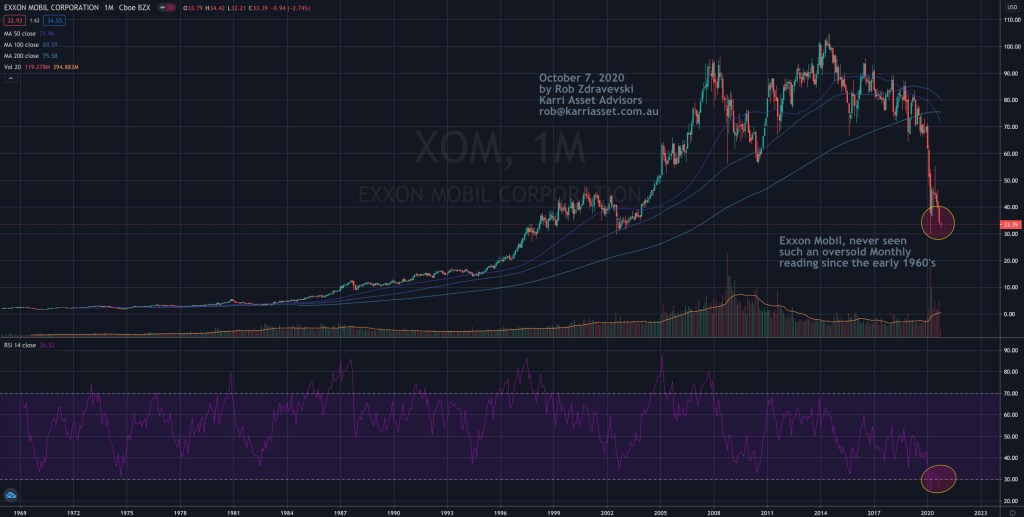
I have been negative on Big Oil but there have been some monumental moves lately. Some stocks are trading at “monthly” oversold levels not seen the 1960’s.
At $33, my calculations tell me you can Buy Exxon Mobil at its intrinsic value.
So this example turns XOM into a bond and still have some optionality.
Buy stock at $33 and
Buy January 2023 $30 strike Put option for $6.50.
Dividends are slated to be 87 cents per quarter. You’ll earn $7.83 over 9 quarterly dividends.
And the difference paid between your put option insurance and dividends earned is $1.33 or equivalent to 4% of the price paid for the stock today.
Over the next 2 1/4 years, this cash difference easily beats (even if it’s taxed) the 0.35% yield on the 5 year U.S. Government Treasury bond.
And the optionality is limitless, ranging from whether the oil price rises to $70, XOM returning to the Dow Jones Industrial Average or improving free cash flow, margins and EBITDA from a low base.
With a market cap of $145 billion (net debt of $57 bn) thus an Enterprise Value of $202 bn on 2019 revenues of $214 bn (2020 likely to be $185 bn) and EBITDA of $30 bn.
The Queen Mary is about to do a U-turn.
I’ll write about Gazprom & Russian oil, later.
October 6, 2020
by Rob Zdravevski
rob@karriasset.com.au
October 5, 2020 Leave a comment
Today, Northern Star Resources (NST.ASX) announced its wish to takeover Saracen Minerals (SAR.ASX).
Why don’t they call it a takeover rather than a merger?
Well, mainly because its “friendly”, hence using a “scheme of arrangement” encourages civil co-operation and it increases the likelihood of the deal completing but it does remove any possible price tension.
Anyway, putting spin to one side,
No premium was paid over the previous day’s closing price and Saracen’s board is recommending the acceptance of “nil premium bid”.
Yesterday, NST closed at $13.82. It is paying 0.3763 of its shares for 1 SAR share. This equals $5.20 per SAR share. Saracen’s closing price yesterday was $5.22.
This resembles past comments I have made suggesting that we can expect more ‘take-unders’ in terms of M&A prices paid.
Although this friendly and perhaps submissive path makes me wonder if Saracen think the business was/is fully valued?
Today’s price action in the rest of the sector is flat. In other words, ASX listed gold stocks are not being dragged higher with any M&A exuberance.
Perhaps last weeks note (link below) may add a little more ‘colour’ to the ASX gold market.
https://robzdravevski.com/2020/09/28/you-wont-lose-your-job-hedging-at-these-levels/
October 6, 2020
by Rob Zdravevski
rob@karriasset.com.au
October 5, 2020 Leave a comment
During this week of October 5th-9th, if the AUDUSD stays under 0.7280 but breaks below 0.7030, then I’ll look for lower prices.
It’s 0.7168 as I write this.
Similarly, if the AUDJPY stays below 76.40 and breaks under 73.95 (it’s 75.68 at the moment), it will add weight for lower equity indices.
Incidentally, Bitcoin’s support level is ~ $10,320
Failure of these short-term support level should have mimicking effect on other asset classes.
October 4, 2020 Leave a comment
When thinking about the valuations of the numerous high flying Nasdaq stocks and the prices which investors are paying for, I can’t help think of this quote from Burton Malkiel.
“Stupidity well packaged can sound like wisdom.”
Keep in mind, my comment is aimed at their valuations not the companies and the businesses themselves. Many of which are fabulous.
Nonetheless, I expect a “white-hot” IPO market over the next 18 months.
October 4, 2020
by Rob Zdravevski
rob@karriasset.com.au
October 3, 2020 Leave a comment
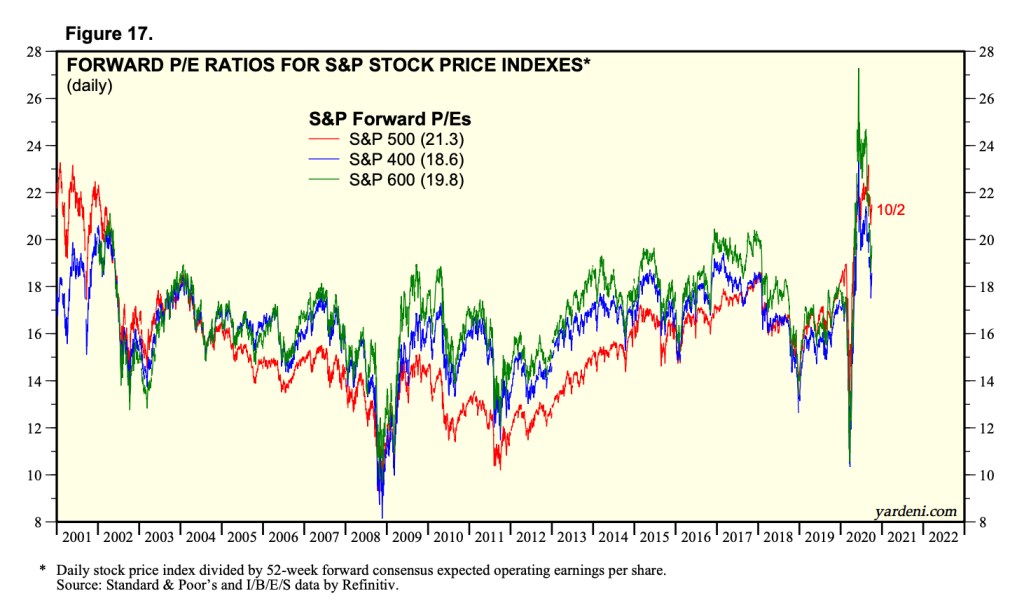
Forward consensus earnings for the S&P 400 Mid Cap Index have been rising lately.
So much so, that P/E is now 18.6,
which is about where it was 4 years ago.
That means its earnings yield is 5.3%, which is 7 times more than the 10 year government bond yield……
October 4, 2020
by Rob Zdravevski
rob@karriasset.com.au
October 1, 2020 Leave a comment
October 1, 2020
In another edition of “unbelievable shit” or perhaps more politely phrased, “jumping at shadows”.
I ran out of time to quip about yesterdays Australian ASX market action but writing about it today makes it even clearer when pointing out the absurd.
Here’s how I saw it…….traders react to a Trump/Biden calamity and the ASX 200 closed Wednesday’s trading session with a decline of 2.3%.
It seemed like it was anticipating a negative Wall Street reaction to a woeful debate, for the previous night’s action in the overseas markets was benign with the S&P 500 only falling 0.5%.
On Wednesday, BHP fell 3.5%, Woodside tanked 5%, a mining explosives company (Orica) slid 3.5%, a fruit and vegetable wholesaler (Costa) dropped 2.9%, a private hospital business (Ramsay Healthcare) eased 2.6% and banks kept pace with the index declining 2%.
Investors seemingly threw away their shares.
How did the fortunes of your little biddy Australian company change by 3% in a single day as a result of U.S. Presidential debate shenanigans?
These are the days when you should consider adding to your portfolio…..
Add to the mix that yesterday was the last day of the month and quarter….one can’t help think that institutional fund managers were the main participants in the decline.
p.s. day traders and private clients can’t move these large stocks by such percentages.
Although I’m sure some poor amateur investors also got spooked (cause there is nothing like a little extra commission to top up the month for your broker), but it’s your trusted managed (super, hedge etc) fund who exacerbate such moves.
Some brokers were telling me that the market was “overbought and due for some profit taking”…..
after all, the ASX 200 had risen 2.9% over the past 5 days…a very nice performance indeed.
Incidentally, the S&P 500 had risen 3% in the same time…
Of course it’s institutional fund managers who are responsible for such gyrations……
keep in mind that they need to book their quarterly gains so they can charge their performance fees or at least report something profitable in upcoming marketing material.
You see…….if the fund managers hug the index or match their benchmark, there is less chance of monies being withdrawn from their pool and they get to keep their job.
The regular investor who sends (invests) money to the funds management industry don’t see or hear of the daily going’s on.
But it’s OK,
Wall Street didn’t fall in a reaction to the debate, in fact it rose 1%.
So today’s strategy amongst the folk seems to…..
“oh shit, we better buy those stocks back even if its a higher price at which we sold at yesterday and don’t forget it’s the start of a new quarter”
The ASX 200 is up 1.7% (as I write this).
Until next time,
warm regards, Rob
October 1, 2020
by Rob Zdravevski
