No Diving – (Pool)back is Shallow

While many of my indicators are either confirming (or near doing so) a turn lower in many asset prices…..ranging from Copper, Soybeans, Wheat, Corn, Coffee, Australian Dollar (vs USD & JPY) and the S&P 500.

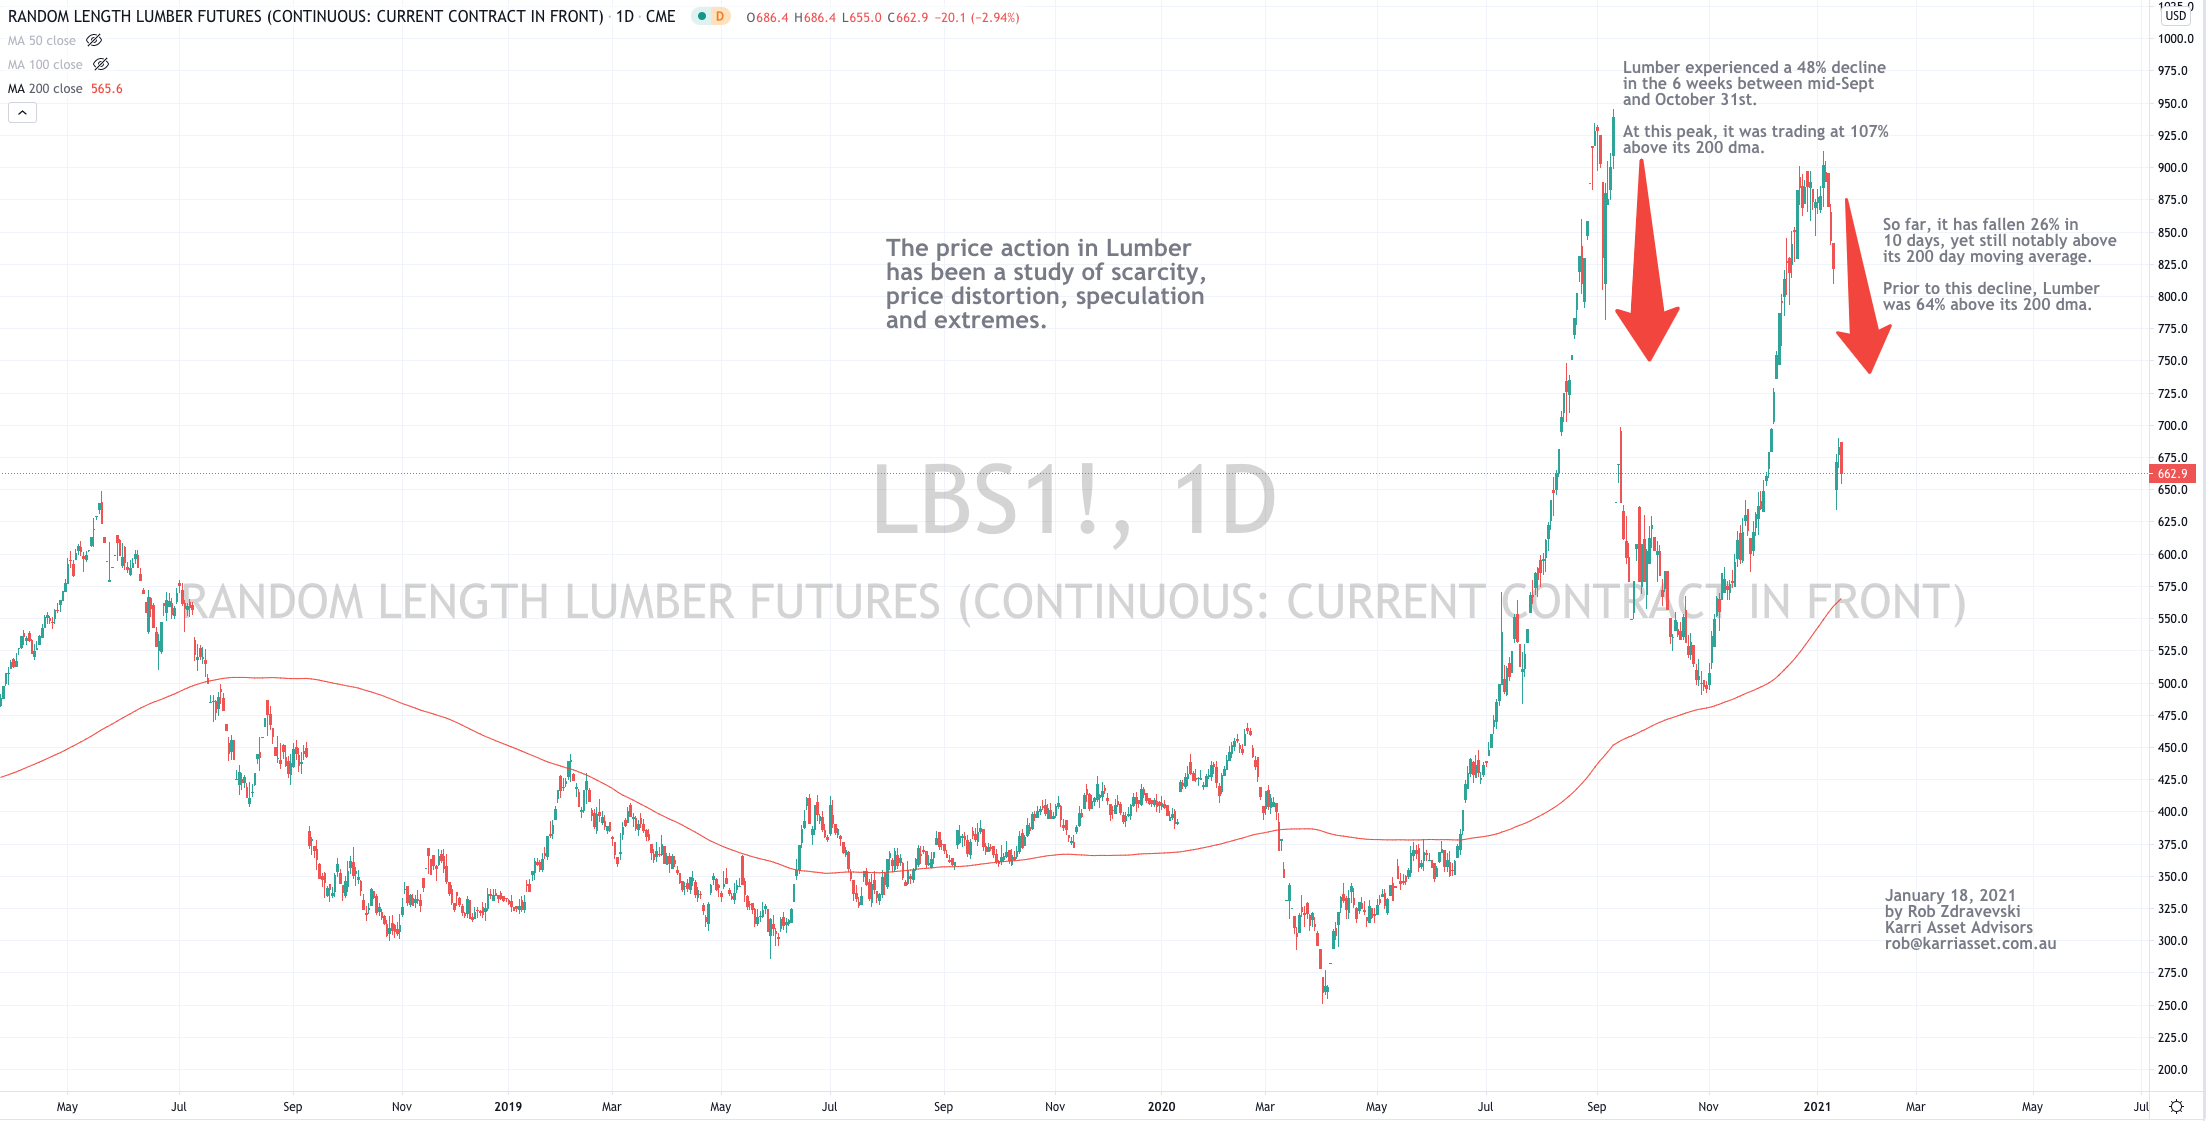
except for Gold (in AUD), Pork (Lean Hogs) and Lumber…..the latter has risen 40% again, over the past 2 weeks.

Albeit I have already positioned portfolios for a decline (by moving to 35% cash and additional index and specific stock put option hedges)……

rather than speculating on the myopic business of ‘shorting’, my guidance is to prepare acquiring securities in sectors which will present attractive risk/reward opportunities.

Some industries to watch include Oil, Gas and Insurance, to name a few.

I’m re-iterating to clients that I am not lacking investment ideas. It’s more of a function of which ones to exclude.

I expect this pullback in equities to be shallow.

Spain’s IBEX and the U.K.’s FTSE 100 have already declined 8% from their January 10th high (a date which coincided with my “Cashing In Your Chips” note.

January 30, 2021

by Rob Zdravevski

rob@karriasset.com.au

Lumber and its 2nd and 3rd derivative effects

Lumber has once again taken a dive, only after it recorded a second effort of doubling its price in a short order of time.

In fact, the price action in Lumber has been one of scarcity, distortion, speculation and extremes.

The rise in price has mainly been driven by a surge in homebuilding and renovation demand and a shortage of by-products such as plywood coupled with a major disruption in supply chains.

The sudden declines are a function of speculative excesses being corrected by a simple, honoured notion of mean reversion, which is quite a reliable pricing tool in commodity markets.

Who is affected by these gyrations?

Building product manufacturers, the forestry industry, timber merchants, the carbon sequestration industry, homebuilders, consumers and kitchen cabinet makers, to name several.

January 18, 2021

by Rob Zdravevski

rob@karriasset.com.au

Gold should march to a different beat

As I call for a near-term decline in the AUD versus the USD, we should see correlated (sympathetic) performance across commodities prices, by which I mean in energy, agricultural (softs) and industrial metals but I don’t expect that to be the case for precious metals.

Especially for Gold.

The chart below shows 2 periods over the past year where the USD Gold price (in blue) has not moved in its ‘expected’ synchronicity with the (denoted in orange) AUD/USD currency rate.

Clients will be receiving specific commentary overnight.

January 17, 2021
by Rob Zdravevski
rob@karriasset.com.au

Cashing In Some Chips

January 10, 2021

I’m moving portfolios to at least 35% cash and hedging some positions. Other may call it insurance or protection.

I say this with nearly 3 decades of experience which includes studying market and investor behaviour along with some pattern recognition and statistical analysis………

combined with observing unquantifiable occurrences (such as a capital raising and IPO frenzy)……..

and various indicators (amongst currencies, bond, equity and commodities) are aiding my stance and highlighting notable extremes (and peaks) in certain markets and specific assets/securities……

which help me come to a conclusion that I am not going to stick around for the last 10% of this market.

Some of those observations include;

the S&P 500 index is trading at 34% above its weekly moving average (MA)

the only other times when this metric was higher occurred in October 1987, July 1998 (coinciding with the demise of LTCM and the Russian financial crisis) and March of 2000. (funnily, a 14%-18% decline back to its 50MA is only back to the October 30th mark);

the CBOE Put/Call Ratio is at 0.44, which indicates call buyers are outweighing put option buyers notably;

88% of NYSE stocks are trading above their 200 day moving averages (only seen 3 times in the past 20 years);

the amount of Net Long Commodities futures and options contracts (2.3 million of them) are at their highest since January 2011. (take a look at your CRB and Bloomberg Commodity Indices around the first quarter of 2011)

Equally, the CRB Index is trading at its most overbought levels since April 2014.;

In fact, bullish bets on Corn are at their highest in 10 years. This coincides with my recent note about Corn (and soybeans) being extremely overbought. A reversal in the corn prices makes inputs cheaper for Kellogg…..

Parabolic price action in Bitcoin and Tesla now has those assets trading at 172% and 151% above their 200 day moving averages. (we’ll be looking to buy some Put Options in specific tech stocks);

The AUD/USD is the most overbought (on a weekly basis) since September 2017 when it was then trading at 0.8050, while the AUD/JPY hit a similar measure not seen since December 2016;

While all of this is going on, Gold has spent time digesting and has now traded back to its 200 day moving average.  ❤️

I’m much more interested in Gold (US$1,847) and gold equities today.

Brent Crude has spent a few weeks tickling 3 (not 2) standard deviations above its mean and should come back from $56 to $47;

If you thinking about Short Government Bond Yields……beware, it could be a trap;

This is not a wholesale call to exit assets because we all have our certain stocks and special situations to own and reasons for them.

In fact, I anticipation deploying some capital into more defensive and staple orientated businesses…….

but as far a broad, macro market call……this is my current position.

Clients will receive separate and specific advice to consider actioning……

In the meantime, keep in mind there are times to heighten your awareness towards managing your portfolio, exposure and risk……….

this is one of those moments.
 

Until next time,

Warm Regards,

Rob Zdravevski

rob@karriasset.com.au

’tis the season

Harvest or Hedge…….
is my overall view on global equities.

January 9, 2021
rob@karriasset.com.au

Enough talking, take a position

On November 11th, 2020, Tesla’s shares were priced at $400.
Now, 2 months later they are trading at $880.
More impressive is that its market cap is now $834 billion. That’s a large market cap to double in 2 months.

And while we talk about Tesla being a ‘bubble’ (insert any other adjective you care for) along with the company being worth more than 10 of the largest auto manufacturers combined, no one actually seems to talk about shorting the stock.

Incidentally, it took Apple 40 years as a public company to reach a market cap of $1 trillion (which it achieved in October 2019).

Then it only took another 10 months (by August 2020) for Apple to double its market cap.

In that time of ‘doubling’, its sales, profit and ebitda were flat.

Today, that market capitalisation sits at $2.223 billion.

January 9, 2021
by Rob Zdravevski
rob@karriasset.com.au

Extremes – Overbought Readings – Dec 30, 2020

In this edition of extremes I am seeing in the market, it’s no surprise that its dominated by securities and assets which are Overbought, such as;

Soybeans & Corn (up 50% in 5 months)
Lumber, again. (following a scorching 243% rise between Apr-Aug then followed by a 47% fall, it seen a new 81% advance over the past 2 months)
Copper (soared 70% over 8 mths)
Tin (rose 33% in 7 months)
Iron Ore (added 88% in 8 months)

While the CRB (commodity) Index and Brent Crude are yet to trade into Overbought territory, the former has risen 62% from its April lows, while the latter has produced a stunning 220% return from its $16 April lows and also has a notable weighting in the index.

Incidentally, Gold (in USD) has risen 27% over 9 months.

While I call a new commodity bull cycle, beware that the absolute time to “buy straw hats in winter”, isn’t today.

This is list is meant to tell you that the probability of going long at this moment isn’t ideal.

New buyers will need to wait.

In currency land, those Overbought versus the USD are;
NZD, CNH, KRW, SEK & SGD.

(n.b. the last time the NZD was this overbought was July 2011)

Amongst equity indices, members of the Overbought club are;
the Bovespa (up 28%), the Kospi (+ 24%), the Nikkei 225 (+19%) and the Russell 2000 has soared 27% (and has been overbought for 3 weeks).

Note: that the Nasdaq and &P 500 haven’t touched Overbought levels yet.

Reference closing prices:

Soybeans 13.11, Corn 4.84, Lumber 873, Copper 3.52, Tin 20,580, Iron Ore 158.00, CRB Index 167.80, Brent 51.70, Bovespa 119,017, Kospi 2,873, Nikkei 27,444, Russell 1,975.

(versus USD) NZD 0.7182, CNH 6.50, KRW 1,086, SEK 8.23, SGD 0.7565

December 30, 2020
by Rob Zdravevski
rob@karriasset.com.au

Questioning if Bitcoin is Worthless

While I now hear of predications that Bitcoin will reach $100,000, I don’t hear many asking what if Bitcoin is worthless?

Overnight;

Ripple has fallen 40%
Ethereum has declined 7%
Litecoin has sunk 11%
EOS has retreated 20%

On 18 of the past 60 days, Bitcoin has risen or fallen 4% or more from its previous day’s close.

Currencies (or the “heir apparent’s”) shouldn’t be moving that much and if they are, it’s not a healthy sign.

After all, Bitcoin is already 11 years old.

(note: isn’t it funny that cryptocurrencies are being quoted and traded against that ‘old enemy’ being the fiat currency)

If crypto currencies aren’t ‘influenced’ by a government then how will we make economic adjustments for inflation?

If we start using Bitcoin to pay for food, fuel and rent, will inflation (or deflation) no longer exist?

If there isn’t any inflation, revenues, expenses, deficits, surpluses and perhaps taxes connected, how do I value a cryptocurrency?

Is it part of a greater fool theory?
Are we relying in the pure speculative value of the currency?

Is it there ‘scarcity’ of units issued which allows cryptocurrencies to rise or retain their value?

For it can’t scarcity of actual currencies, as there are 180 fiat currencies in the world (the top 10 are 90% of FX trade), while there are estimates of between 4,000 and 7,000 cryptocurrencies existing and 1,000 have been reported to have failed.

December 24, 2020
by Rob Zdravevski
rob@karriasset.com.au

Tesla should buy them all

Tesla Motors market cap is $659 billion.

The combined market capitalisations of the top 10 automobile manufacturers (in unit volume) is $567 billion.

Perhaps Tesla should use its wonderfully inflated stock price to buy all of these companies??

Or does Tesla barrel forward so that they put them all out business?

What an interesting tussle we are about to see….

Oh, I forgot to say…Tesla will manufacture approx. 430,000 cars in 2020, while the Top 10 will crank out about 65 million vehicles.

(here’s the list of Top 10 manufacturers Market Cap in USD; note: this is not their Enterprise Value)

Renault $13bn

Hyundai/KIA $21bn

Nissan $22bn

Peugeot/Citroen $24bn

Ford $35bn

Fiat/Chrysler $36bn

Honda $52bn

GM $59bn

Volkswagen $95bn

Toyota $210bn

Incidentally, Daimler and BMW have market caps of $63bn and $59bn respectively yet they are ranked 13th & 14th globally in unit production.

https://en.wikipedia.org/wiki/List_of_manufacturers_by_motor_vehicle_production

December 20, 2020

by Rob Zdravevski

rob@karriasset.com.au

Overbought Brent

Today, at $51.10, Brent Crude Oil has registered its most ‘daily’ overbought reading since January 3rd, 2020 (when it was trading at $70).

I’m still bullish on the price of Oil but its telling me to harvest a little as prices should take a pause.

December 17, 2020
by Rob Zdravevski
rob@karriasset.com.au