The following assets (on a weekly timeframe) registered an Overbought reading or traded more than 2.5 standard deviations above its rolling mean.
Extremes “above” the Mean (at least 2.5 standard deviations)
German 2 year government bond yields
China Coal
CAD/USD
Oslo equity index
Overbought (RSI > 70)
Australian 2, 5 & 10 year government bond yields
Greek, Spanish, French, Italian, Portuguese, New Zealand, Swiss & Korean 10 year government bond yields
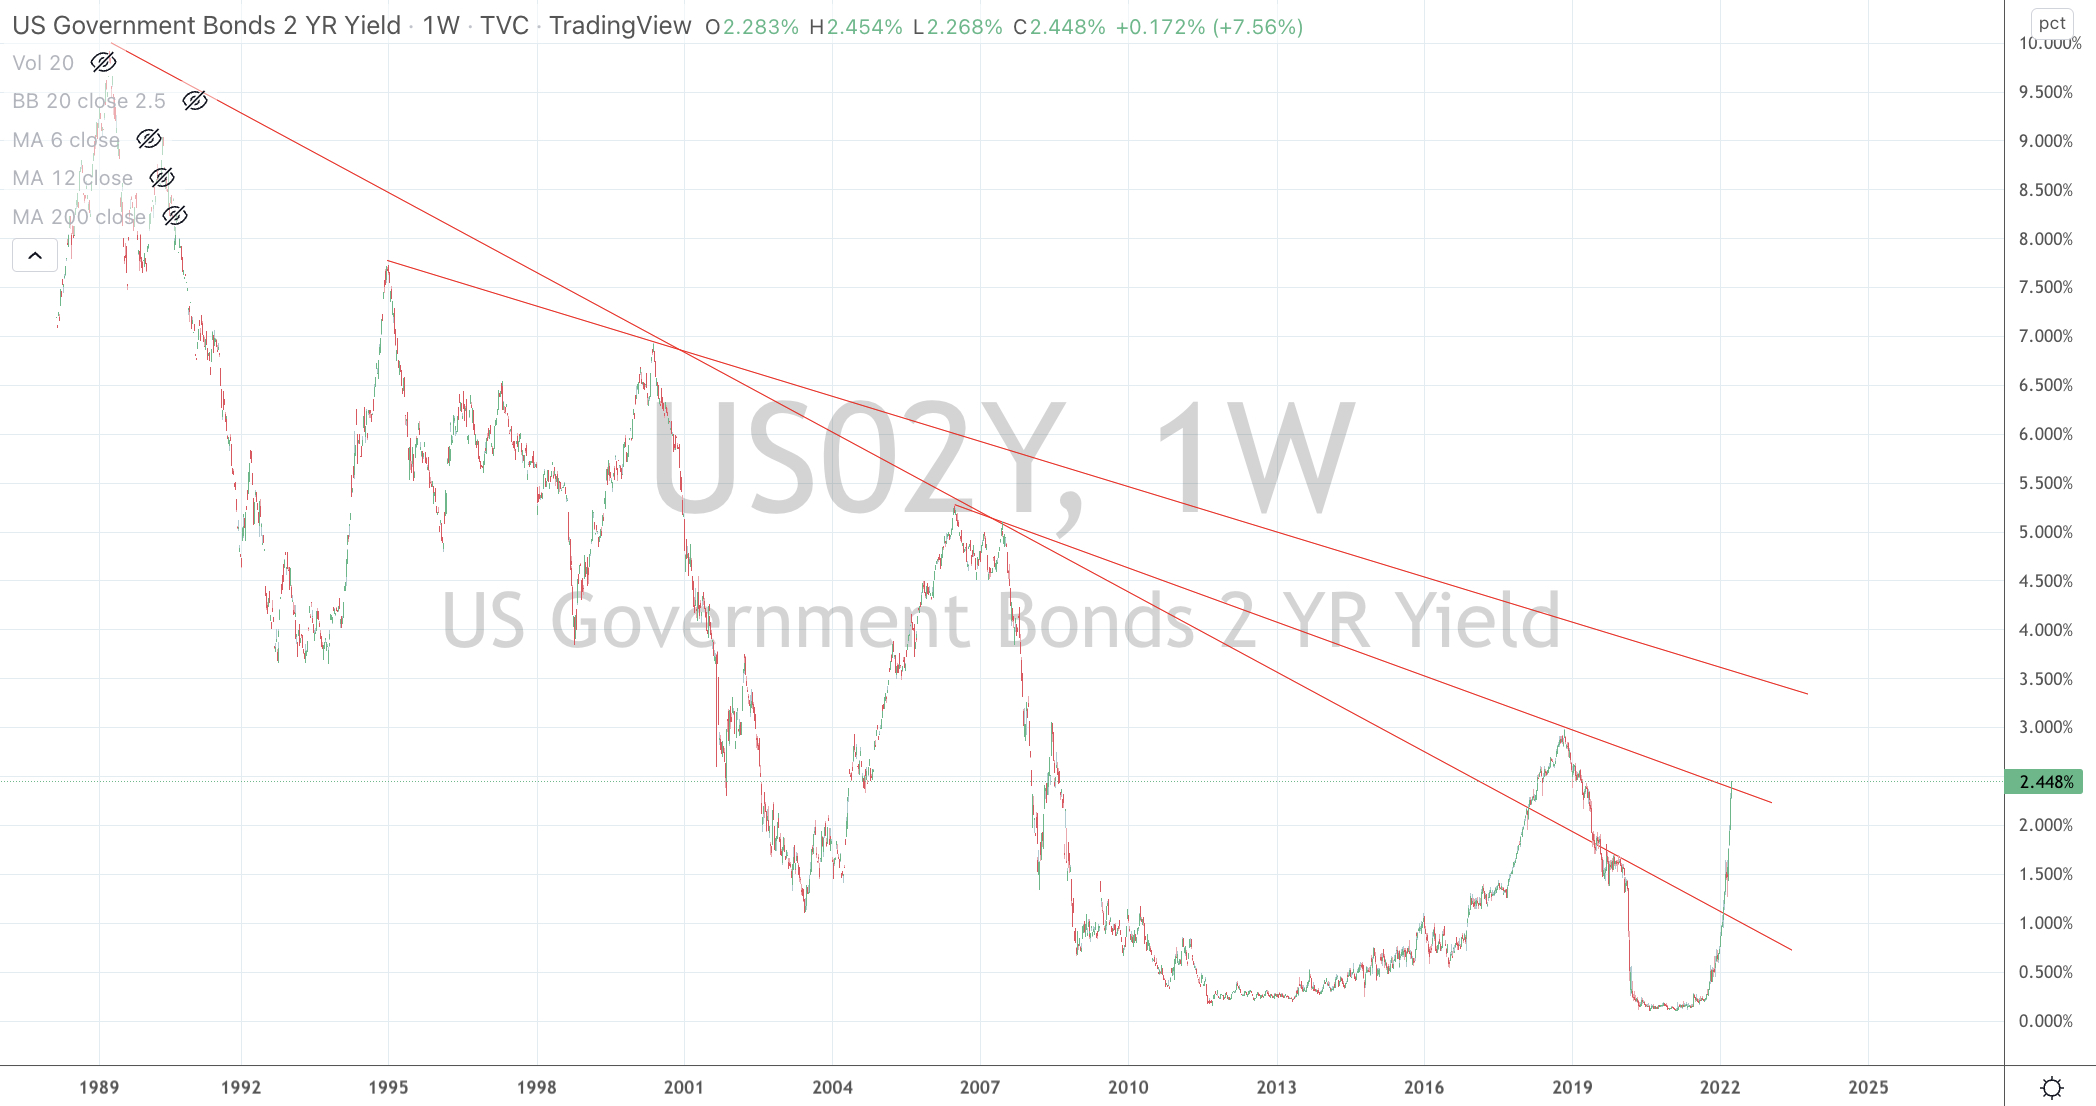
U.S. 2 and 5 year yields
CRB Index
Cotton
Uranium
AUD/GBP
The Overbought Quinella – Both Overbought and Traded at > 2.5 standard deviations above the weekly mean)
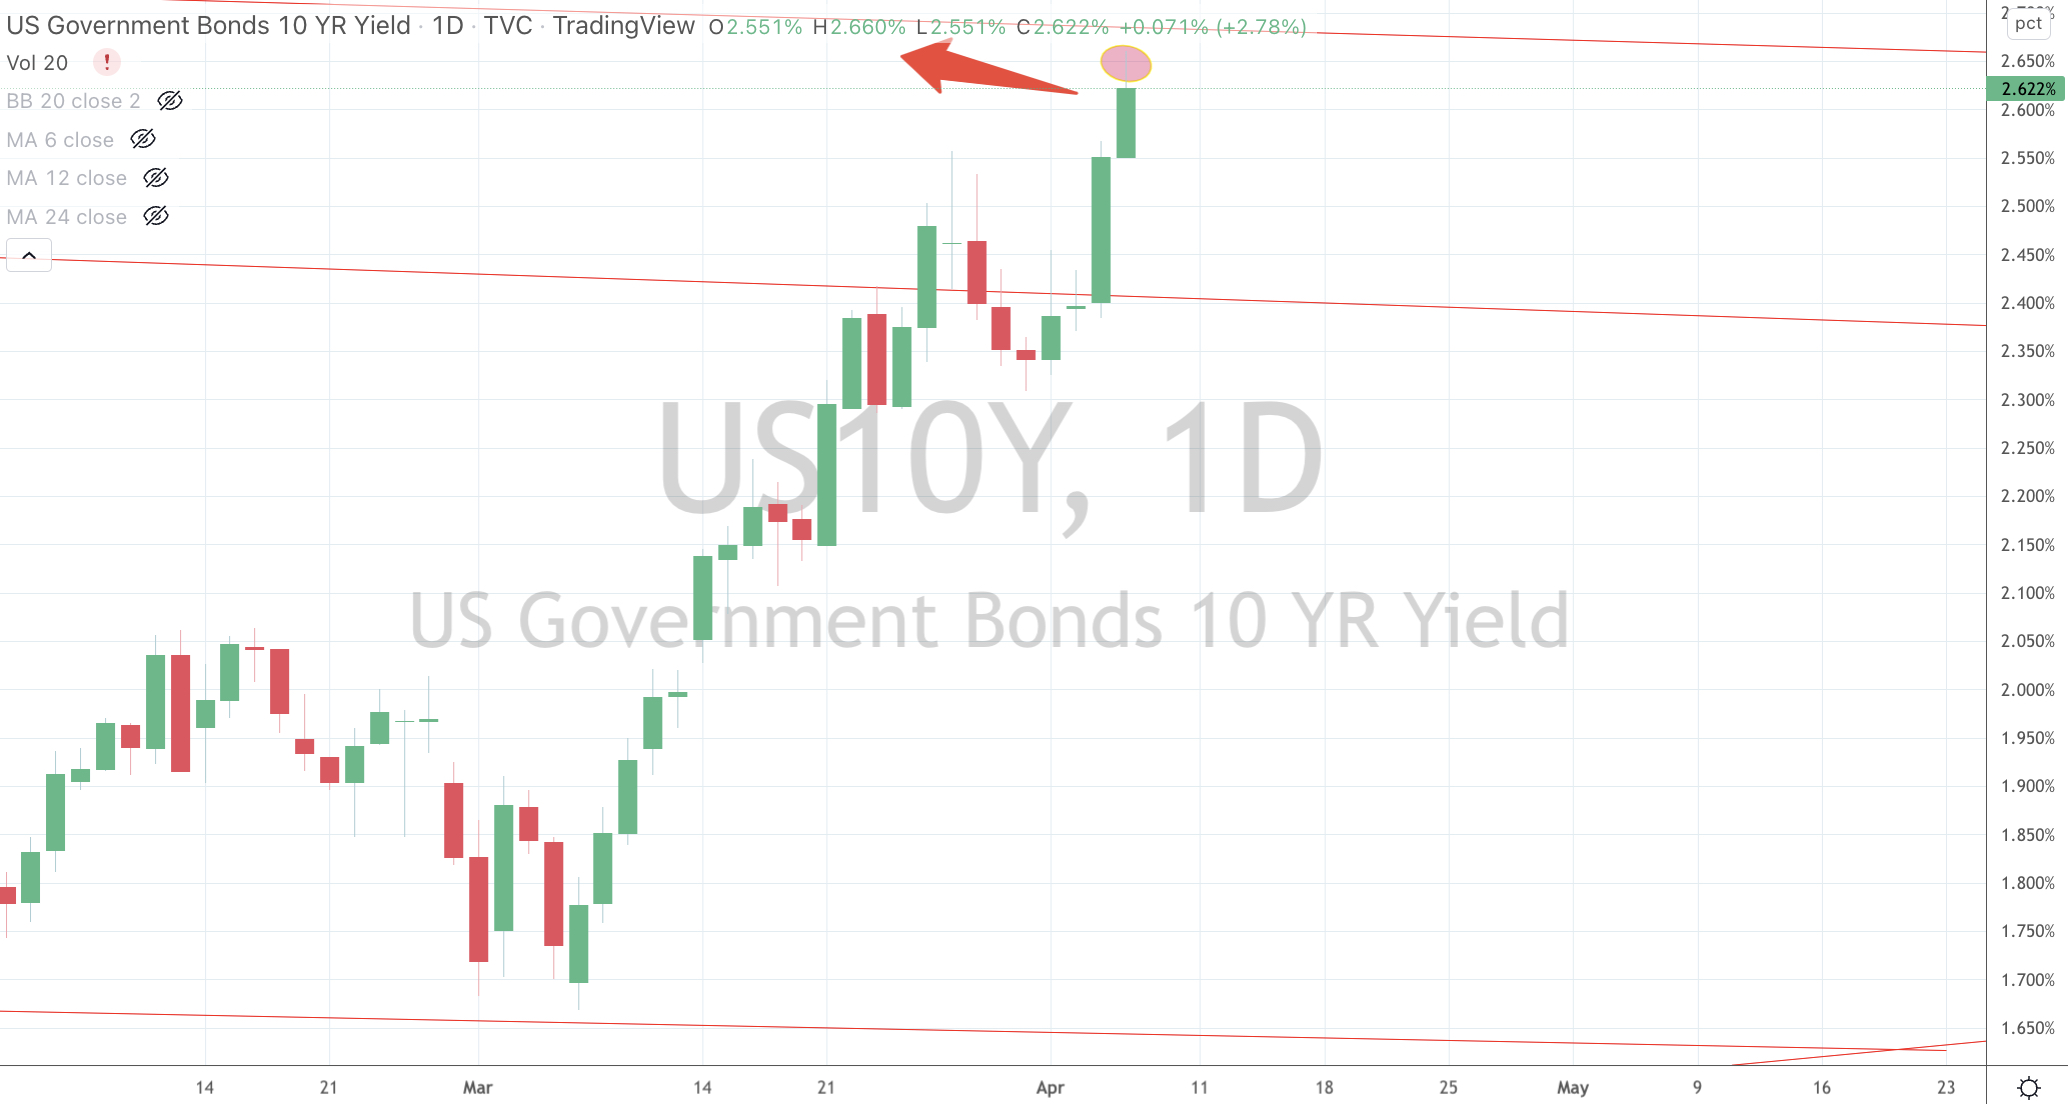
U.S. 10’s (10 year government bond yields)
German 5’s
Australian 3’s
Canadian and Swedish 10’s
AUD/JPY
USD/JPY
Assets (securities) which touched the other side of the extreme, being Oversold (where the RSI is < 30) or were at least 2.5 standard deviations below its mean are;
Extremes “below” the Mean (at least 2.5 standard deviations)
None
Oversold (RSI < 30)
U.S. 10 year minus 2 year government bond yield spread (lowest since February 2007)
HKD/USD
Russia’s MOEX Index
The Oversold Quinella – Both Overbought and Traded at > 2.5 standard deviations above the weekly mean)
JPY/USD
U.S. 10 year minus 5 year government bond yield spread (which has now inverting and at lowest since September 2000.
Notes & Ideas:
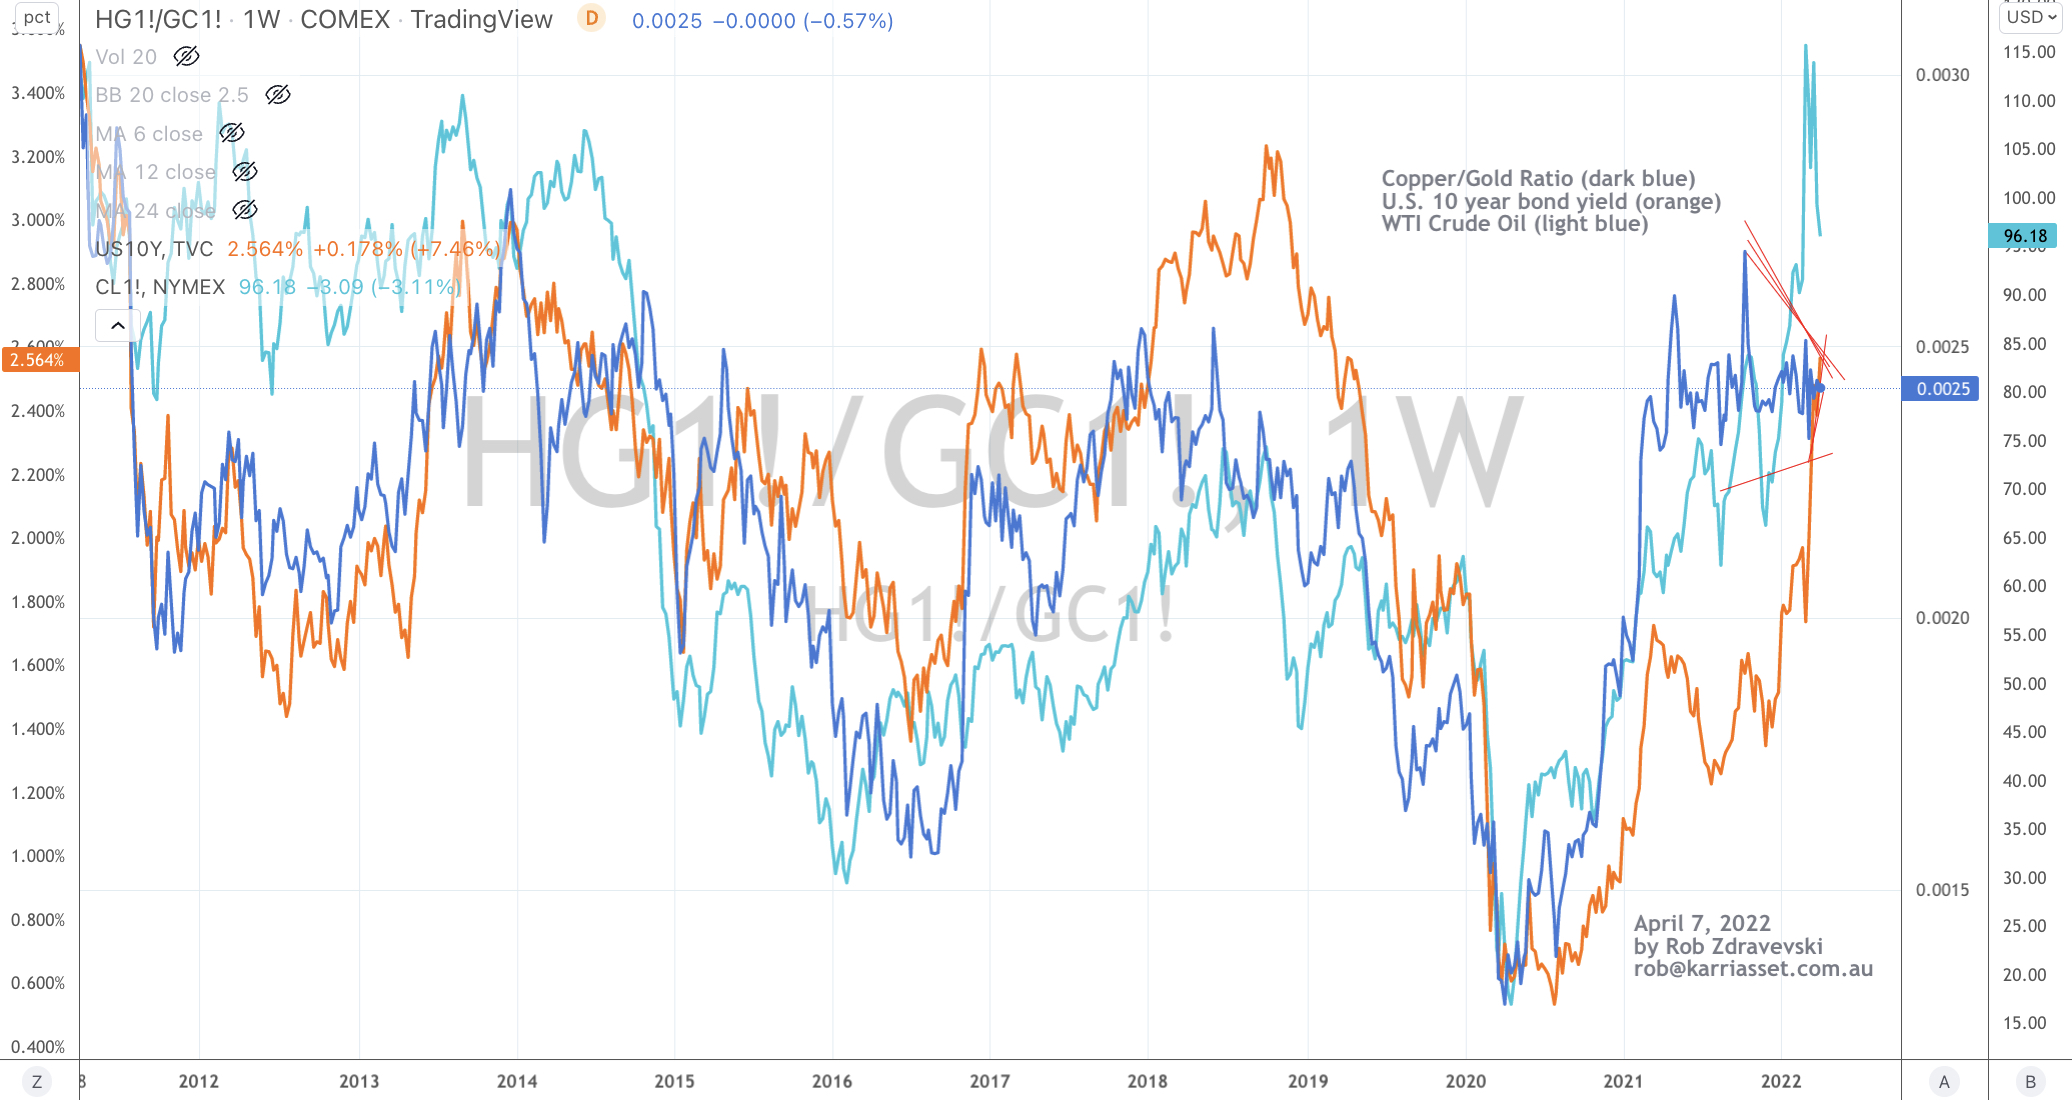
The big news in this week’s edition is the reaction to last week’s extreme highs in government bond yields.
The U.S. 10’s in particular peaked at 2.56%, I was allowing up to 2.66%. They closed at 2.38%.
Last week I wrote that the TBT & TBX (U.S. listed “Short” bond ETF’s) were confirming the inverse reading of the overbought U.S. government bond yields.
Now, they are no longer Overbought.
While yield curves flattened and the US 10-2 spread went negative.
I’ve written many notes on this topic for the past year which are searchable on my blog.
In other bond news, Brazilian 10’s fell from 11.88% to 11.40%
Russian bonds started trading again and closed the week at 11.3%, which is lower than the 19.9% yield when last halted on Feb 28th.
Germany 10’s are no longer overbought. In the past 3 weeks, those yields moved from 0.59% to 0.74% and back to 0.56%.
I’ll also look the U.S. 10 minus German 10’s spread. A break of a major support suggests a flatter curve. Note to come later in the week.
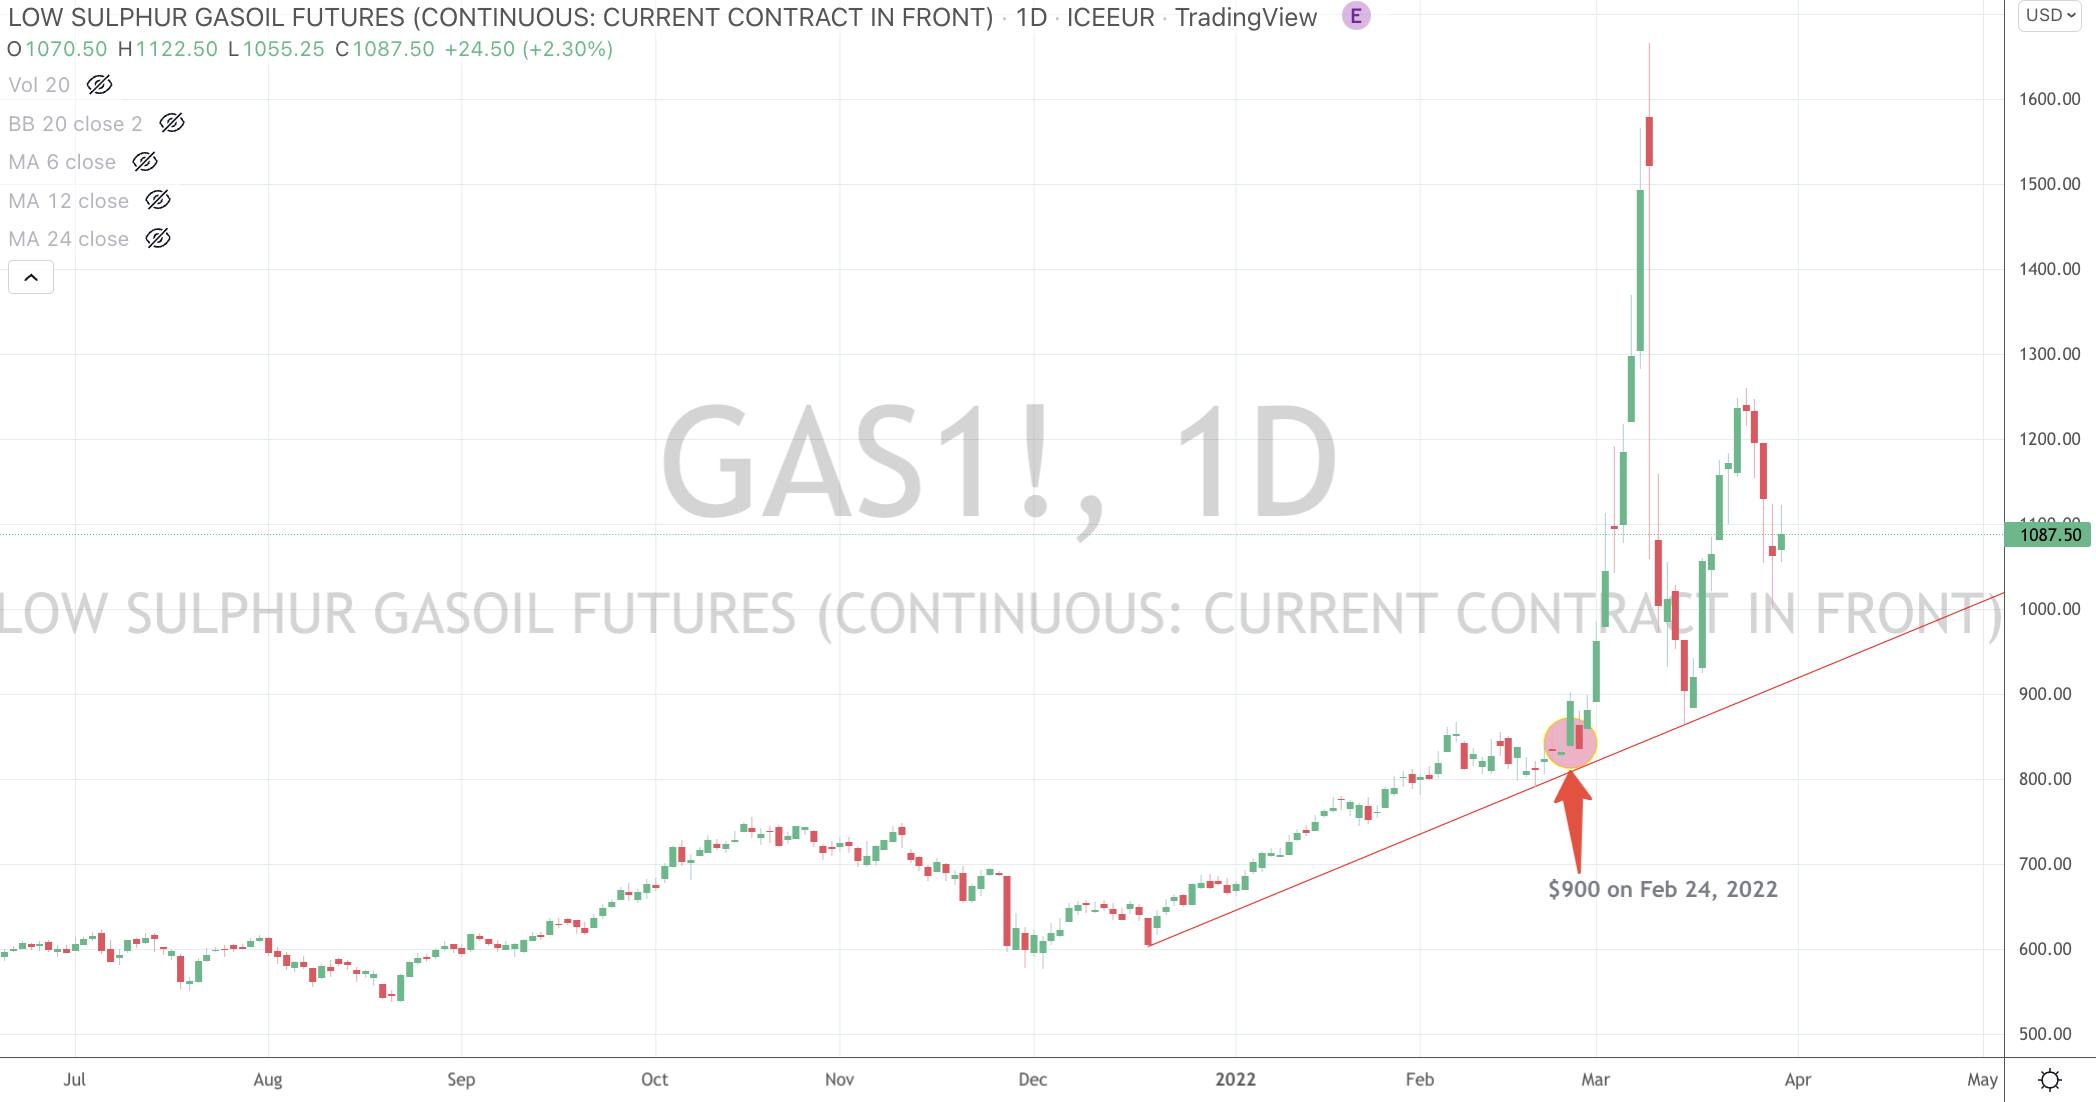
The second largest piece of news was a the decline in prices amongst the energy and agricultural complex.
In fact, news of Crude and Wheat falling 13% and 11% respectively didn’t seem to hit the headlines. Perhaps we are desensitised to such moves in light of the volatility (and gains) seen recently.
For a little context, other than the negative oil price stoush in March 2020, the price of Crude hasn’t seen a 13% weekly decline since 2007.
Are prices falling due to reversion following parabolic moves or is just springtime in the Northern Hemisphere?
As the list of ‘extremes’ continues to shrink we are seeing many assets meander back to the means and work their way into new trends.
Also, the VIX index eased a little lower to 19.6
The AUD and USD remain at 6 year highs against the Japanese Yen;
The Nasdaq rode 0.8% this past week adding to the bullish outside reversal which has now seen it rise 11.4% since that occurrence, 3 weeks ago.
The movement in the Gold Volatility Index is garnering my interest. Look for an upcoming note on this.
The AUD/SGD is nearly overly Overbought, while the DXY is not overbought this week.
And the S&P 500 closed unchanged but touched my interim high target mentioned in last week’s ‘extreme’ edition.
The larger advancers over the past week comprised of;
China Coal 9%, Hot Rolled Coil Steel 37%, Coffee 3%, Natural Gas 2.7%, Orange Juice 4.4%, Rubber 5.4%, Dutch TTF Gas 10.7%, Shanghai Composite 2.2%, CAC 2%, CSI 300 2.4%, MIB 2.5%, HSCEI 3.5%, Hang Seng 3%, IBEX 2.1%, MOEX 11.1%, Copenhagen 4.5%, Helsinki 2.5%, Sensex 3.3%, BOVESPA 2.2%, Istanbul 4.6% and Australia’s ASX 200 rose 1.2%.
The group of decliners included;
Aluminium (3.4%), Australian Coal (19.3%), Rotterdam Coal (-2.6%) now 30% in past 3 weeks, Bloomberg Commodity Index (4.6%), Baltic Dry Index (7.4%), WTI Crude (12.8%), Gasoil (8.8%), GVX (22.7%), Lean Hogs (5.8%), Heating Oil (16.9%), Lumber (4.3%), LNG (2.3%), Nickel (8.7%), Palladium (5.3%), Platinum (2%), Gasoline (9.1%), Silver (3.8%), CRB Index (4.6%), Brent Crude Oil (11.4%), Gold in USD (1.7%), Corn (2.7%), Soybean (7.4%), Wheat (10.7%), KBW Bank Index (6.7%), Dow Jones Transports (5.3%), Nikkei 225 (1.7%) and the SOX Index fell (4.5%)
April 3, 2022
by Rob Zdravevski
rob@karriasset.com.au