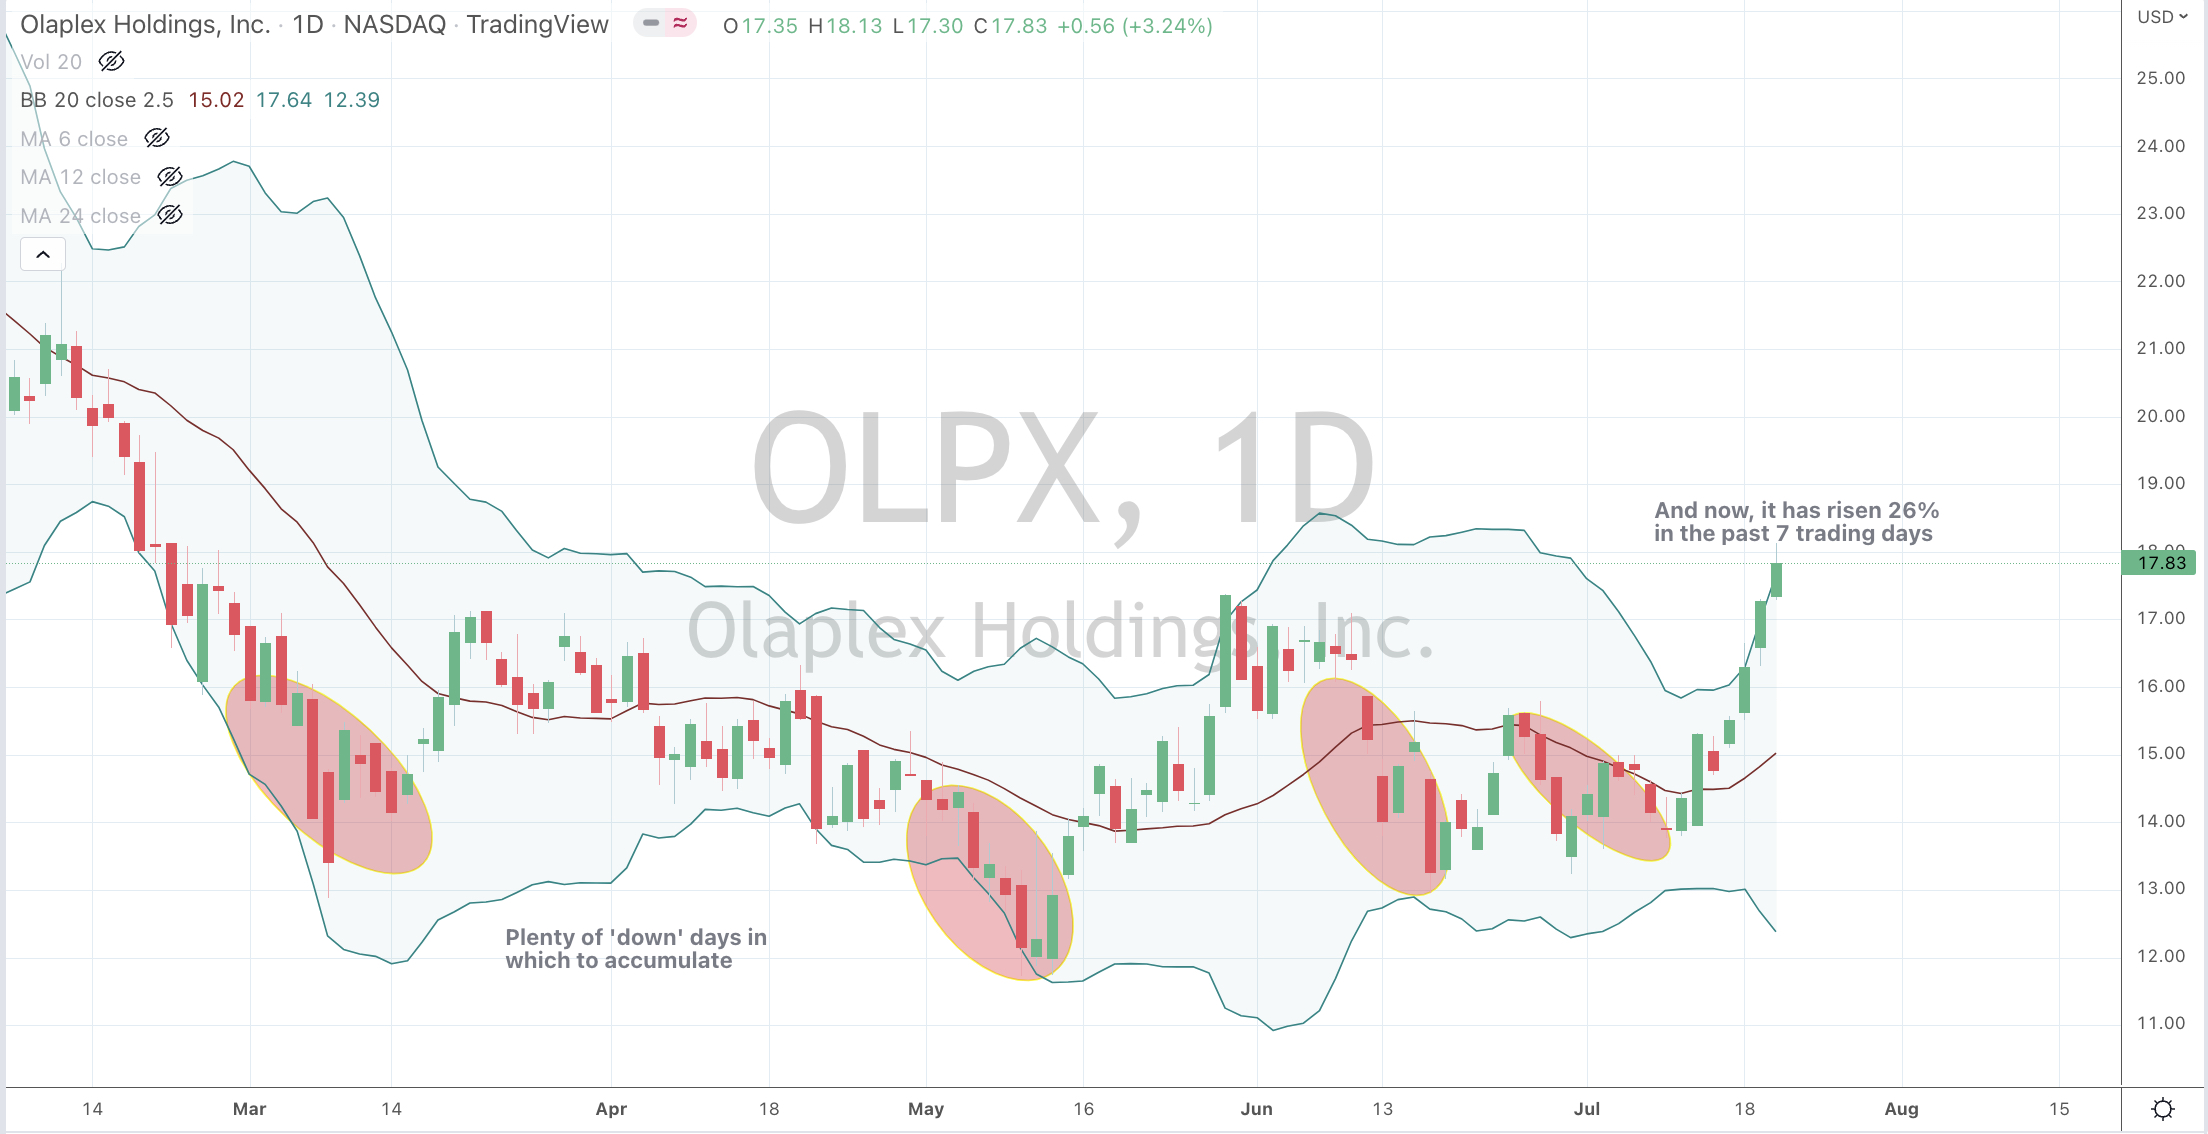
In the chart below, U.S. listed Olaplex has risen 26% in the past 7 trading days.
Short covering, momentum buying, benchmarking pressure….blah blah blah….are all some reasons for the spike in many stock prices over the past few days.
Heck, Citigroup has climbed 18% in 4 days,
Following a challenging couple quarters or lagging performance and lower fees, do you think is plausible fund managers lock in those gains, especially considering the comparative return of cash or the index?
Look for these types of stocks to give up perhaps half of the recent gains, in the coming days.
My view that interest rates would rise was derived from a combination of a some type of reversion to a ‘norm’ along with a belief that inflation would become evident due to an eventual increase in prices driven by ‘output gaps’.
This led to my ‘correlated’ comment suggesting being long various commodities would position investors well for such a move.
The commodities listed in that post rose between 25% and 80% in a short period of time.
The inflation trade has already occurred and the continued media hubbub is only reporting what has already played out.
Recently bond yields have overshot and probability lends itself to them falling. More on that in an upcoming note, where I’ll reference the recent peak in rates correlating to a peak in inflation and commodities prices. Albeit that turn has started, in those same commodities (and many others) listed.
To be clear, I think that inflation abates, not collapses.
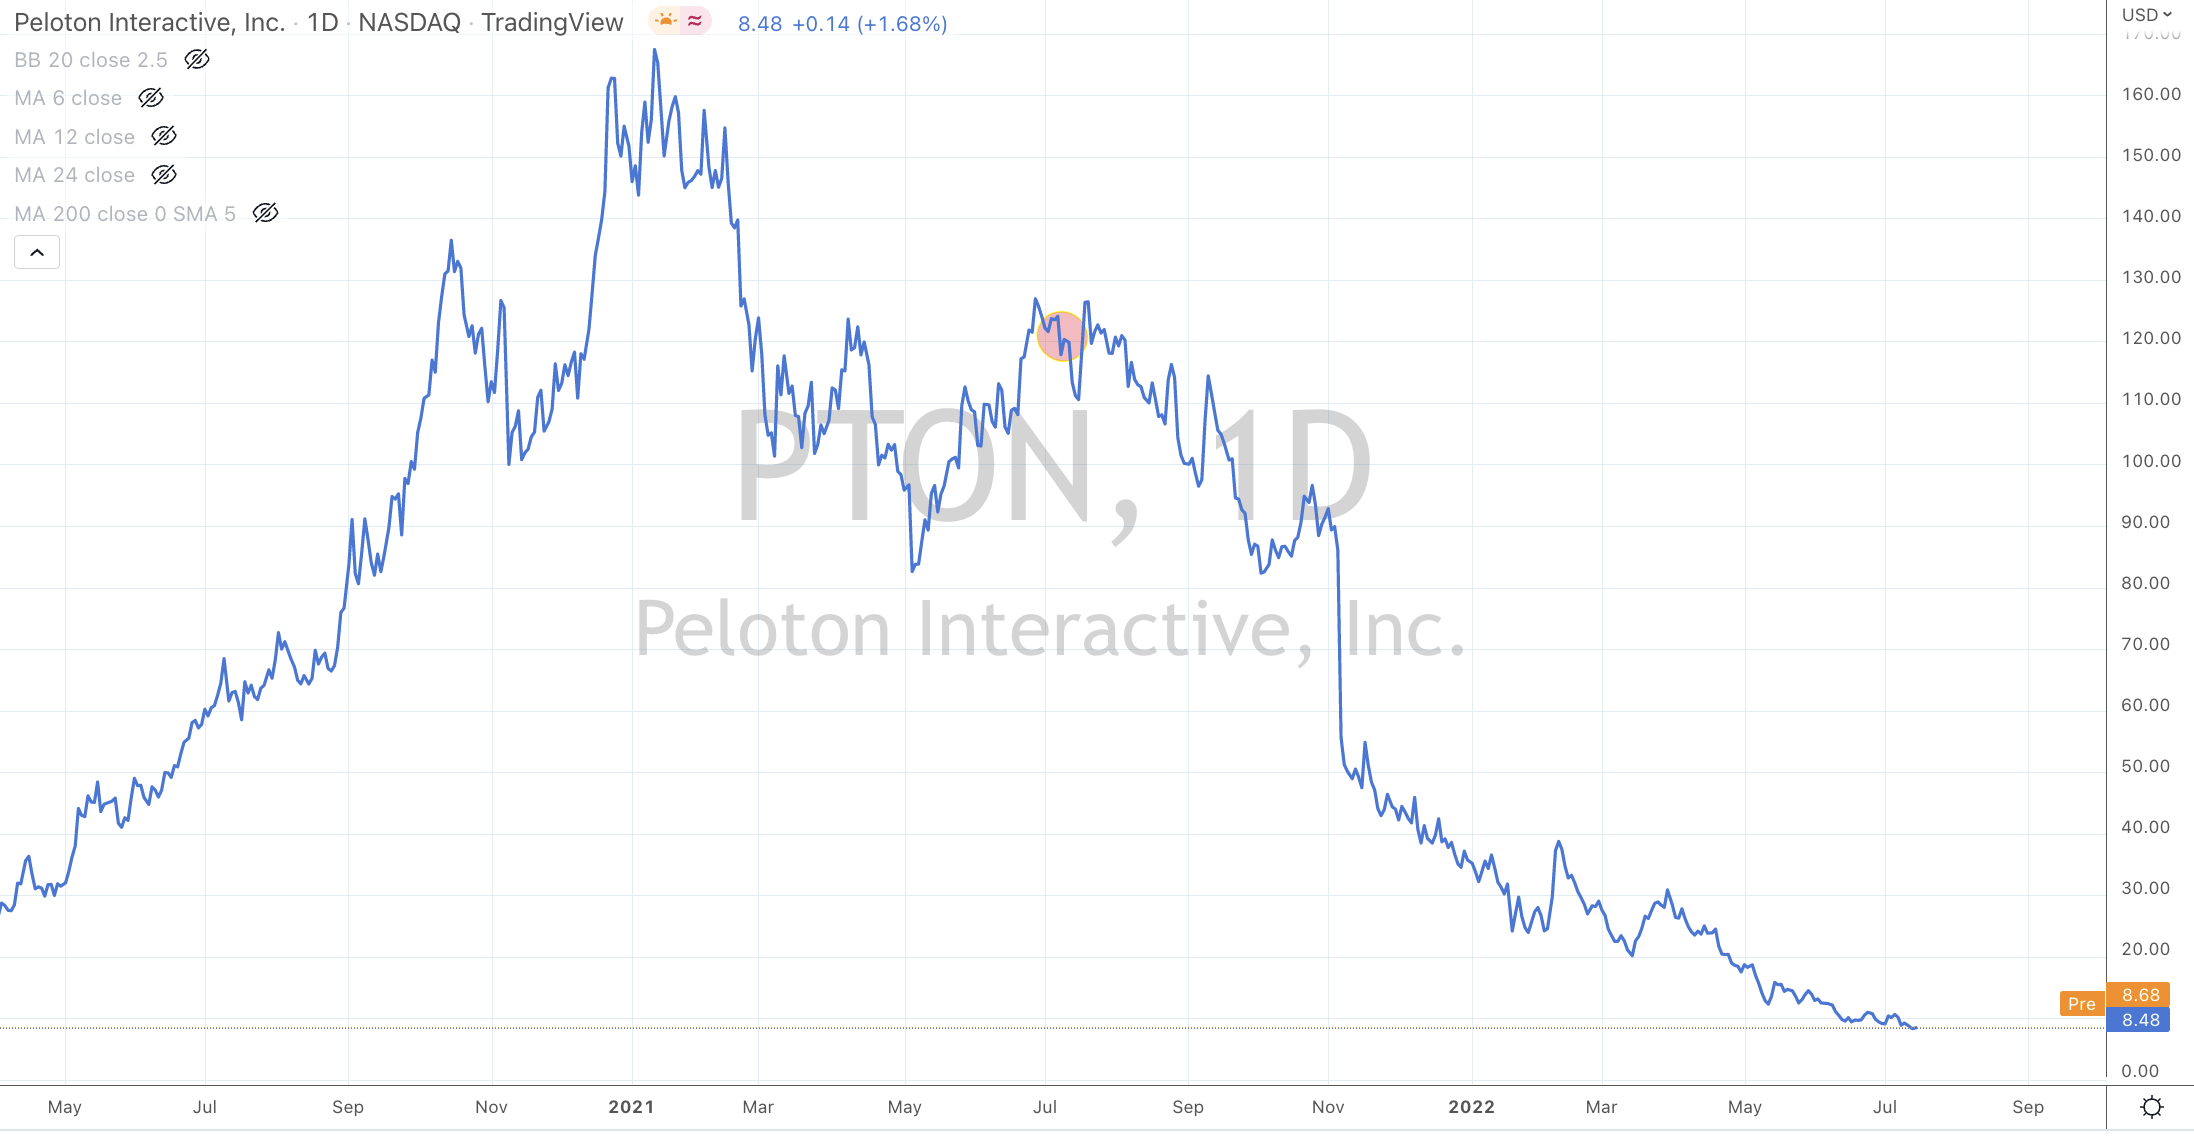
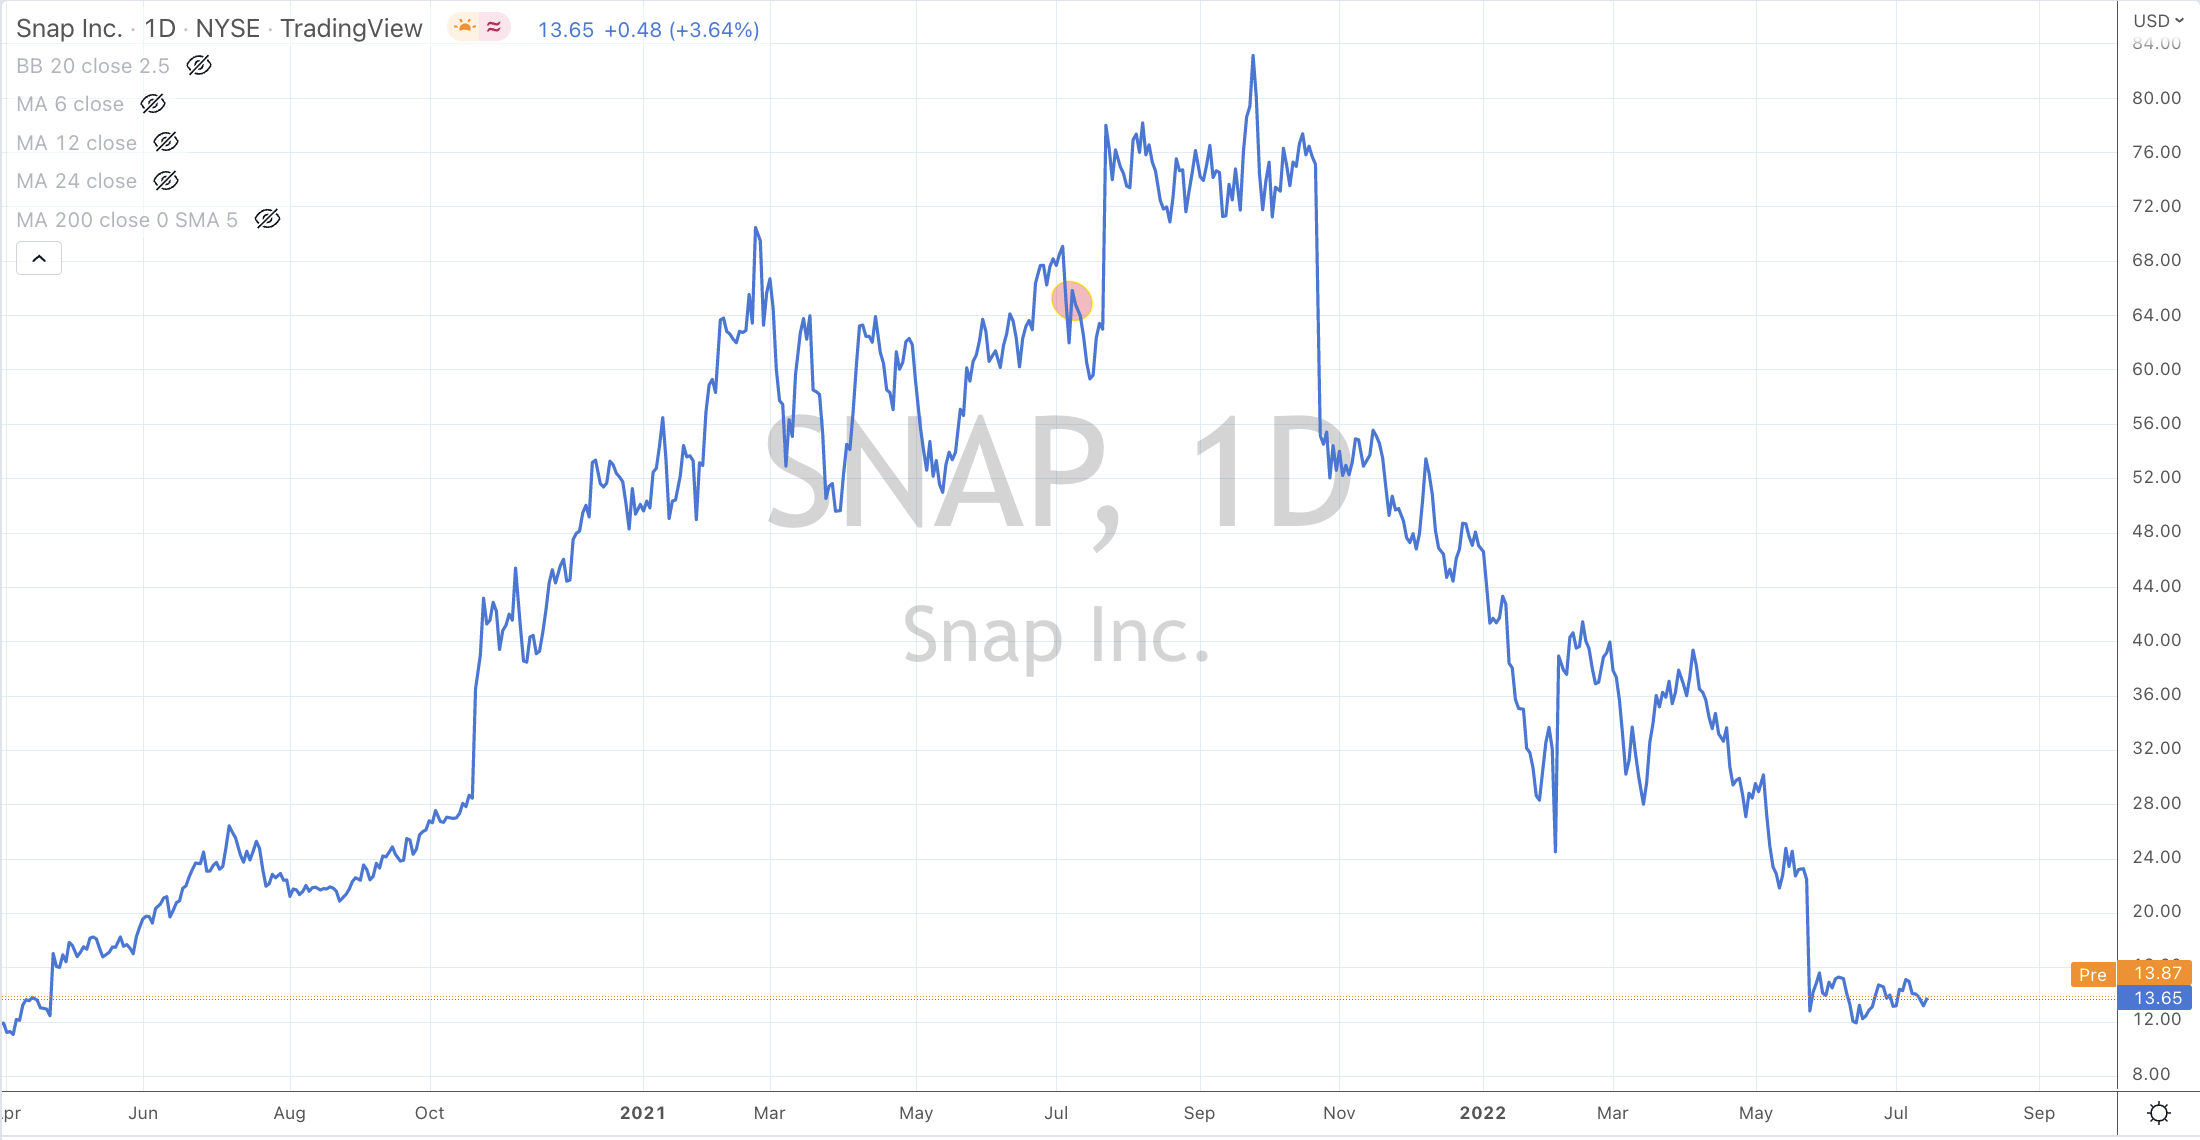
The other cryptic quip in that July 2021 post mentioned a ‘ballsy’ trade shorting technology stocks which were then trading at nutty price to revenue multiples.
The stock samples I mentioned in that original post (July 9, 2021) were Peloton, Snap and Pinterest.
When they were respectively trading at $120, $66 and $77 per share.
Today, they have plunged to trade at prices of $8.50, $14 and $20, respectively.
All 3 charts are attached below have circles around their July 9, 2021 prices.
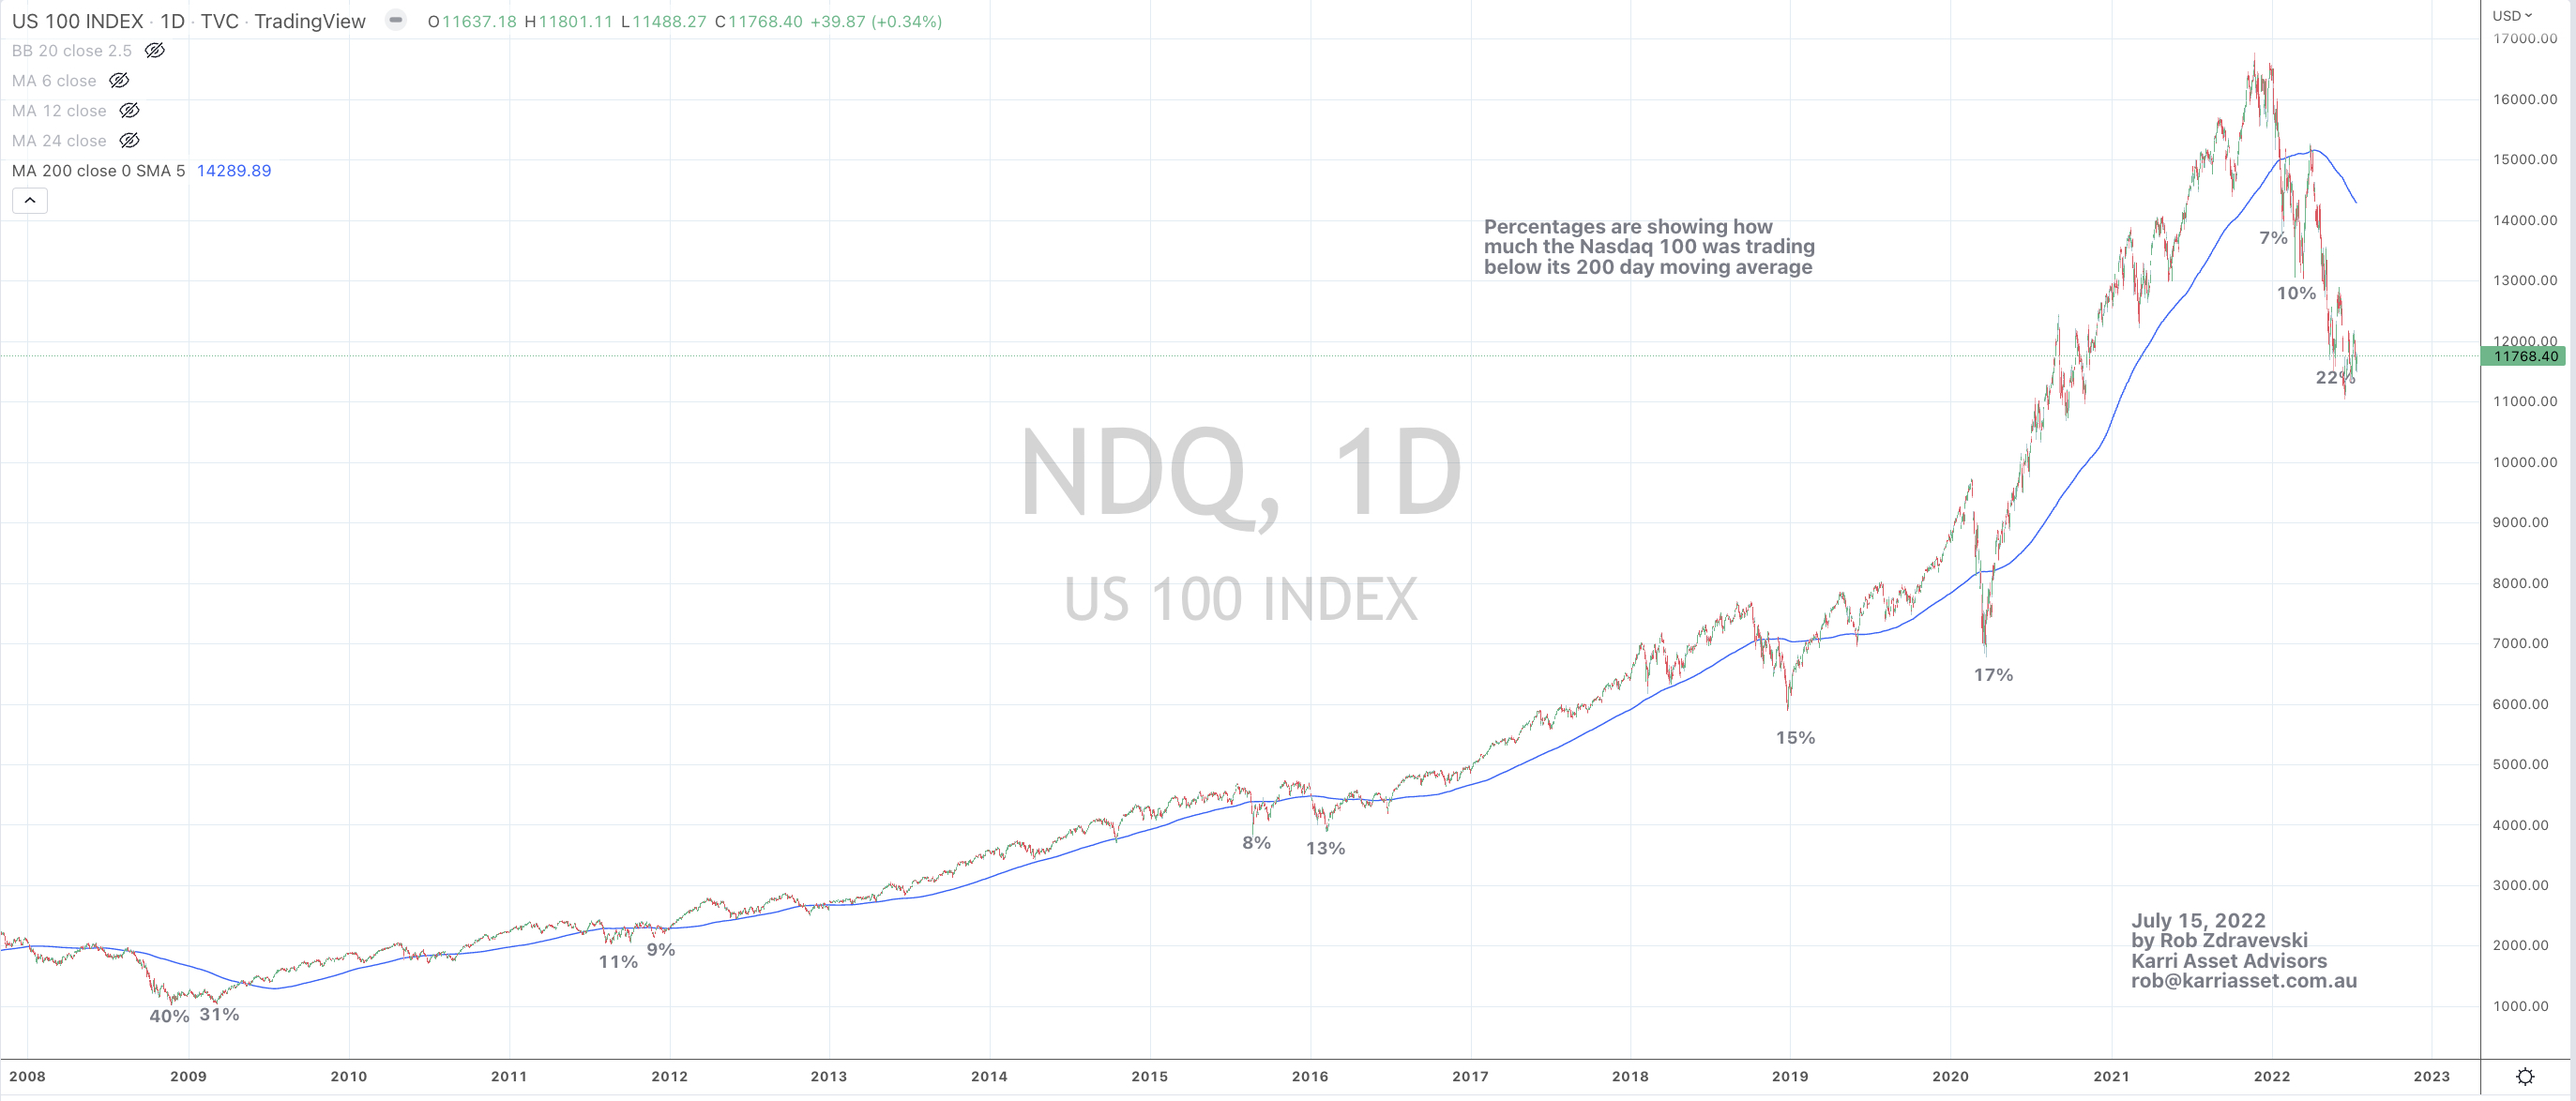
When U.S. 10 year bond yields started breaking above 1.8%, many more technology stocks commenced a concerted cascade.
A host of tech stocks are now poised to mean revert higher (not lower). They have been bludgeoned to the point that they traded to, through and mightily below their long term means.
What if organisations seek greater cost cuts to offset wage and price inflation by employing and exploring more technological replacements and alternatives?
What if political pressures fold to ‘re-embrace’ globalisation in order to reduce the cost of living?
What if more commodity prices mean revert?
What if supply chains repair and shorten?
well…….interest rates will decline again and inflation will ease.
Although many can’t see that case amidst today’s environment, technology stocks will benefit in such a scenario.
p.s. banks will make a fortune, as I predict that while they are swift to increase interest rates commensurately to central bank hikes…..they won’t be so accommodating to reduce the cost of borrowing should either central banks become dovish or if credit market yields ease.
p.p.s. the decline in commodities will be selected as some are already finding their lows (see my recent Macro Extremes weekly note)
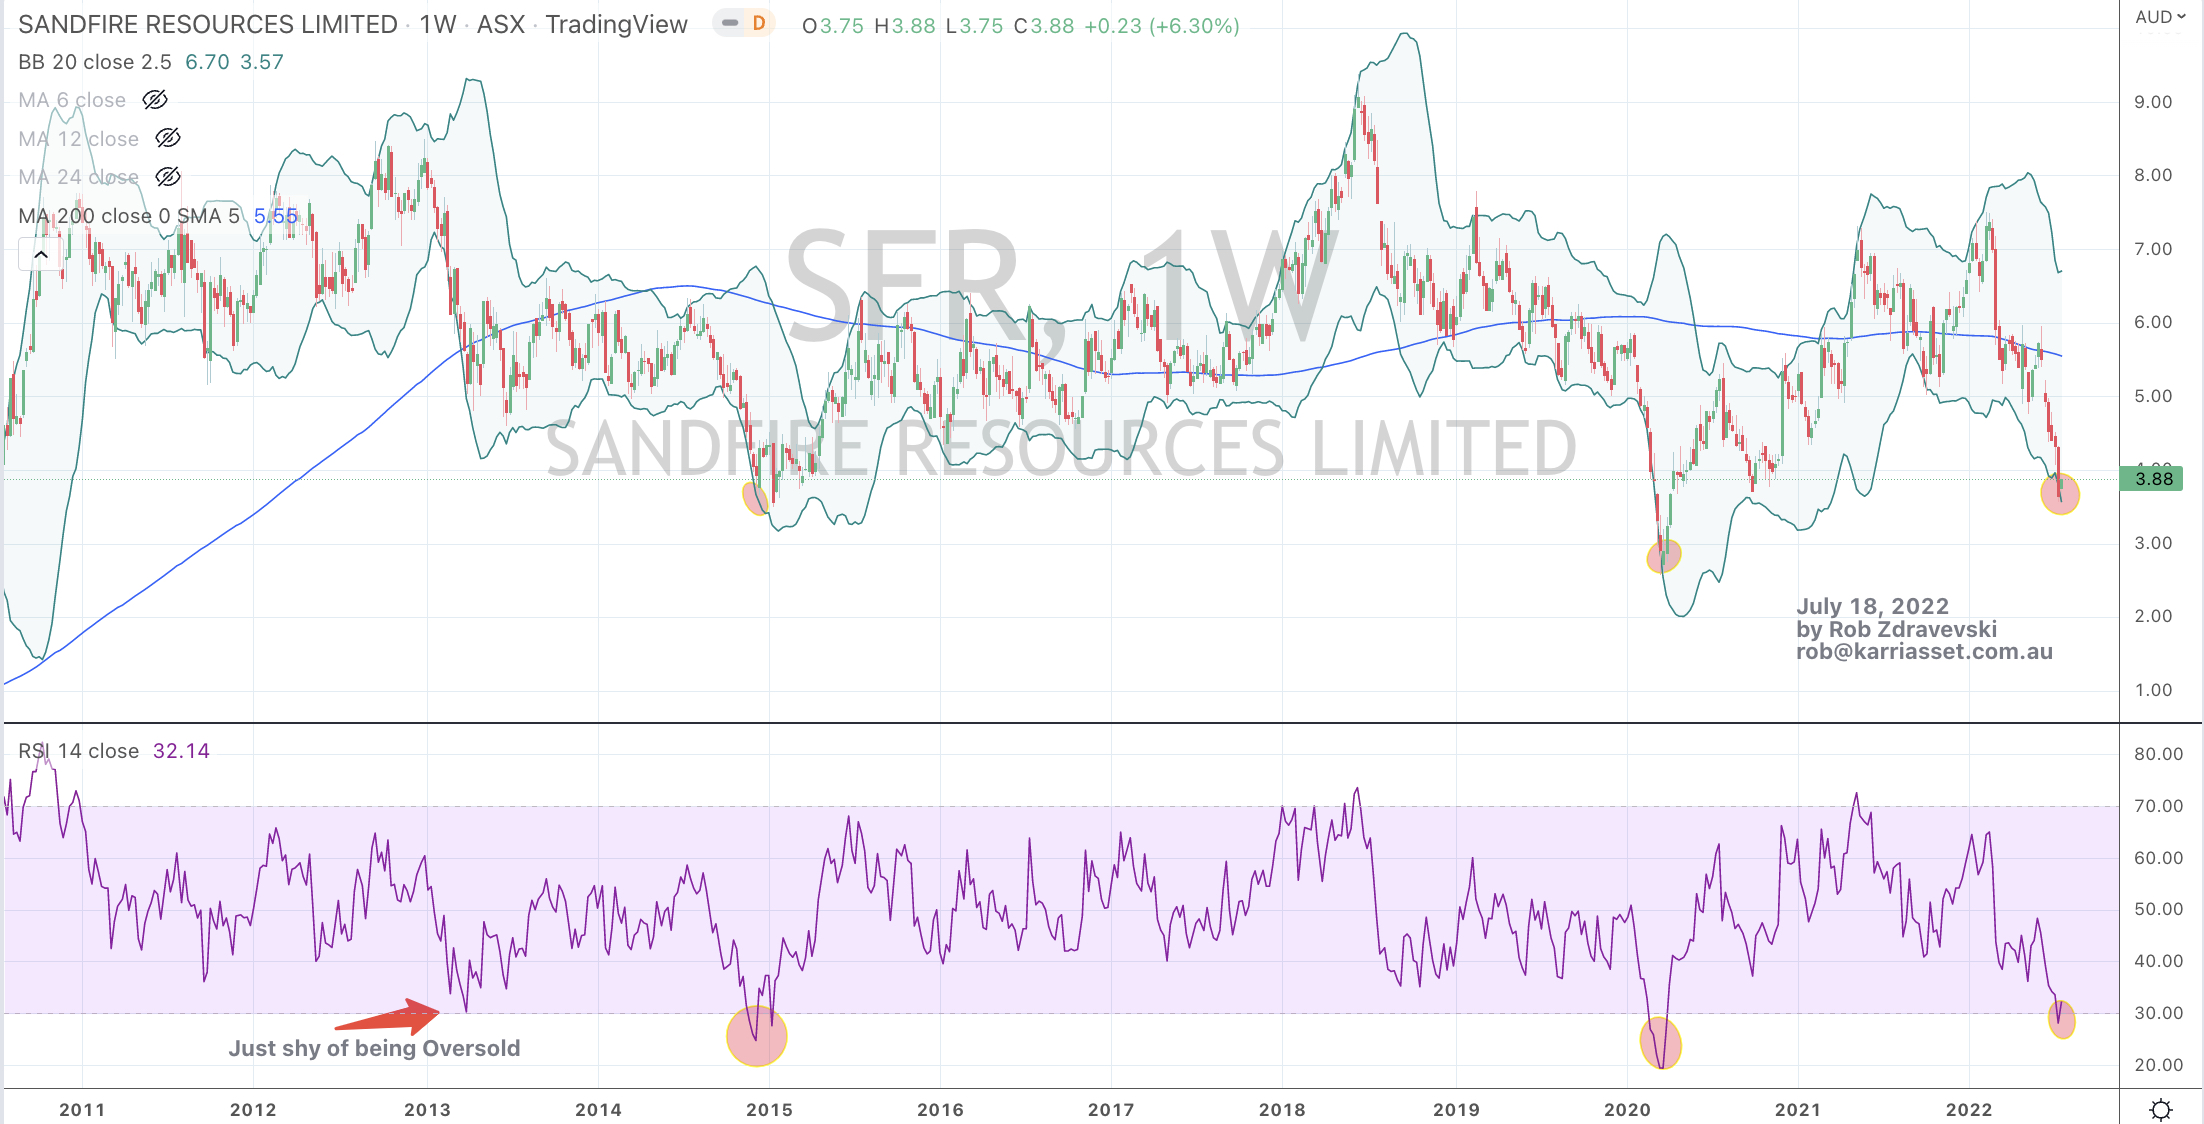
The attached chart shows circles that coincide with moments when the price of Sandfire Resources (SFR.AX) has traded 2.5 standard deviations below its weekly rolling mean, touched its 200 week moving average and registered a weekly Oversold reading.
This price action mimics the decline and low in the price of Copper.
Remember that ‘electrification’ theme mentioned a year ago?
It’s now 40% cheaper.
An added benefit is that Copper sales made in U.S. Dollars are sweeter with an even lower Australian Dollar.
July 18, 2022
by Rob Zdravevski
rob@karriasset.com.au
this is not personal advice. see my disclaimer. seek your own advice, pay for some or do your own work before finalising an investment decision.
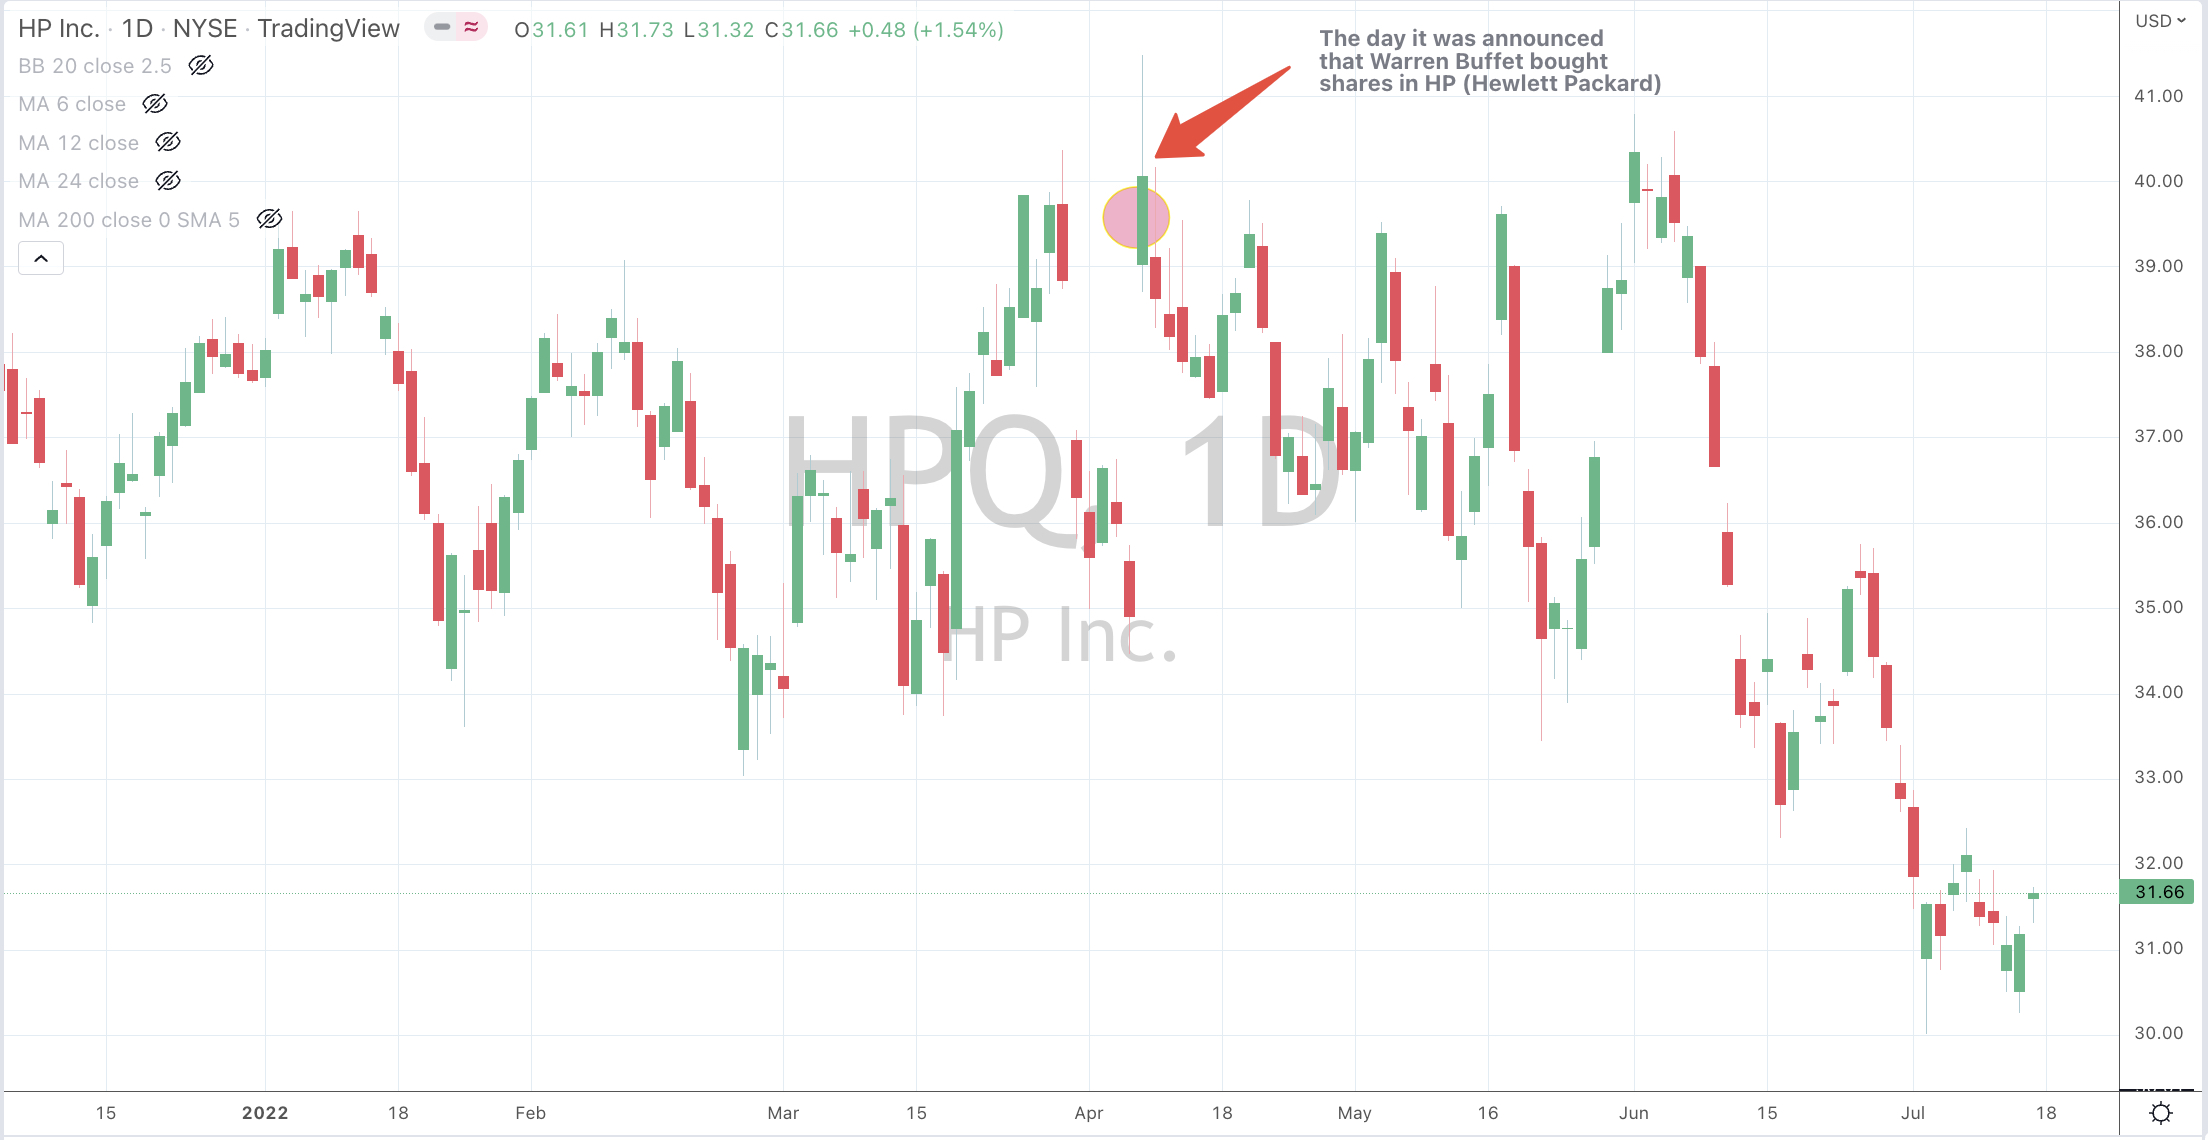
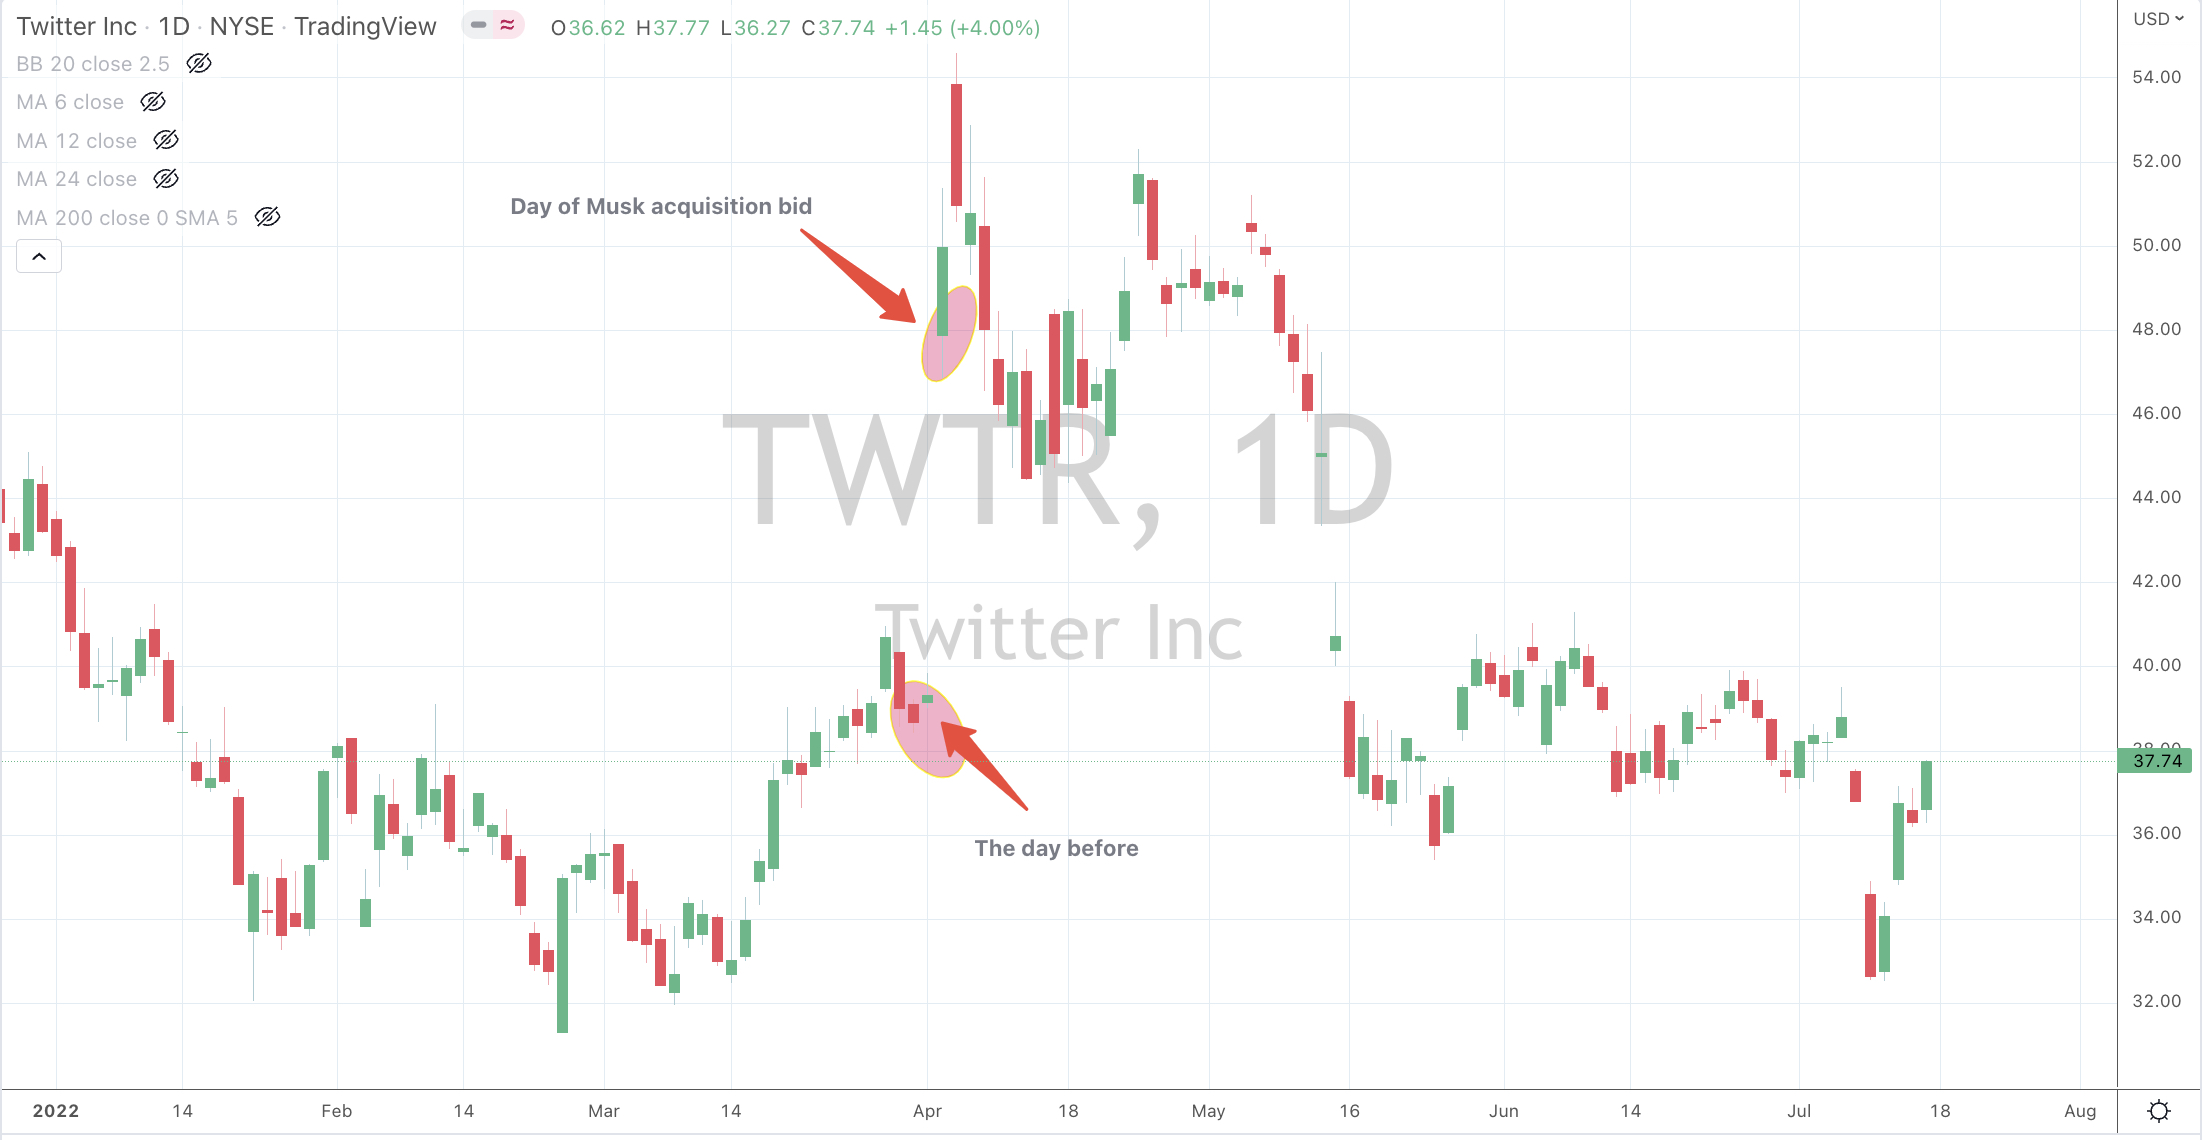
3 months on, the prices of HP and Twitter are both at least 24% lower than the morning when Buffet and Musk appeared in the headlines are a buyer or suitor of the aforementioned stocks.
It’s a reminder to speculators to do your own work or forfeit the right to complain when a stock loses a quarter of its value. Perhaps those ‘celebrity investors’ are buying stock on better terms that you or for other reasons.
Even at today’s ‘lower prices’, one should still do their research.
The following assets (on a weekly timeframe) registered an Overbought or Oversold reading and/or have traded more than 2.5 standard deviations above or below its rolling mean.
Extremes “above” the Mean (at least 2.5 standard deviations)
None
Overbought (RSI > 70)
U.S. 2 year government bond yields
The Overbought Quinella – Both Overbought and Traded at > 2.5 standard deviations above the weekly mean)
U.S. Dollar Index
Extremes “below” the Mean (at least 2.5 standard deviations)
Bloomberg Commodity Index
Cocoa
WTI Crude Oil
Gold futures (current contract)
Coffee
Brent Crude Oil
Soybeans
Wheat
CAD/USD
Oversold (RSI < 30)
Hot Rolled Coiled Steel
Tin
Silver (in USD)
South Korea’s KOSPI equity index
Taiwan’s TAEIX equity index
Russia’s MOEX Index
Canada’s TSX Index
GBP/USD
IDR/USD
The Oversold Quinella – Both Overbought and Traded at > 2.5 standard deviations above the weekly mean)
U.S. 10 year minus 2 year bond yield spread
Copper (and 200 WMA)
Copper/Gold Ratio
Chilean Peso / U.S. Dollar (4th consecutive week)
DKK/USD
SEK/USD
INR/USD
JPY/USD
KRW/USD
EUR/USD
Notes & Ideas:
Note the lack of ‘entrants’ in the Overbought end of the Extremes.
The action is in the Oversold section.
This week’s biggest news is the continued decline in various commodities, joining the mean reversion chorus.
For example; Wheat, Soybeans, Corn and Oil are now at prices lower than before the Russian invasion of Ukraine.
Bond yields acted somewhat correctly by falling, meaning bond were being bought more aggressively in light of growing pessimism.
The Canadian central bank acted rashly by raising rates by 1% influenced by G-10 counterparts, rather than commencing their hiking stance15 months ago when most other commodity centric economies where doing so.
While we saw quiet, benign and perhaps consolidating action in most equity indices.
In earlier posts, I question ‘what if the lows (in equities) have already been seen”?
The Euro made new lows, again…as did the Yen and the Aussie, as the latter heads towards 0.6570.
The Korean Won and the Korean KOSPI returned to being oversold..
The U.S. yield curve remains inverted for the 2nd week in a row but this time, it has touched the quinella of a weekly Oversold and 2.5 deviations below its weekly mean.
This occurrence has been a good signal for the longer term accumulation of equities, as mentioned in this post.
Gasoline has declined 20% in 3 weeks. Other commodities in the energy complex continue to weaken, expect for Natural Gas which I called a bottom for recently, citing ‘taking the fat part’ of the short trade from $9.40, as it had recently halved. Nat Gas has risen 22% in past 2 weeks.
Coffee fell a further 10% (recall my call in past editions for it to halve) while I expect Cattle prices to decline next.
However, there should be a pause in the decline in the ‘softs’. Lower prices is not a one-way street as you’ll see some of (including Oil) appearing in the < 2.5 SD column in this week’s list.
The CRB Index posted another losing week as a heavy weighting to energy affects this index more than others.
All of this is aiding the case for an easing in inflation.
The weakness in Gold and Silver in both USD and AUD was also noticed. Silver in AUD has mean reverted, A$26.50 in an entry point I’ll analyse.
In equity indices the Italy’s MIB, Brazil’s Bovespa, the S&P MidCap 400 and S&P 600 SmallCap are also approaching Oversold.
Last week, I mentioned that I expect a ‘double dip’ in some indices and listed some prices.
The larger advancers over the past week comprised of;
Baltic Dry Index 4%, Tin 3.7%, Natural Gas 16.2%, Philadelphia Semiconductor Index (SOX) 2.9%.
The group of decliners included;
Australian Coal (2.1%), Bloomberg Commodity Index (2.1%), China Coal (5.6%), WTI Crude (6.9%), Gasoil (1.9%), Gold futures (2.2%), Hogs (18%), Copper (8.2%), JKM (7.9%), Coffee (9.4%), Lumber (8.2%), LNG (6.6%), Nickel (4%), Orange Juice (7.9%), Palladium (15.2%), Platinum (5.9%), Gasoline (6.8%), Rubber (1.7%), Silver (3.3%), CRB Index (3.5%), Cotton (6%), Dutch TTF (8.9%), Brent Crude (5.8%), Urea Middle East (5%), Uranium (3.6%), Silver in AUD (2.3%), Silver in USD (3.2%), Gold in USD (2%), Corn (4.6%), Oats (5.3%), Soybeans (10.2%), Wheat (12.9%), Shanghai (3.8%), CSI 300 (4.1%), MIB (3.9%), HSCEI (7.9%), HSI (6.6%), IBEX (1.9%), Bovespa (3.7%), MOEX 95.1%), Oslo (2.2%), Helsinki (2%), Stockholm (3.4%), TSX (3.3%) and the Nasdaq Biotechnology Index fell 2%.
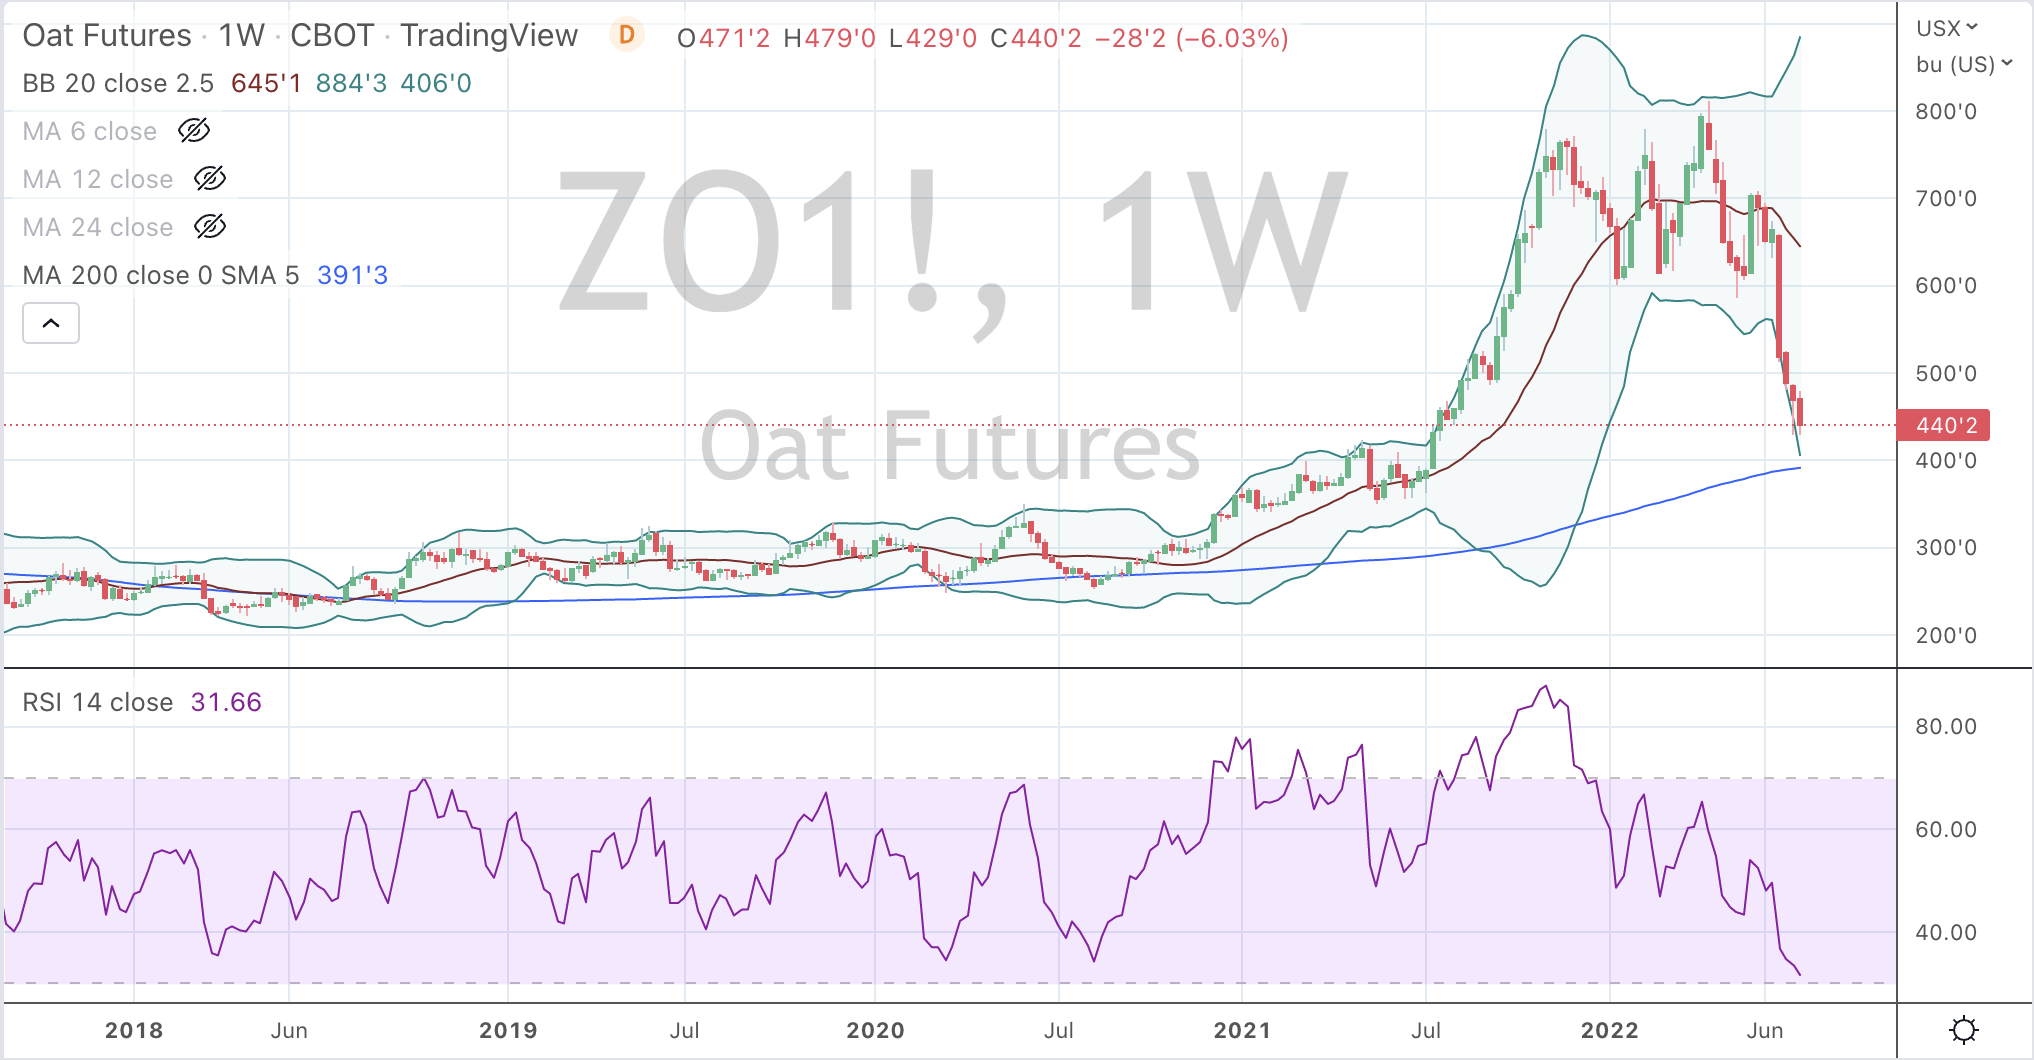
This weekly price chart of Oats tells me its set up is looking good for a low around the $3.94 mark in the coming 2-3 weeks.
A further decline of 10% is sympathetic to the trajectory of other ‘softs’ such as Rice, Wheat, Corn and Soybeans.
I think Cotton and Coffee have substantially more to downside than others. More on that in a future note.
The price of Oats nearly trebled through 2020- 2021 and then stayed elevated for 6 months.
However, this is a story about;
not chasing prices which are at extreme percentages above whatever mean you choose to obey;
observing euphoria and not running with the herd;
if you did, take the ‘fat part of the trade’ and;
allow for the probability of mean reversion.
Furthermore, farmers would have been well advised that an extreme run in price is often short-lived before considering crop rotation,
as would have buyers of agricultural land.
It was a sellers market.
When we combine an increase in inventories and higher fertiliser prices amidst a mid-cycle slowdown, prices are now declining towards the other end of the pendulum.
Canada is the world’s largest exporter of Oats, Russia is the largest grower whilst the U.S. and Germany account for 50% of the global Oats import market. Oats yield 50% more per acre than Wheat.
Lower Oats prices will benefit the likes of Kelloggs, Hain Celestial & Nestle.
Those ‘middle-men’ who have built up inventories will soon (next 6 months) be seen selling at a discount or loss.
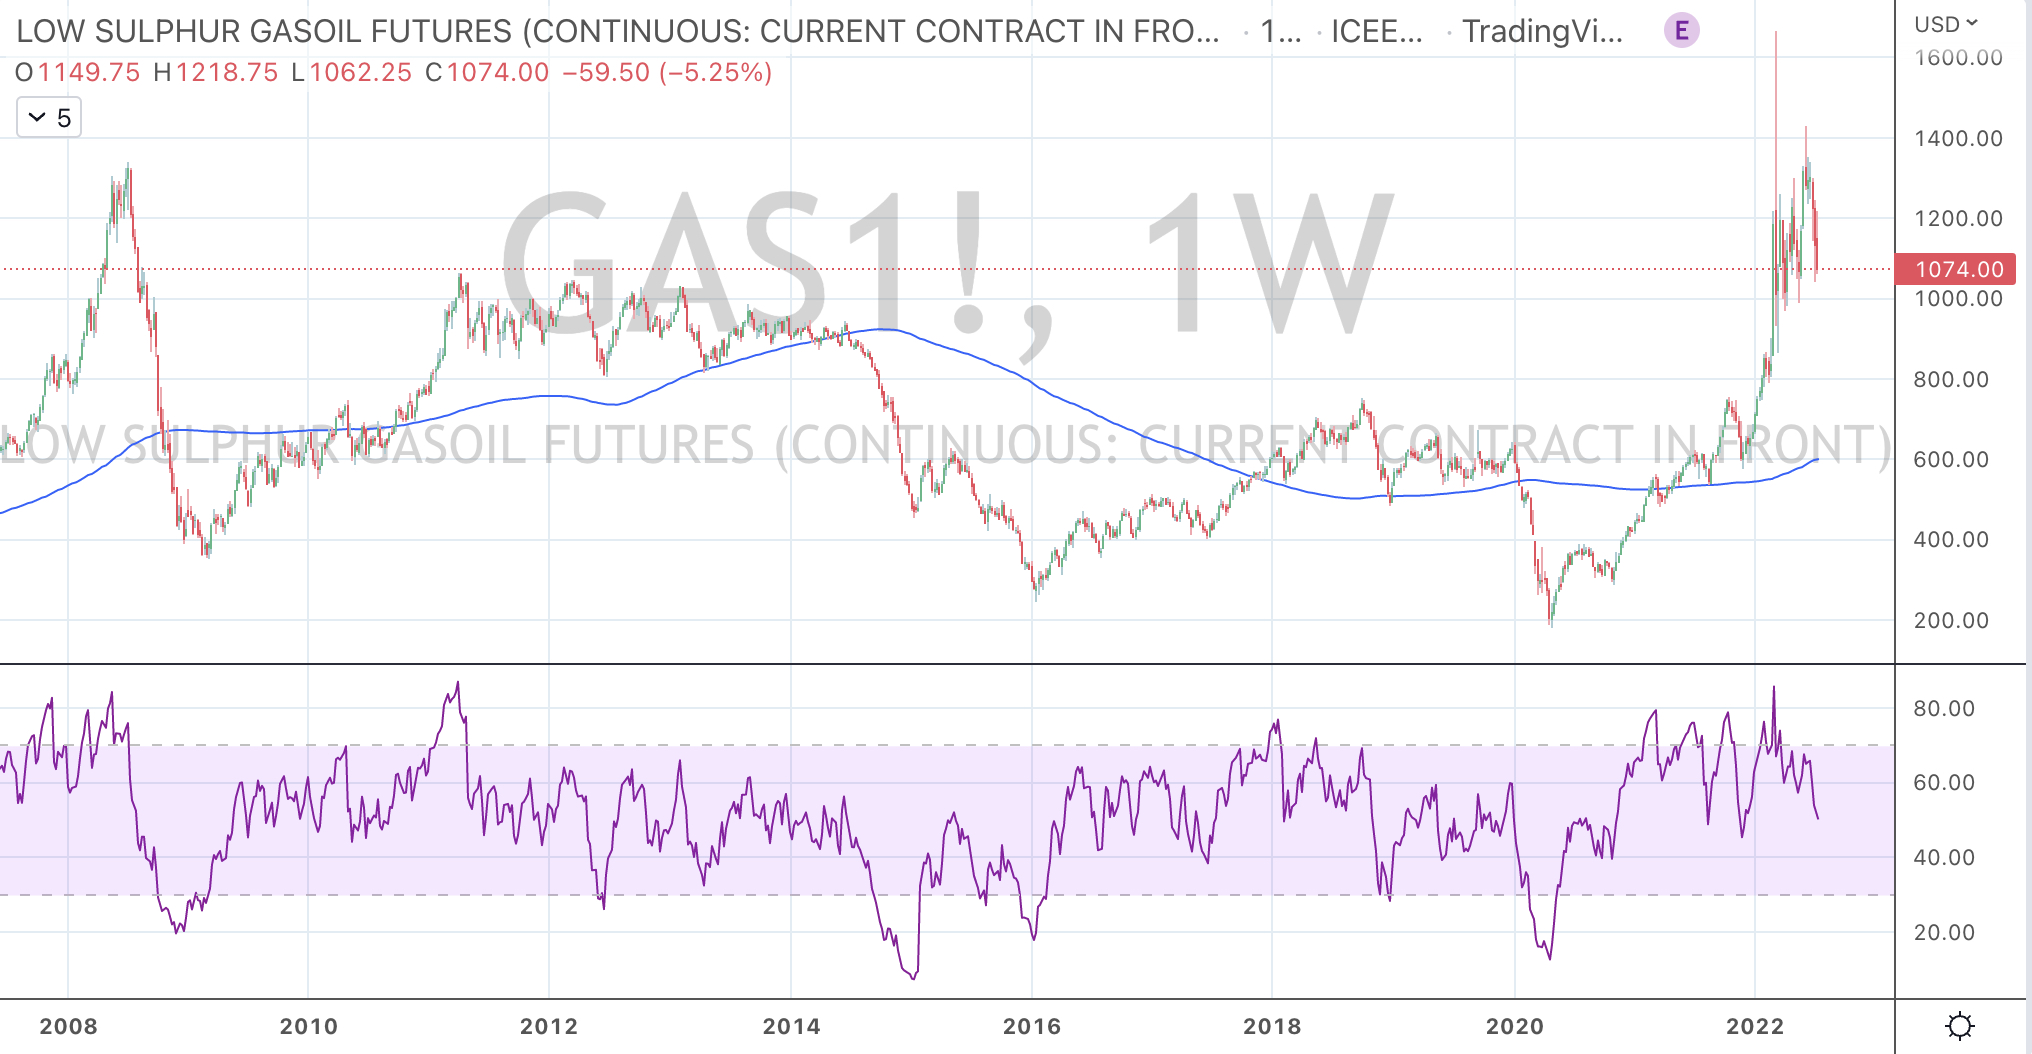
What if the price of Gasoil (diesel, distillate) halves?
Since March 2020, the price of Gasoil rose 7-fold.
But the real entry point for the ‘long’ trade was when it was meandering around $300 some 2 years ago.
Recently and today was not a time to be a buyer either.
The chart below shows that the Gasoil has already declined 40% from the recent highs which has been driven by various energy scarcity tensions.
For more than a year, I’ve been wittering about mean reversion and the 200 week moving average and how it (more so) beckons prices following parabolic price moves.
I’d say a 700% rise within 2 years could qualify for ‘parabolic’.
While Gasoil fell 9% last night to close at $1,074, what if it makes its way towards $600 and greets that 200 week moving average?
That’s a further decline of 44%.
Firstly, it would be deflationary.
Secondly, it will be beneficial to trucking companies.
Transportation indices and respective trucking stocks have been hammered.
Any decline in Gasoil prices will aide margins of trucking companies.
If I’m wrong and if the Gasoil price consolidates or rises, those stock prices have already factored in a drop in profits.
When supply chains shorten, trucking companies will have an added boost.
Keep in mind, that average will turn (relatively) higher soon, so let’s watch for a $650 target in the coming few months.