Watching Palladium
June 13, 2022 Leave a comment
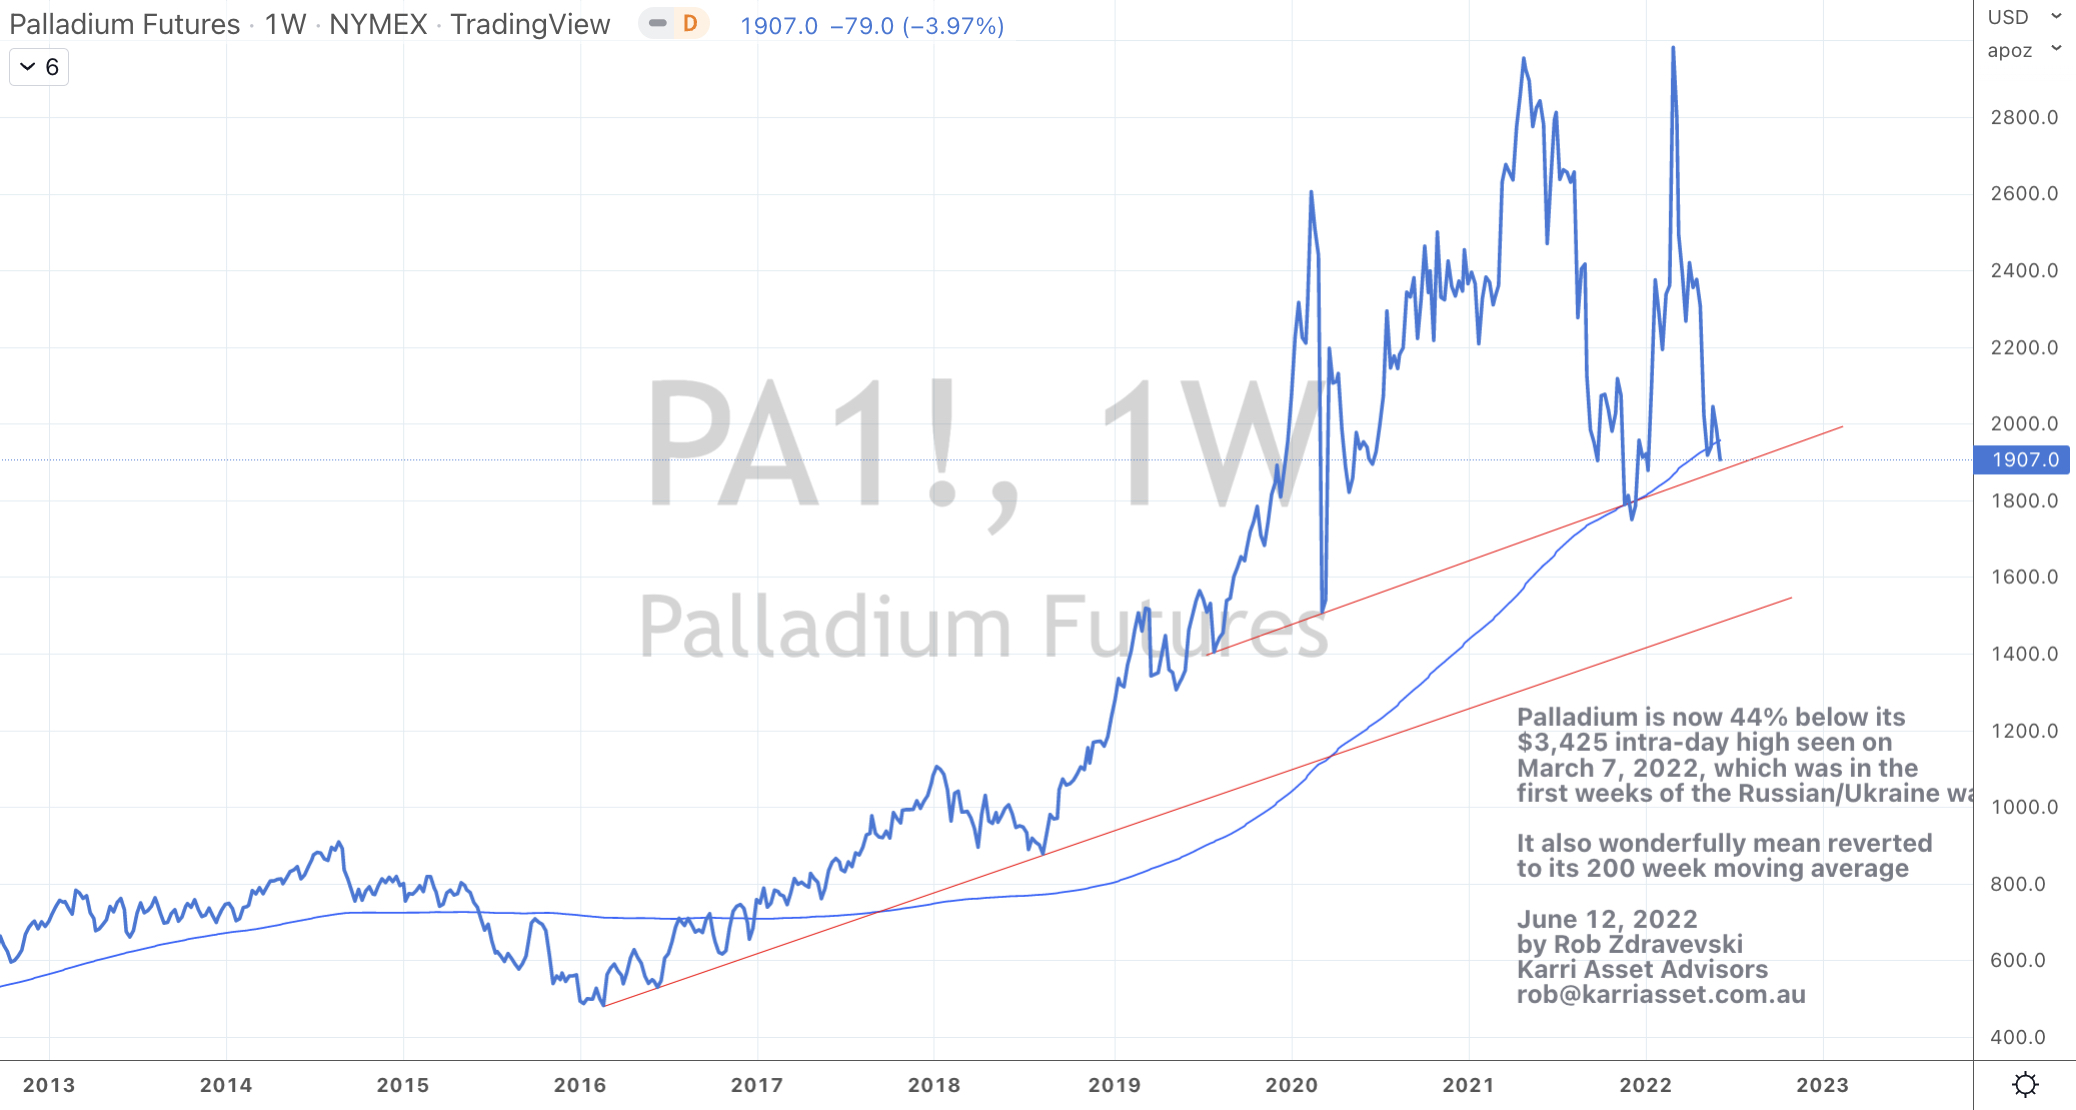
This chart of Palladium shows the risk of chasing asset price spikes at moments when the herd is reacting to news events.
It also shows the power of mean reversion especially when prices trade in a parabolic manner.
Lastly, that ‘blue line’ is also an illustration of not anchoring yourself to ‘last years’ prices.
In other words, even though the price has fallen 44% in the past few months, that long term, 200 week moving average is no longer trading at $800, instead that mean has rolled higher and is now $1,960.
As far as the Palladium price is concerned, the $1,500 mark is a point where sellers may ‘wash’ themselves out.
June 13, 2022
by Rob Zdravevski
rob@karriasset.com.au