A different yield curve to watch

When the spread (or yield curve) of the U.S. 5 year government bond yield <minus> 3 month yield is overbought on a Weekly RSI, it closely (and tactically) signals a peak in the S&P 500.

The S&P 500 is not a peak at the moment. Buyers of put options and callers of an equity crash perhaps take note!

There were two exceptions in 2013 when this wasn’t the case. I’ll look into this a little later.

Incidentally, an Oversold yield curve isn’t an inversely reliable timing indicator.

September 11, 2022

by Rob Zdravevski

rob@karriasset.com.au

Extremes in JGB yields are S&P 500 Buy/Sell signals

A month ago, I published this study highlighting the correlation whenever Japanese 10 year bond yields are overbought and oversold happen to signal a corresponding low or high in the S&P 500.

Macro Extremes (week ending September 9, 2022)

The following assets (on a weekly timeframe) registered an Overbought or Oversold reading and/or have traded more than 2.5 standard deviations above or below its rolling mean.

Extremes “above” the Mean (at least 2.5 standard deviations)

U.S. 30 year government bond yield

EUR/GBP

Overbought (RSI > 70)

U.S. 2 year government bond yield

Spanish, French and Italian 10 year government bond yield

TBT

The Overbought Quinella – Both Overbought and Traded at > 2.5 standard deviations above the weekly mean)

U.K. 10 year government bond yields

U.S. 20 year government bond yields

German 2 & 5 year government bond yields

Extremes “below” the Mean (at least 2.5 standard deviations)

CAD/USD

SGD/USD

Oversold (RSI < 30)

U.S. 5 year minus U.S.3 month government bond yield ‘spread’ (not inverted)

TLT

Tin

GBP/USD

The Oversold Quinella – Both Overbought and Traded at > 2.5 standard deviations above the weekly mean)

CNH/USD

KRW/USD

JPY/USD

Notes & Ideas:

The big news for the week includes Government bond yield are amongst the ‘overbought’s’, the bounce in only some equity markets and the continued strength of the U.S. Dollar.

So telling is the strength of the USD, the Japanese Yen is now at a 24 year low against the USD. That’s September 1998. 

While the British Pounds seems to be the most weakest amongst the G7. It is registering extremes lows against the USD, EUR and the AUD…..I’ll take a look at buying Sterling.

In last week’s edition, I wrote;

Government bond yields are approaching their next round of being overbought, as are Cattle prices.

<the former are so, the latter is closing in>

Gold, Silver and Platinum are nearing buys, 

<Gold was flat, while Silver rose 4% and Platinum soared 7% for the week>

Last week I mentioned that the Shanghai Composite, Copper and the U.S. KBW Banking Index had traded back down to their respective 200 week moving average for the second time in as many months.

This week, they appear amongst the gainers.

In other notes, the DXY is no longer Overbought while Hot Rolled Coiled Steel moves out of Oversold territory.

Palladium, MidCap 400, the KBW Banks, Nasdaq 100 and S&P 500 all performed an Outside Bullish Reversal week. The Russell 2000 did not.

The HSCEI and Hang Seng made lower lows. Look for more weakness, which should culminate into a buying opportunity.

Aluminium and Copper both mean reverted to their 200 week moving average, with the latter doing so for the 2nd tine in as many months.

The Nasdaq biotechnology index is 23% above its mid-June 2022 intra-day low.

For perspective, much of the rise in U.S. equities merely recovered some or all of the previous week’s decline. 

For example, the MidCap 400 and SmallCap 600 fell 4% last week to see a 4% this week.

Similarly, the S&P 500 made up all of last week’s 3.3% fan with a 3.7% bounce. 

The Philadelphia Semiconductor Index fell 7.1% a week earlier and clawed back 4.7% this week

And while S&P 500 didn’t manage to revert to mean its 200 week moving average in mid-June 2022, it can do so in the coming weeks without creating a ‘lower low’ of the June prices.

The mean is rolling higher, which is knowns as convergence.

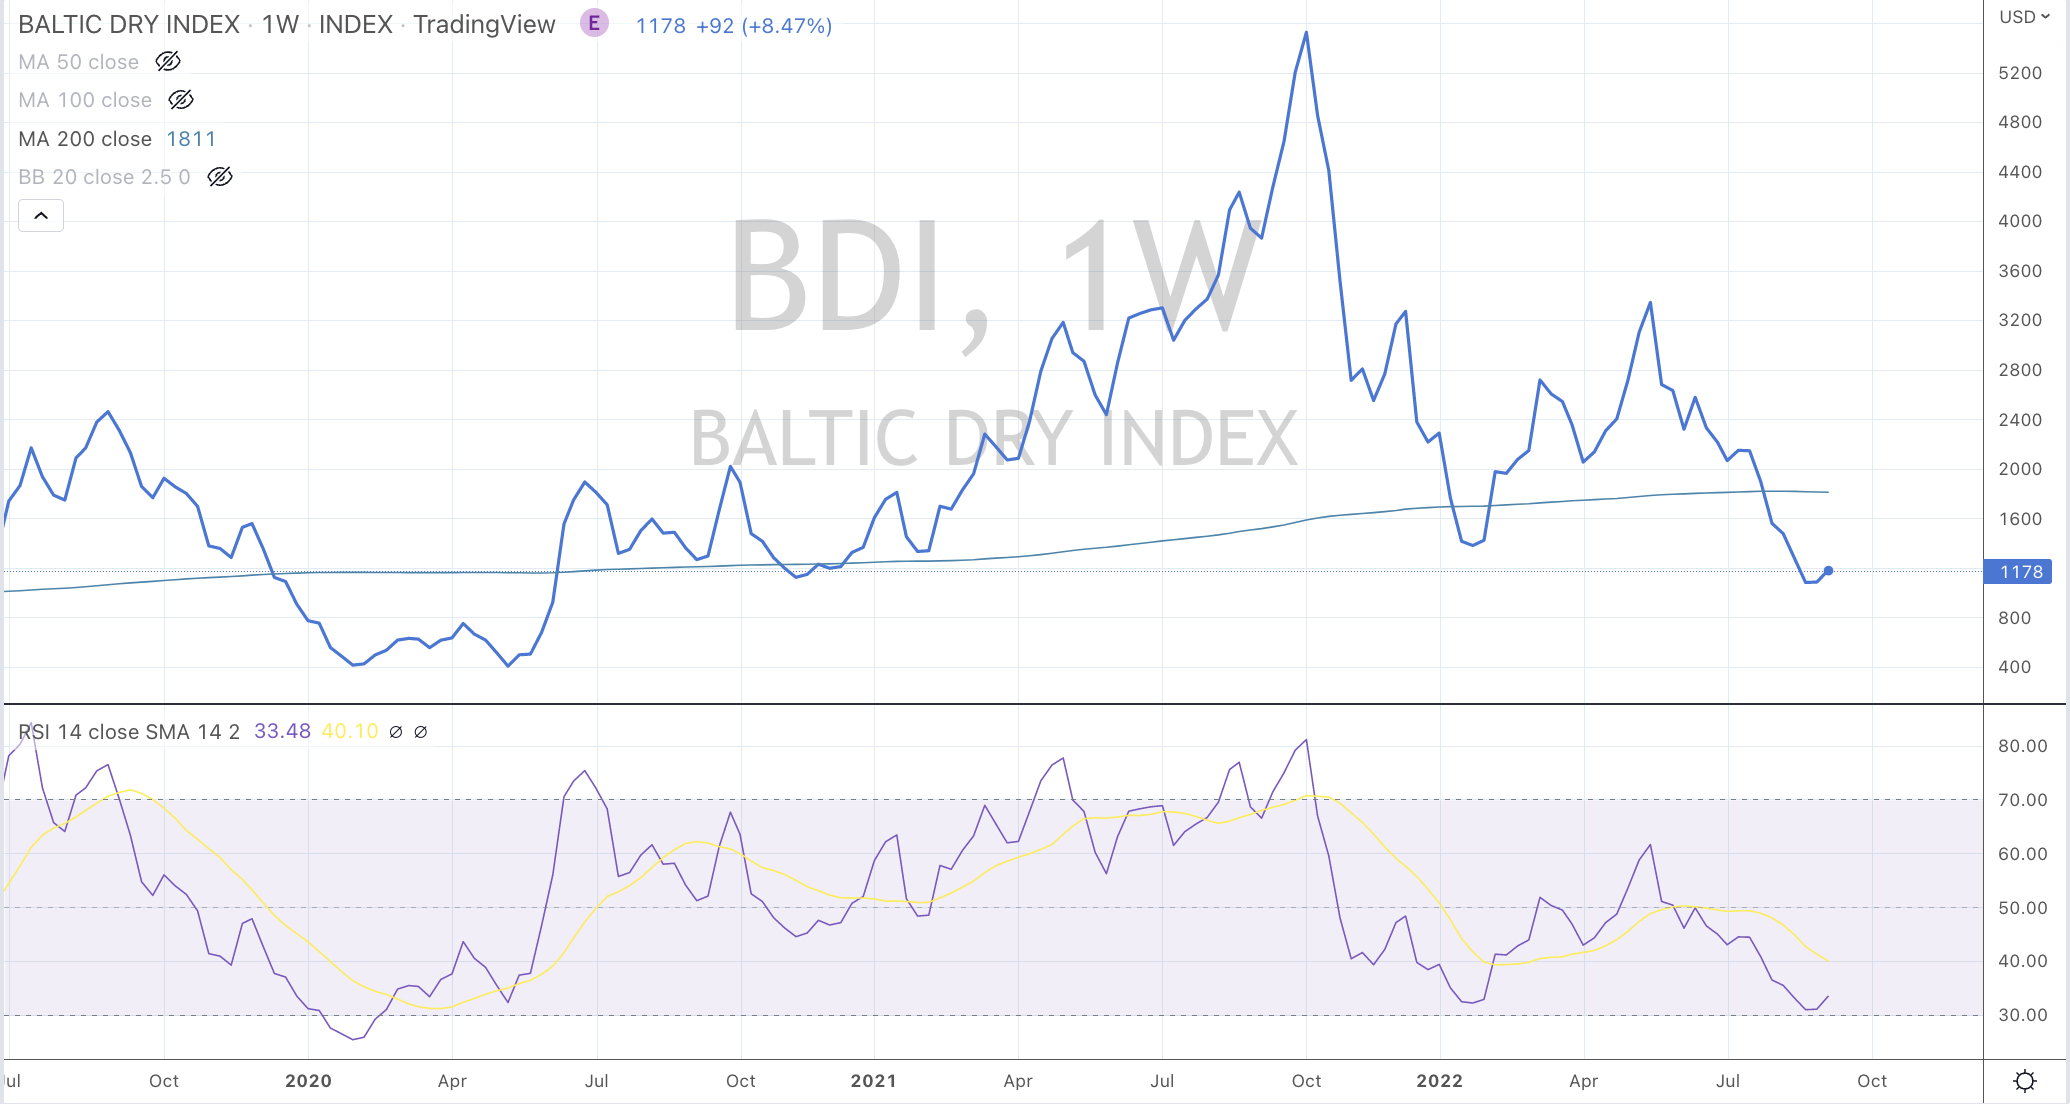
The larger advancers over the past week comprised of; 

Baltic Dry Index 11.7%, China Coal 6%, Lean Hogs 3.5%, Copper 4.5%, HRC 4.9%, Lumber 7.2%, Palladium 7.5%, Platinum 7.2%, Uranium 5.7%, Silver in AUD 3.8%, Silver in USD 4.3%, Corn 2.9%, Oats3.6%, Wheat 7.2%, Shanghai 2.4%, KBW Banks 5%, CSI 300 1.7%, Dow Jones Industrials 2.7%, DJ Transports 2.4%, S&P MidCap 400 4.4%, Nasdaq 100 4.1%, Nikkei 2%, Russell 2000 4%, SOX 4.7%, S&P 500 3.7%, STI 1.8%, Istanbul’s BIST 4.5%, Toronto’s TSX 2.6%, S&P SmallCap 600 2.8% (partially recovering last week’s decline of 5.2%), Nasdaq Biotechnology 5.5%, Nasdaq Composite 4.1% and Australia’s ASX 200 recouped a fraction of the previous week’s 3.9% decline, it rose 1%.

The group of decliners included;

Australian Coking Coal (2.3%), Rotterdam Coal(10.4%), Cocoa (2.3%), Gasoil (2.9%), JKM (2.4%), Tin (6.9%), Natural Gas (9%), Orange Juice (1.9%), Dutch TTF (3.5%), U.S. Gulf Coast Urea (5.4%), Middle East Urea (8.3%) and Oslo’s equity index fell 2.4%.

September 10, 2022

by Rob Zdravevski

rob@karriasset.com.au 

Not trusting some of the signals

In the short-term, markets look like they are about to play a little game which can be considered cruel.

‘Set-ups’ are suggesting rallies and lending to the June and July bottoms holding.

I’ll watch whether those lows still hold or make ‘lower lows’…..and in many assets/securities, I think they will hold.

The head fake may lie with many prices bouncing after having reverted to their long term mean but yet to register Oversold readings.

Keep in mind, that there is no rule saying both need to occur.

I think prices will jump a little, drag in a few more people and then spit them out again in the coming week or three followed up with another swoon.

Markets are cruel.

The price of the Baltic Dry Index and Aluminium are 2 examples, where they have mean reverted but yet to trade to weekly oversold levels and have bounced in the past day or two.

Experience and pattern recognition tells me to be patient for lower prices.

When your count is 3 balls and zero strikes, probability suggests you should ‘take a pitch’. You shouldn’t swing or chase a ball outside of your strike zone.

September 9, 2022
by Rob Zdravevski
rob@karriasset.com.au

Gold today

Gold priced in USD remains in a downtrend.
It’s currently trading at US$1,721

USD Gold would register a weekly oversold reading somewhere between $1,675 – $1,642, which is approximately a further 3% lower today than the current price.

However, my trend analysis for Gold priced in EUR and AUD shows then developing into a new but early ‘daily’ upward trend.

It is early but work watching, as today, Aussie listed gold producers had a positive trading day. Head fakes do occur and there are gaps to be filled in these stocks, so it remains poised but interesting.

September 9, 2022
by Rob Zdravevski
rob@karriasset.com.au

When bond prices trough, tech stocks rally

When tech stocks rallied, bond yields were falling (mainly towards zero). That meant bond prices were rising.

Inversely, when bond prices are declining (and yields are climbing), tech stocks generally fall………to a point…..when bond prices resemble an oversold extreme.

At that point, we’ve seen the commencement or a continuation of a rally in the Nasdaq 100 index.

This theory worked except in January and March 2022. They were moments when the index was reaching extraordinary heights and I’ll need to look into this a little more.

Currently (soon), I think bond yields will moderate (fall), which means bond prices rise. This suggests the Nasdaq 100 also rises.

I’ll continue to mess around with this idea.

September 8, 2022

by Rob Zdravevski

rob@karriasset.com.au

The coming peak in USD and low in commodities

Peaks in the USD/AUD have corresponded with troughs in the CRB Index (give or take 1-3 months)

Keep in mind that the Commodity Research Bureau (CRB) Index calculates the pricing of a basket of 19 commodities with energy contracts comprising nearly 40% of the weighting.

In my recent writings and observations, the energy complex is the last holdout in the current mean reversion in commodity prices.

This and the markets are currently telling me……

1) the USD strength is closing in on a peak, while allowing for one more surge higher (read: probability that AUD sympathetically moves a little lower too)

and

2) I expect energy prices to have one more lower leg or wave (RBOB Gasoline has nearly completed its)

So, I am preparing for another moment where this peak and trough synchronise.

September 8, 2022

by Rob Zdravevski

rob@karriasset.com.au

Seriously long term Overbought extreme in the U.S. Dollar

Adding to last week’s post about the extreme move in the U.S. Dollar’s pendulum…….

…..the chart below reiterates moments when the U.S. Dollar Index (DXY) hits a Monthly RSI Overbought reading along with a 2.5 standard deviations above its rolling monthly mean……

but I have also added a notation to the chart showing the percentage amount that the DXY was/is trading above its 200 MONTH moving average.

The emphasis in this study is that it’s on a Monthly basis, being much longer than my usual ‘weekly’ observations. Day traders need not apply.

September 8, 2022

by Rob Zdravevski

rob@karriasset.com.au

Expressing a view: Mining & Exploration – Imdex

Accumulating shares in Imdex (IMD:ASX) is a one way I am expressing my view amid a larger theme of the world requiring more mining projects to supply a host of ‘ingredients’.

The bigger picture is that I expect mining exploration and production capex to rise over the next decade. While the easy and low hanging fruit (resources) have been had, better technology with be required to aide financing and feasibility decisions.

Imdex also falls into another investment theme which I like being the testing, certification and verification sector.

Put it this way, it’s akin to owning the ‘pick and shovels’ coupled with technological enhancements which assist speed, precision, efficiency and cost savings.

Recently, Imdex shares traded down my longer term ‘Oversold Trifecta’ for only the 5th time in the past 15 years.

Those metrics are a combination of when the share price simultaneously trades 2.5 standard deviations below its rolling weekly mean, (at least) down to or below its 200 week moving average and registers a weekly Oversold RSI (Relative Strength Indicator) reading.

September 8, 2022
by Rob Zdravevski
rob@karriasset.com.au

#Imdex
#mining

* not personal advice
* do your research or see a licensed professional

Still watching the major Oil mean reversion

West Texas Intermediate Crude has broken below an important support line.

A couple more measures need to tick over and then probability of a visit to $75 increases.

Failing to hold $75 then focuses on major support figure of $64 being pondered.

A move to those levels has commensurate reactions in a host of asset and securities prices.

Energy prices are the last holdout of the inflationary surge seen in the past 18 months and their notable weighting in CPI calculations will aide the ‘moderating inflation’ call.

September 7, 2022

by Rob Zdravevski

rob@karriasset.com.au